See the project website for more details and live examples.
An htmlwidgets implementation of Handsontable.js. Per the website:
Handsontable is a minimalist Excel-like data grid editor for HTML & JavaScript
This library was inspired by the shinyTable package. Most of the original functionality was preserved, and the htmlwidgets framework made it possible to leverage even more of the Handsontable.js functionality.
See the vignette for detailed examples and links to shiny apps.
To install from CRAN use
install.packages("rhandsontable")For the latest development version use
devtools::install_github("jrowen/rhandsontable")
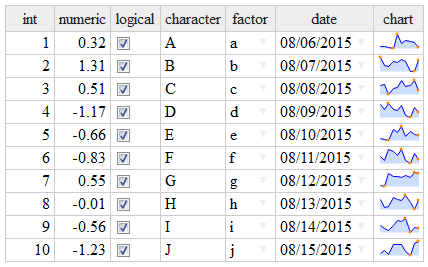
A simple example
library(rhandsontable)

DF = data.frame(int = 1:10,
                numeric = rnorm(10),
                logical = TRUE,
                character = LETTERS[1:10],
                fact = factor(letters[1:10]),
                date = seq(from = Sys.Date(), by = "days", length.out = 10),
                stringsAsFactors = FALSE)

# add a sparkline chart
DF$chart = sapply(1:10, function(x) jsonlite::toJSON(list(values=rnorm(10))))

rhandsontable(DF, rowHeaders = NULL) %>%
  hot_col("chart", renderer = htmlwidgets::JS("renderSparkline"))
A more involved shiny example
shiny::runGitHub("rhandsontable", "jrowen", subdir = "inst/examples/rhandsontable_corr")