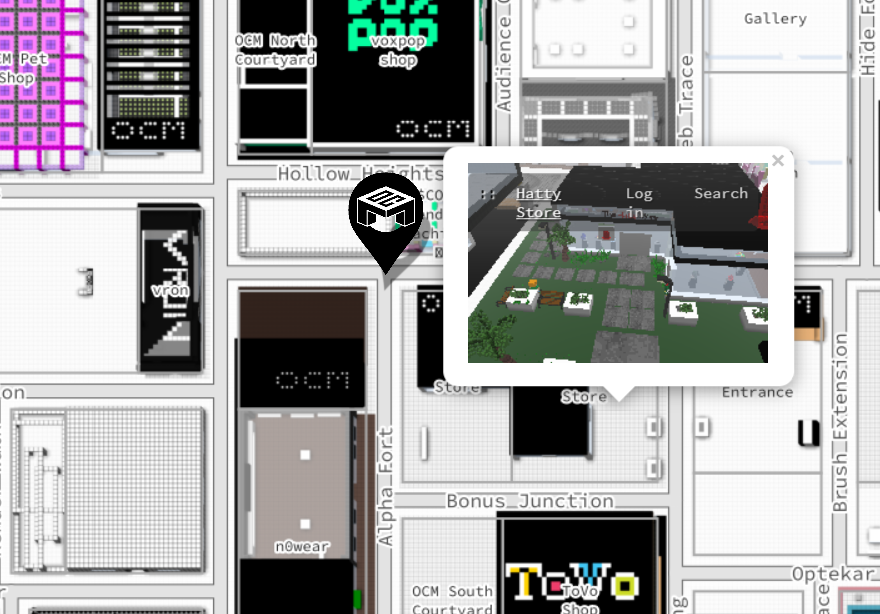
An interactive map that displays in-world in Cryptovoxels and give parcel informations
See demo centered at Origin City Market
The map is initialized with an html div
<div id="cvmap" style="height: 700px; position: relative; outline: none;">
<!-- It is important that the leaflet map is in a "defined" size container Or that it has a defined size.-->
and the following script
       var CVmap = L.map('cvmap').setView([1.80, 0.98], 9);
      /* Load the tileLayer x and y*/
      L.tileLayer(`https://map.cryptovoxels.com/tile?z={z}&x={x}&y={y}`, {
        minZoom: 3,
        maxZoom: 20,
        attribution: 'Map data © Cryptovoxels',
        id: 'cryptovoxels'
      }).addTo(CVmap)
The function
SetView()
has two arguments:
- One, an array [X,Y] defining the intial center. A positive X means it's east and a positive Y means north.
- The second argument is the initial zoom.
For more info on leaflet functions: the Leaflet Documentation
To convert Cryptovoxels' coordinates to [X,Y], just divide the CV's coords by 100.
The rest of the script element is for markers and popups
The content of the popup is in:
         .setContent(`<div class="container-fluid" style="display:inline-block;"> <div class="title_box" ><div class="title_name" style="text-align: left;float:left;"></div><div class="title_owner" style="text-align: right;"></div></div>
         <div class="title_box" ><div class="" style="text-align: left;float:left;"></div><div class="collab_box" style="float:right;text-align: right;"></div></div>
         <iframe id="cryptovoxel" src="https://www.cryptovoxels.com/play${playCoord}&mode=orbit" scrolling="no" frameborder="0" style="border:none; overflow:hidden; width:18rem; height:100%; min-height:7rem;" allowTransparency="true" sandbox="allow-scripts allow-same-origin">
         </div>`)
Note Cryptovoxels is in an iframe and has the flag "&mode=orbit". For more info on flags visit the Cryptovoxels Documentation You can edit the size of the iframe by editing the style tag in the HTML code.
The map now shows info of the parcel by getting it from the Cryptovoxels API. In app.js there are two function that calls for data.
-
getDataLocal() which take a file that has already been formated to geoJSON. if you don't know how to convert the data to geoJSON, feel free to use this url: https://benjythebee.github.io/parceldata/parcels.owner&contributors.json or https://benjythebee.github.io/parceldata/parcels.geo.json and
-
getDataGET() which takes straight up from cryptovoxels.com and converts it to geoJSON. It works fine only if you run it server side.
The JSON files in the api folder are geoJSON formatted. For example the parcels.owner&contributors.json file looks a bit like this:
{"parcels":[{
  "type":"Feature",
  "properties":{
    "name":"Metaverse",
    "id":1,
    "address":"70 Block Fork",
    "owner":"0xe5a994be9e94513bcb1a0a5991470d9fde380d26",
    "owner_name":null,
    "contributors":["0x4595ff64328faf80a8cf0d52355639984b6af23c",""]
    },
    "geometry":{
      "type":"Polygon",
      "coordinates":[[[0.15,0.02],[0.02,0.02],[0.02,0.2],[0.15,0.2],[0.15,0.02]]
      ]
      }
      },...
You can have a look at app.js for how the call is made
Also note that if a user is not connected to Cryptovoxels, that person will be spammed by metamask to connect. If anyonw has a solution for that please let me know.
Made by me/Fayelure, with resources from Cryptovoxels and Leaflet.
