Warning
This tool is no longer maintaned. For inquiries about this or other BioData.pt | ELIXIR Portugal tools and services, please reach out to info@biodata.pt.
This work is licensed under a Creative Commons Attribution 4.0 International License.

Have questions? Email us at info@biodata.pt
If you would like to contribute to this tool, please read our Code of Conduct and Contributing guidelines at https://github.com/BioData-PT/Documents
D-cellerate is a web application that provides a graphical interface for Seurat version 3, a popular single-cell RNA-seq (scRNA-seq) package for R. It provides an easy-to-use UI and the ability to export results as an HTML file.
D-cellerate is distributed as an R package, which can be installed by using the devtools package.
devtools::install_github("https://github.com/BioData-PT/D-cellerate")
This will install the D-cellerate package and package dependencies.
Alternatively, you can obtain the D-cellerate Docker image by typing the following in your terminal:
docker pull hmcs/d-cellerate-docker:latest
The Docker image is useful to deploy D-cellerate quickly and without having to handle dependency issues.
To launch the D-cellerate package, use the command Dcellerate::launchApp() in your R console. This will launch an instance of D-cellerate on port 4800. To access D-cellerate, type localhost:4800 or 127.1.0.0.1:4800 in your web browser's address bar.
If you are using the Docker version, enter the command docker run -d -p 3838:3838 hmcs/d-cellerate-docker on your terminal. This command should run an instance of D-cellerate on localhost:3838
Note for Docker Toolbox users: If you are using the Docker Toolbox for Windows and Mac, D-cellerate will not run on localhost. Instead, it will run on port 3838 of the Toolbox virtual machine's IP, which can be found with the command docker-machine ip or in the first message that appears when booting Docker Toolbox. The default IP is usually 192.168.99.100, meaning the app will run on 192.168.99.100:3838
D-cellerate implements a variety of features from the Seurat package with an easy to use GUI, as well as providing methods to filter data.
D-cellerate accepts three types of data as an input.
- Tabular data, such as .csv or .tsv files
- Drop-seq tools outputs
- Cellranger HDF5 output files
D-cellerate includes several options to filter your dataset.
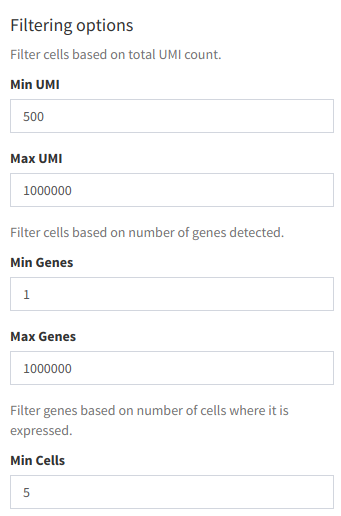
Part of the filtering menu
Filtering options are as follows:
- Min UMI: Removes cells where the number of unique molecular identifiers (UMI) found is lower than the specified number.
- Max UMI: Removes cells where the number of UMI found is higher than the specified number.
- Min Genes: Removes cells where the number of genes found is lower than the specified number.
- Max Genes: Removes cells where the number of genes found is higher than the specified number.
- Min Cells: Removes genes based on number of cells where it is expressed.
- Pattern for mitochondrial genes: Subsets mitochondrial genes based on a regular expression (e.g. ^mt- for mouse or ^MT- for human).
- Sample cells: Randomly samples a subset of cells that pass the above filters, allowing for quicker data exploration before using the full dataset.
Filtering results are displayed in adjacent plots, as well as a table that provides a summary of the filtering process.
The barcode plot shows the total UMI per barcode, where the barcodes that were not filtered out and were selected for further analysis are displayed in the green line.
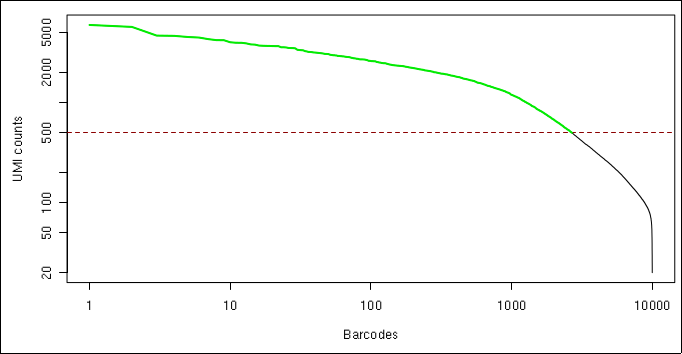
Barcode plot
A set of violin plots shows the total distributions of total UMI per cell (left plot), and the number of detected genes per cell (right plot).
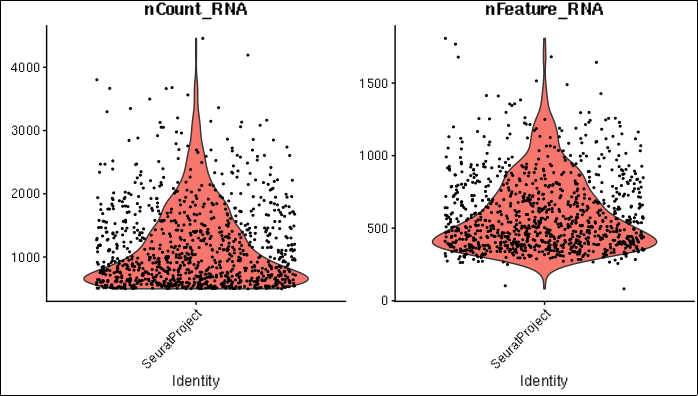
Violin plots
A summary allows the user to track the filtering process, and see how many barcodes and genes passed through for further analysis.
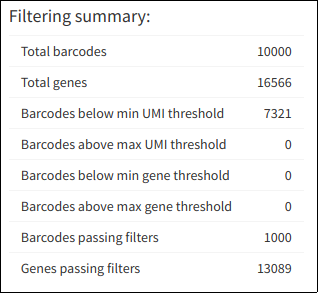
Summary
Normalizes gene expression across all cells through log transformation. The output is presented in a barplot.
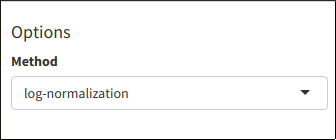
Log-normalization menu
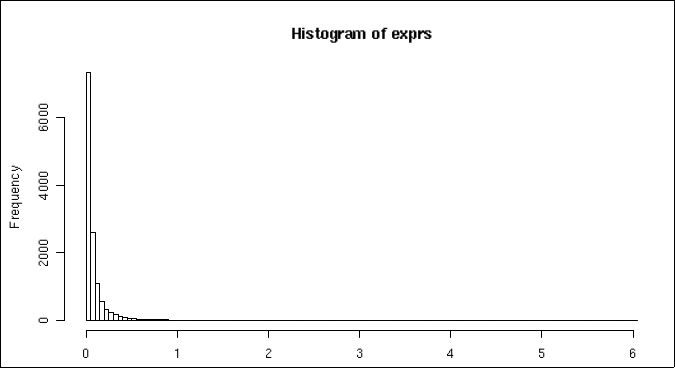
Histogram of mean gene expressin across all cells
D-cellerate allows the user to identify variable and non-variable genes, as well as identify features that are outliers on a mean variability plot.
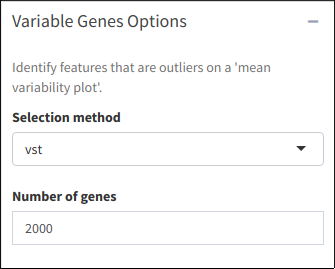
Variable genes settings
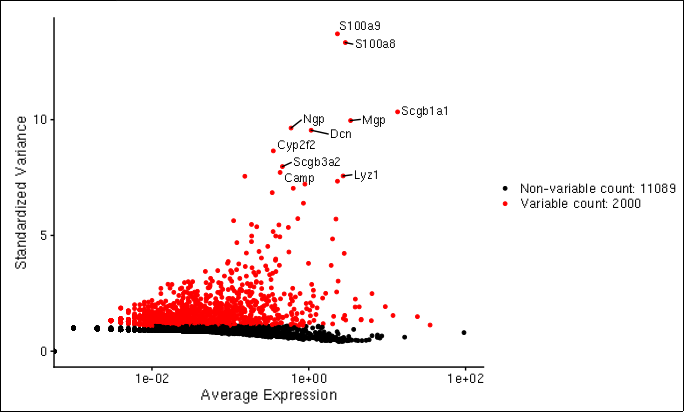
Mean variablity plot
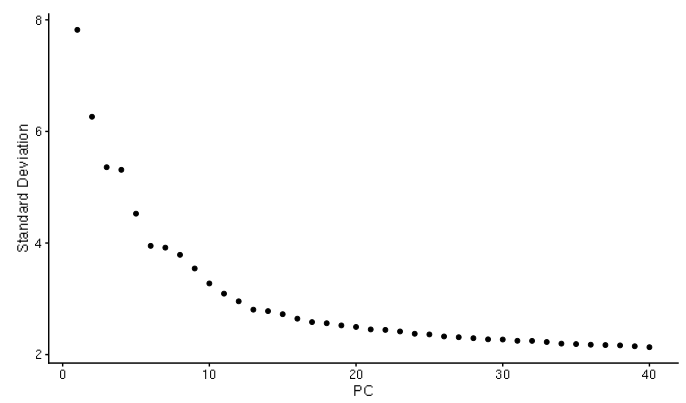
D-cellerate performs a principal components analysis (PCA) with either the variable genes or all genes in the cell. It will output a scree plot showing the proportion of variance explained by each principal component, as well as Scatterplots of the output of the principal component analysis.
PCA plot
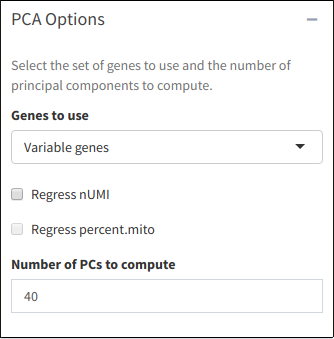
PCA options menu
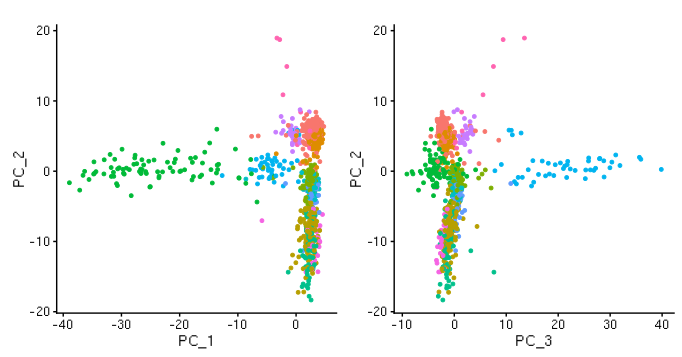
PCA plots
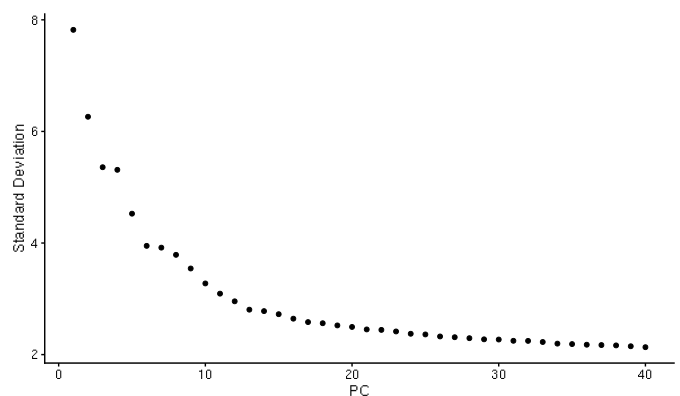
Elbow plot
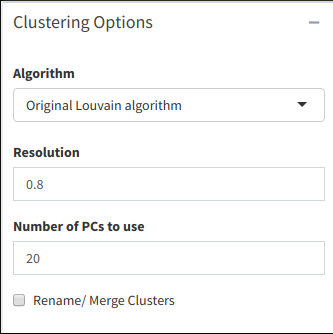
Dimensional reduction is performed using t-SNE, and is followed by a clustering analysis.
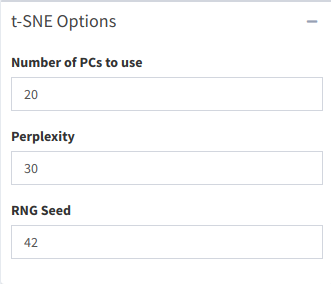
t-SNE options
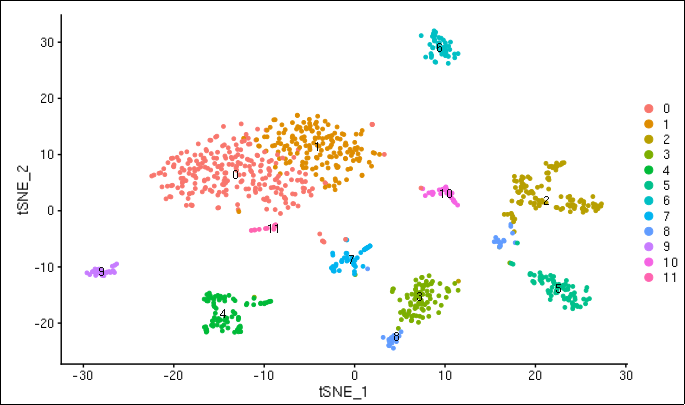
Cluster plot
Marker gene discovery tests the various clusters generated in the clustering test to find markers. The available tests are the Wilcoxon rank sum, Student's t-test and Student's AUC classifier.
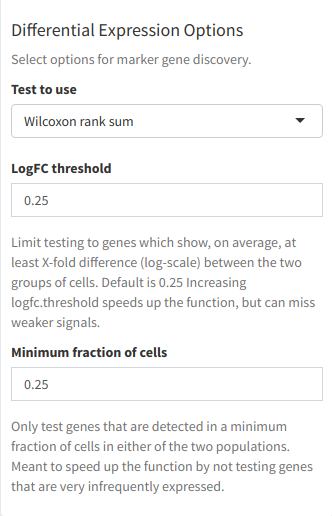
Differential expression menu
There are three outputs for this section: A differential expression table, a gene expression heatmap and t-SNE cluster plots for marker visualization in clusters.
The differential expression table finds differentially expressed genes between clusters, and displays them in a tabular format.
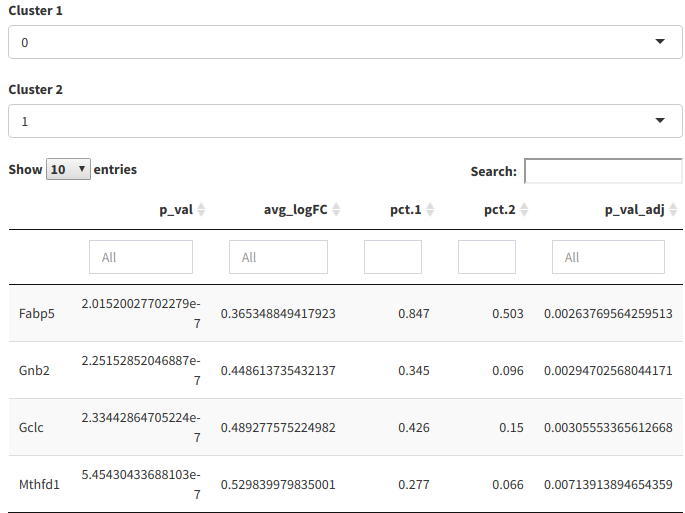
Differential expression table
The heatmap shows the top markers for each cluster.
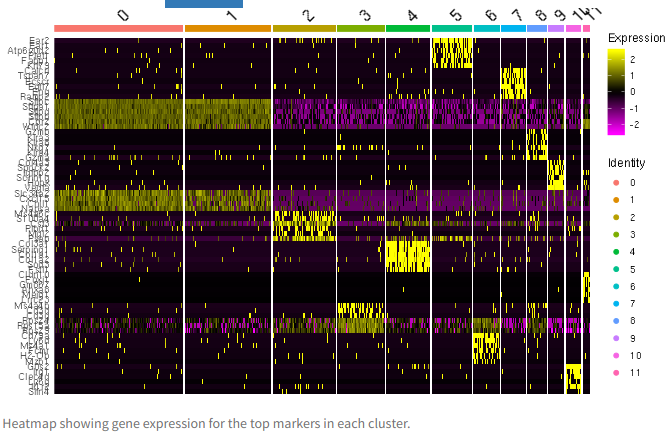
Top markers heatmap
The t-SNE plot(s) show marker gene expression per cluster.
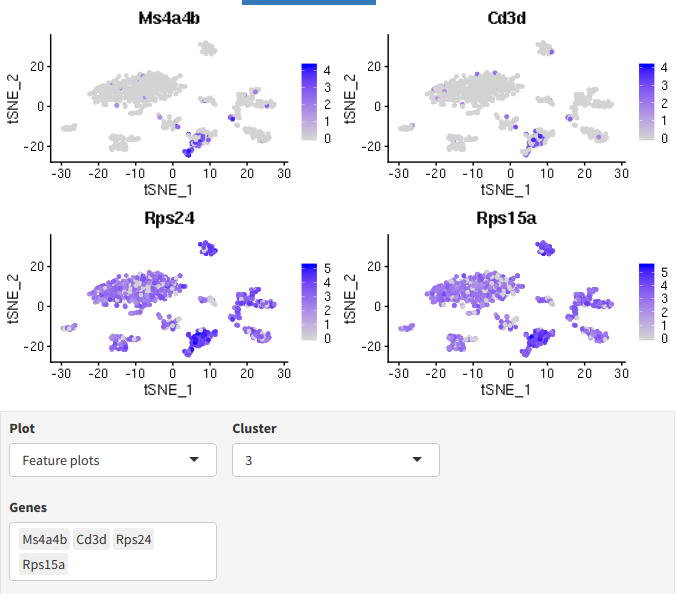
Marker visualization plots
D-cellerate exports results as an HTML report. In order to ensure analysis reproducibility, the report includes both plots and code. Furthermore, if the user intends to perform various analyses, the user can bookmark the application state, saving the variables used for the analysis so that another analysis can be safely run.