Configurable Sunburst visualization that is easy to use. Built using D3. Has tooltips, optional breadcrumbs, label customisations and numerous color schemes. Works in dark-mode. Sunburst charts are useful to display hierarchical data.
Copyright (C) 2020 Chris Younger | Splunkbase | Source code | Questions, Bugs or Suggestions | My Splunk apps
This visualisation expects tabular data, with any amount of text/category columns, but the last column must be a numerical value. Null or blank columns are allowed before the final column to create a more "sunburst-y" visualization.
The typical search uses stats command like so:
index=* | stats count BY index sourcetype source
Sidenote: a much faster search to do the same thing is
|tstats count where index=* BY index sourcetype source
Note that stats does not return rows when the group BY field is null. Use this one simple trick to convert nulls to be an empty string instead:
index=_internal | eval component = coalesce(component,"") | eval log_level = coalesce(log_level,"") | stats count BY sourcetype component log_level
Add more fields after the "BY" keyword to increase the depth of the sunburst
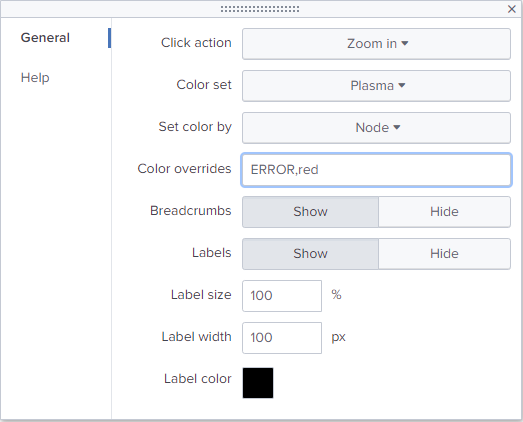
The "Color overrides" field accepts either a JSON object (in curly braces) or comma separated pairs. For example to make sure that "INFO" values are green, WARN's are orange and ERROR's are red, set the value like so:
INFO,#1a9035,ERROR,#b22b32,WARN,#AF5300
The Click Action setting under Format Visualization has four settings:
None - Nothing will happen when the sunburst is clicked
Zoom in - The sunburst will display only two rings at a time. Clicking a ring will filter the sunburst to that slice, displaying its subcategories as the inner ring. To zoom back out, click the whitespace inside the inner ring
Drilldown to search - Clicking the sunburst will open the underlying SPL as a search
Set tokens $sunburst_viz_{field}$ - Clicking the sunburst will set tokens with names according to the field values in your result set. Tokens will be set all the way down to the subcategory that is clicked, so if you have "| stats count by index source sourcetype", clicking a value in the source ring will set tokens $sunburst_viz_index$ and $sunburst_viz_source$, but not $sunburst_viz_sourcetype$.
The following third-party libraries are used by this app. Thank you!
- jQuery - MIT - https://jquery.com/
- D3 - BSD 3-Clause - https://d3js.org/

