Hi!
I'm Jesús Caballero, a Sauti Market Monitoring market team member, especially from the DS team and I'll try to explain to you where we got and what we think could be done from this point forward. As you may know, this project is meant to provide real-time prices of the commodities in the East of Africa, but more important than that, the phase of the prices. If a price is in a particular phase, the aid workers could be sent the help to the specific community in need.
We chose to rely on an industry-standard index called AlPS, which was developed by the World Food Program. You may find their methodology in a PDF in this repository. Due to the raw data, that is poor in terms of length, we only could work with the ALPS for only four time-series of almost 10K. So, we had to think of another possible way. The ALPS demands at least 3 years of historical data, but I felt we should consider 4 years or more of historical data, to capture better seasonalities. On the other hand, our Stakeholder suggested us to relax the requirements. Consider less length of data and see what happens. We did that. We relaxed to 2 years of data. In the case, we named the methodology as weak ALPS.
Even relaxing the ALPS requirements we were getting around 28 time-series with their prices labeled. We need to think in another way. So we decided to change the base ALPS which is Linear Regression to an ARIMA (forecasting). This was a success for us, we get more than 100 time-series with phases.
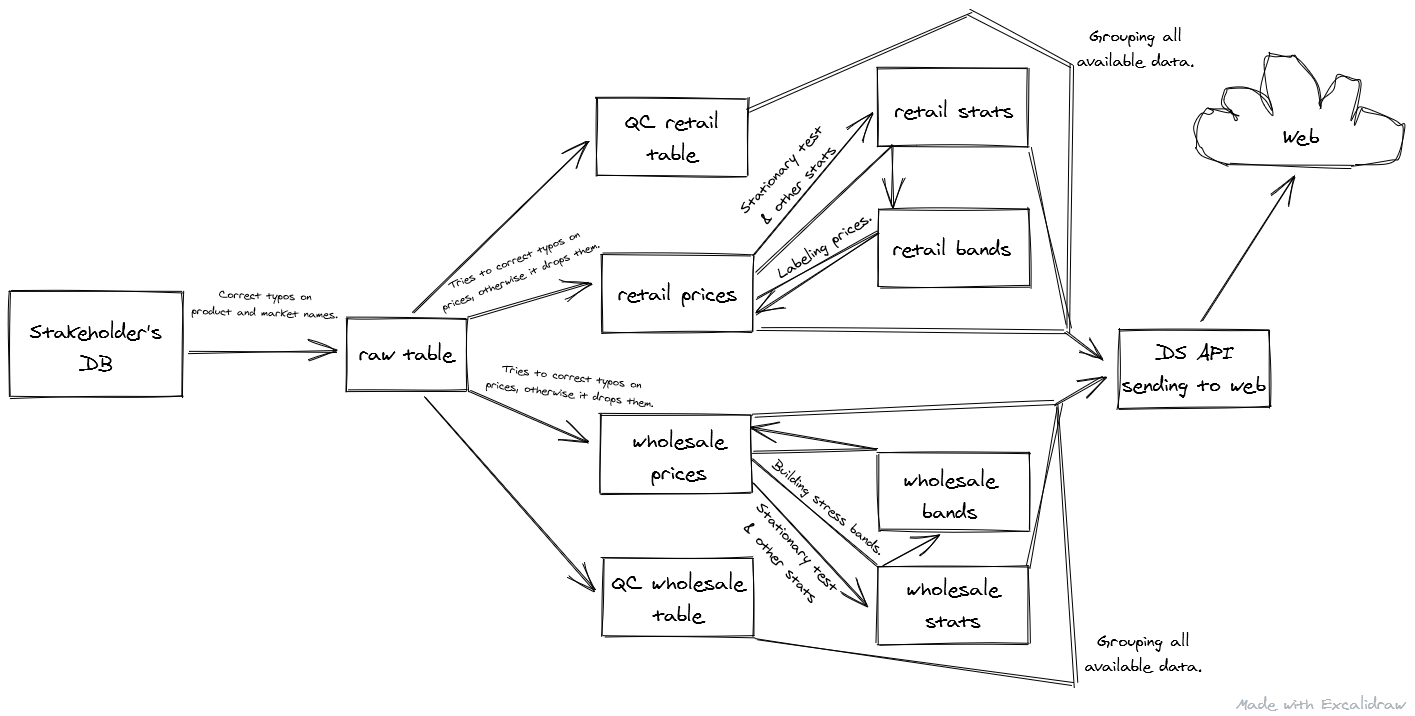
About the architecture. We build the following schema of the architecture. The general idea is this:
We pull the raw data from the Stakeholder database. There are typos or misspelling words. The first script (aws_collect_data) tries to correct that with the help of dictionaries and lists script. If some products couldn't be corrected, those logs will be dropped in the error logs table. Also, we don't manipulate the numerical data, so anyone could try to drop the outliers or numerical typos the better way they considered.
The second script (split_bc_drop) will try to correct decimal point misplaced, drop outliers, and prices at zero making no sense. It also divides the original table into two tables: retail and wholesale prices.
A third script (qc_tables) makes some analysis of the data and drops the results into the QC retail or QC wholesale table.
From this point, every method is duplicated in the other way. So I'll focus on the retail branch. The next script (data stats) drops some important stats from the 'cleaned' data including the test for stationary.
With this info, we can know in which time series we can focus on and build the ALPS bands with we can compare the prices and have a phase to show for the end-user using bands_construction.
Once we have all this, we can wrap (using update_price_tables) all the info and deliver this to the web-app to be displayed, using an API deployed on Heroku.
I believe the following improvements could be done:
Look for the series that are not at this time stationary, and work on trying to turn them stationary. Look for time-series whose are lacking length are try to get some historical data for those, by other means. Analyze if the ARIMA based version of the ALPS is more accurate for the stakeholder, I have this feeling. Almost all the built is done the way to be automatized, but you have maybe to polish some details and built the cron job as well. Forecast trend of the prices. DS team has built the ground level of these. We have some results using Facebook Prophet and also Holter-Winters. Check out the notebooks.
This is the list of notebooks and other helpful scripts you may found in this repository:
verify conn - verify the connection with the database create schema - creates the whole schema of the database. function and classes - a script with a handful set of functions used on this project. Global Methodology - It explains the main methodology.
