covid-modeling is a repository built with the purpose of fetching latest data, processing and modeling Covid-19 for reference and decision support. It is designed to be simple yet concrete so sufficient information can be retrieved. Users can modify criterias parameters to their desire, which will affect how processing and modeling steps will be done. Since creator is from Vietnam, a little more in-depth analysis is carried out for Vietnam.
covid-modeling is built as a local machine application, it uses browser UI and Dash to launch. Most of the working processes will happen on local machine without interactions with a server, except for downloading initial databases. The purpose of this is for faster calculation since the application will depend only on the local machine and remove the necessary of data transferring between user and server, which can sometime become a bottleneck for the application.
There are 2 ways to use this repository:
- Use the given notebooks in the repository to work directly with if you want more control over parameters, the methodology is the same as the web application. Put the notebooks in a same folder and run it step by step (Collection>Preparation>Modeling), the all process results will be returned in
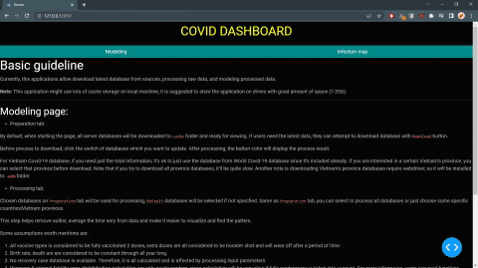
databasedirectory. - Use the web application by running
main.pyfor simple user interaction, it will cache the latest server databases to your local machine (which might take a while to create caches). After that, users can try to gather latest data (server is only updated weekly), change how to process raw data & modeling.
After copy the repository to your local machine, it is recommended to create a new environment to work with and install all required packages from requirement.txt.
- For Conda distribution users:
Create new environment:
conda create --name <env_name>
Activate environment:
conda activate <env_name>
Download required packages:
pip install -r requirement.txt
- For new Python user: Download Python 3.9.13
Make new directory (for repository storage):
mkdir <repository_directory>
Change to directory:
cd <repository_directory>
Create new environment:
python -m venv <env_name>
Activate environment:
If iOS: source <env_name>/bin/activate, if Window: .<env_name>\Scripts\activate
Download required packages:
pip install -r requirement.txt
- Application start up:
After copy the repository and installation environment, we activate the environment and run the main script python main.py from a command prompt within the repository, copy the URL pop up in the command prompt to a browser to start the application.
Due to background_callback of Dash is incompatible with conversion step to executive file, it's currently not possible to run the application directly as an executable file. Therefore, unfamiliar users have to set up their own Python environment for the application to work. If anyone can help me set up PyInstaller or similar modules for Dash app, feel free to contact me.
Many groups of scientists have development complex models to predict the pattern of virus infection. Some of which are too complicated for normal people to understand, so a simple SVID model was built and applied in this repository.
A ordinary differential equation system is built to estimate the spread of Covid-19 virus base on the following information.
The population will be broken down into 4 groups (S+V+I+D=N):
- Susceptible (S): The main population which is susceptible to the disease without any protection (person).
- Vaccinated (V): The population which has been vaccinated or recovers from the disease and has protection against the disease to some degree (person).
- Infectious (I): The infected population, whom can infect the non-infected population (person).
- Dead (D): The population which passes away due to the disease (disease-induced mortality) (person).
- Affected population (N): The total population which is affected by the disease (person).
The ODE (ordinary differential equation) model:
With initial conditions as follows:
And model parameter as follows:
By solving the ODE system we can get the stability points:
From there, we can possibly have two answers:
- Disease free equilibrium (DFE): The point at which the population is disease-free,where as:
- Endemic Equilibrium (EE): The point at which the disease is at equilibrium point (the disease is not totally eradicated and remains in the population).
*where:
Since model parameters is time depedent and susceptible to external forces, it seems more appropriate to use forecasted parameters for model predictions instead of constant values. There are currently 2 method used to estimate the model parameters: SARIMA and regression.
The model will show users the current state of of the disease, future prediction for a set period of time and other information such as: daily case infected, daily recovery case, etc.
E.g:


This is a personal project made with 💖 from Kha Nguyen Minh. It is used for acadamic and reference purposes. Creator have no influence and takes no responsibility for decisions made by agencies using this repository.
Data sources:
- Our World in Data - Worldwide Covid-19 database used in the model are mainly gathered from here.
- VNCDC - Vietnam Covid-19 database used in the model are mainly gathered from here.
- VN Ministry of Health - Vietnam vaccination & distribution database.
- Wikipedia - Vietnam vaccine import data
- CSSE at Johns Hopkins University - databases are used for comparison.
- UN Department of Social and Affairs - census databases.
- Vietnam General Statistics Office - Vietnam census database.
- WHO - vaccination metadata
- Climate Change Knowledge Portal - Environment temperature data
- Undata - Wind speed data
Model methodology references: The repository was inspired by some of the references shown below.
- Compartmental models in epidemiology - Commonly used models in epidemic
- The basic reproduction number of the new coronavirus pandemic with mortality for India, the Syrian Arab Republic, the United States, Yemen, China, France, Nigeria and Russia with different rate of cases - Covid-19 SIRD model mathematical proof, with a good explaination on how to calculate reproduction rate from eigenvalue of Jacobian matrix.
- Reproduction numbers of infectious disease models - Various endemic models with calculated reproduction rates
- Model the transmission dynamics of COVID-19 propagation with public health intervention - an article on a complex model that shows the connections between exposed population, incubation period, quarantine population, etc. The article also explains how to calculate EE and DFE points.
- Mathematical assessment of the impact of non-pharmaceutical interventions on curtailing the 2019 novel Coronavirus - A good article for understanding the model parameters meaning and calculate EE, DFE.
- A Mathematical Model of COVID-19 with Vaccination and Treatment - This article show the effect of population change and vaccinations on infection rate, also some good reference parameter values to start.
- Dynamic behaviors of a modified SIR model with nonlinear incidence and recovery rates - this modified SIR model also include the effect of natural death rate to the model.
- Optimal Control applied to SIRD model of COVID 19 - SIRD model with a good mathematic proof of calculating reproduction rate and EE point.
- A model and predictions for COVID-19 considering population behavior and vaccination - A good simple model with effect of population and vaccination on infection rate, as well as consider recovered cases as vaccinated cases.
- A systems approach to biology - A lecture on system stability, how to use Jacobian matrix and calculate eigenvalue
- Lecture on system stability - A good small course on system stability
- Modelling Epidemic - A short lecture on some important endemic definitions
Model parameters: Some references on how to calculate model parameter of ODE systems from real|processed database
- Modified SIRD Model for COVID-19 Spread Prediction for Northern and Southern States of India
- COVID-19 Lifecycle: Predictive Modelling of States in India
- Estimating and Simulating a SIRD Model of COVID-19 for Many Countries, States, and Cities
- Fast estimation of time-varying infectious disease transmission rates - Good article on how to calculate time depenent parameters.
- Advanced epidemic models - Learn to understand 2 form of infection rates.
Python model references:
- Mathematical Modelling: Modelling the Spread of Diseases with SIRD Model
- COVID-19 data with SIR model
- Modeling and Control of a Campus Outbreak of Coronavirus COVID-19
- Analysis of a COVID-19 compartmental model: a mathematical and computational approach
SARIMA model references: