![]()
Water Supply Forecast competition model
Competition URL: Water Supply Forecast Rodeo
This repository contains all the necessary materials to reproduce the results of the competition. This module can also be seen as a sandbox for experimentation
More or less complete description about how the algorithm works can be found in the PDF file:
Water_Supply_Forecast_Rodeo_Dreamlone_report.pdf
This repository contains code both for preparing visualisations and for training and applying predictive models.
Load the data and put it into data folder:
grace_indicatorsfolder: (FY2009, FY2010, ...)pdsifolder: (FY2009, FY2010, ...)snodasfolder: (FY2009, FY2010, ...)teleconnectionsfolder: (mjo.txt, nino_regions_sst.txt, oni.txt, pdo.txt, pna.txt, soi.txt)usgs_streamflowfolder: (FY1990, FY1991, ...)geospatial.gpkgmetadata_TdPVeJC.csvsubmission_format.csvtest_monthly_naturalized_flow.csvtrain.csvtrain_monthly_naturalized_flow.csv
After that repository is ready for experiments and data exploration It is recommended to start exploration with examples folder:
- 1_basic - basic scripts that prepare exploratory data visualisations;
- 2_repeating - repeating of last known values to generate forecasts (in two versions);
- 3_streamflow - use of aggregated statistics from USGS streamflow data;
- 4_snotel - use of aggregated statistics from snowpack SNOTEL data;
- 5_simple_ensemble - ensemble of previous forecasts from data sources;
- 6_simple_ensemble_with_smoothing - ensembling with smoothing;
- 7_snodas - use aggregated statistics of SNODAS (snow gridded) data;
- 8_teleconnections - teleconnections with snotel data;
- 9_common_ver_1 - complex model which use SNOTEL, PDSI and Climate indices data to generate predictions - Model on Hindcast Stage;
- 9_common_ver_2 - complex model which use SNOTEL and PDSI data to generate predictions;
- 10_common_experiment - set of functions to provide hyperparameters search space exploration for common model - Model on Forecast Stage;
- 11_cross_validation_final_model - code for cross validation of the final submission execution - Final Prize Stage
In the folders with submit prefix placed the code for execution stage (including serialized models).
During code execution the plots folder is generated.
For example, there you can find zones for which forecast models are initialized:
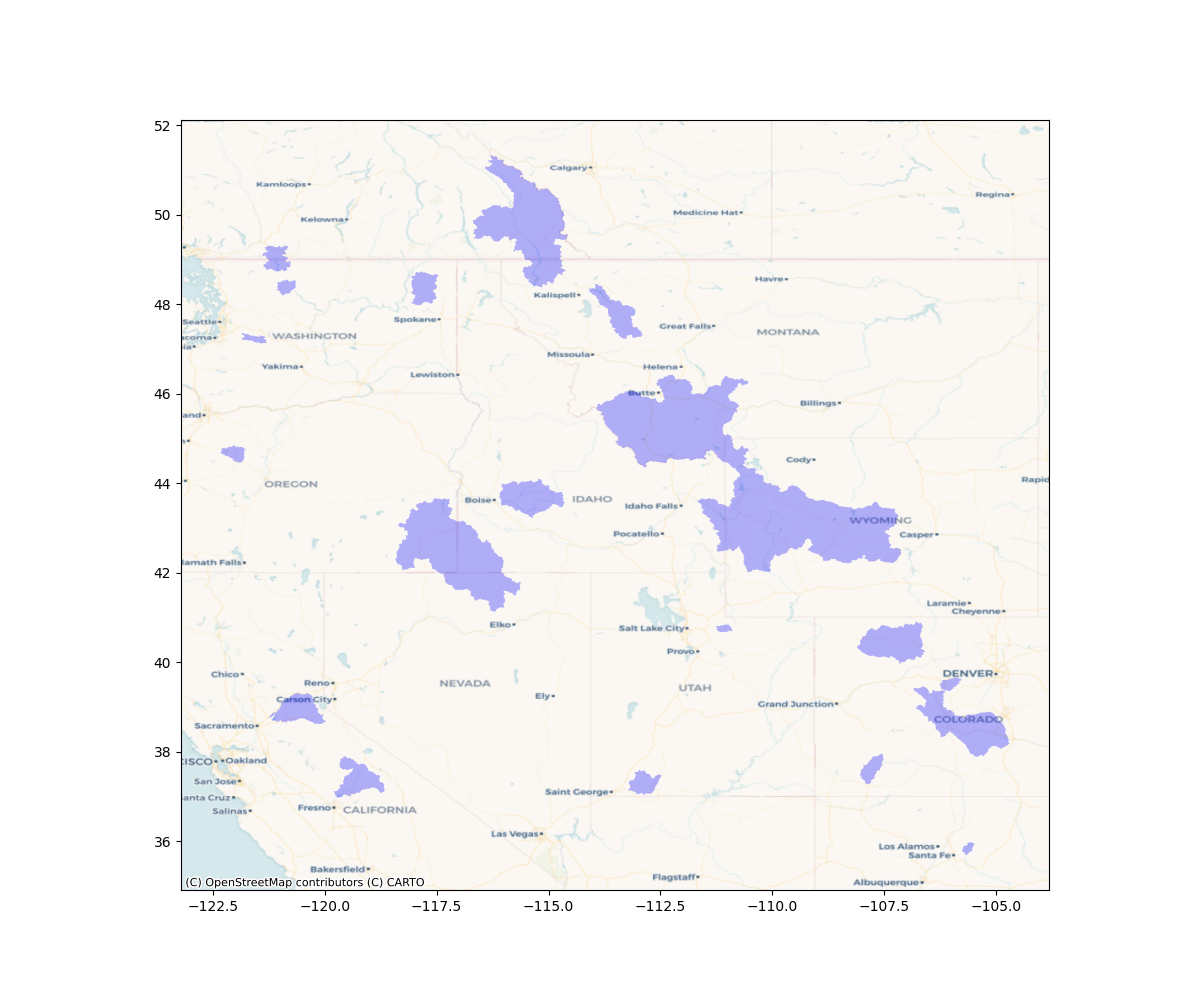
Figure 1. Spatial polygons for river basins
This section provides explanations that explain how the algorithms work
Validation years: 2016, 2017, 2018, 2019, 2020, 2021, 2022, 2023
- MAE metric: 396.65
- MAPE metric: 56.50
- Symmetric MAPE metric: 61.37
- Quantile loss metric: 367.66
- Quantile loss metric (only for 0.5 quantile): 396.65
The simplest possible algorithm. For provided above validation years the algorithm takes the value from 2015 and assigns it to each subsequent year.
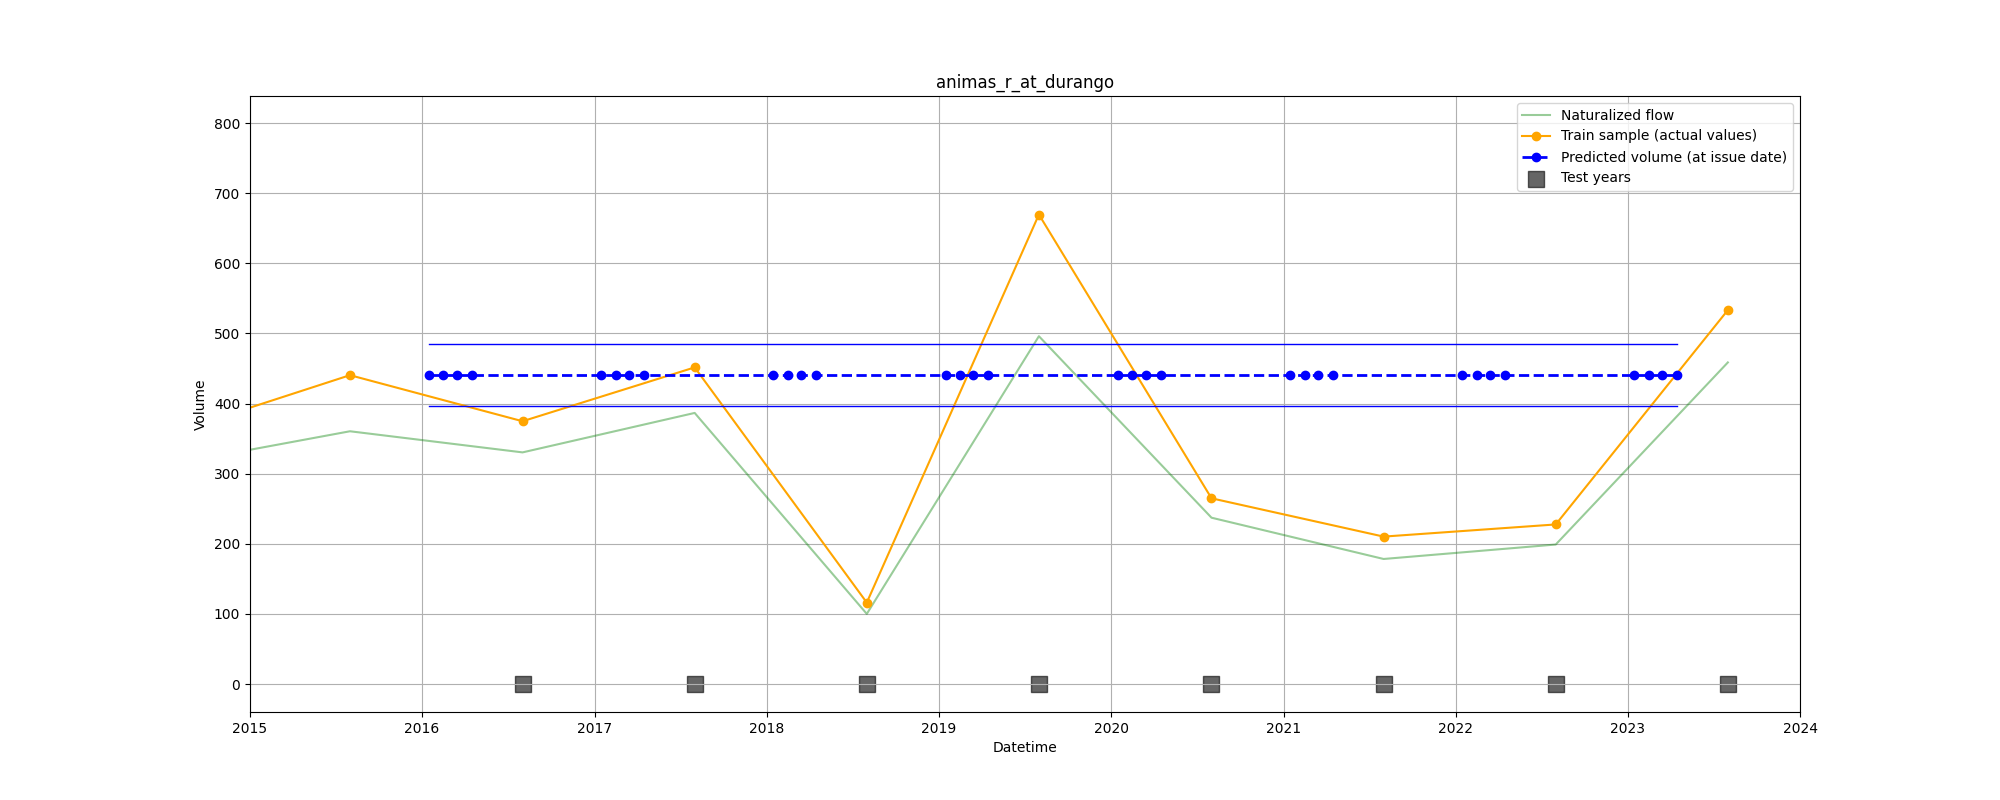
Figure 2. Forecasts for tests years for site animas_r_at_durango using simple
repeating since 2015
Validation years: 2016, 2017, 2018, 2019, 2020, 2021, 2022, 2023
- MAE metric: 386.02
- MAPE metric: 59.98
- Symmetric MAPE metric: 52.97
- Quantile loss metric: 275.82
- Quantile loss metric (only for 0.5 quantile): 386.02
Uses values from the previous year for this site to be used as a forecast. That is, for 2005 the year 2004 will be used, for 2007 the year 2006 will be used, etc.
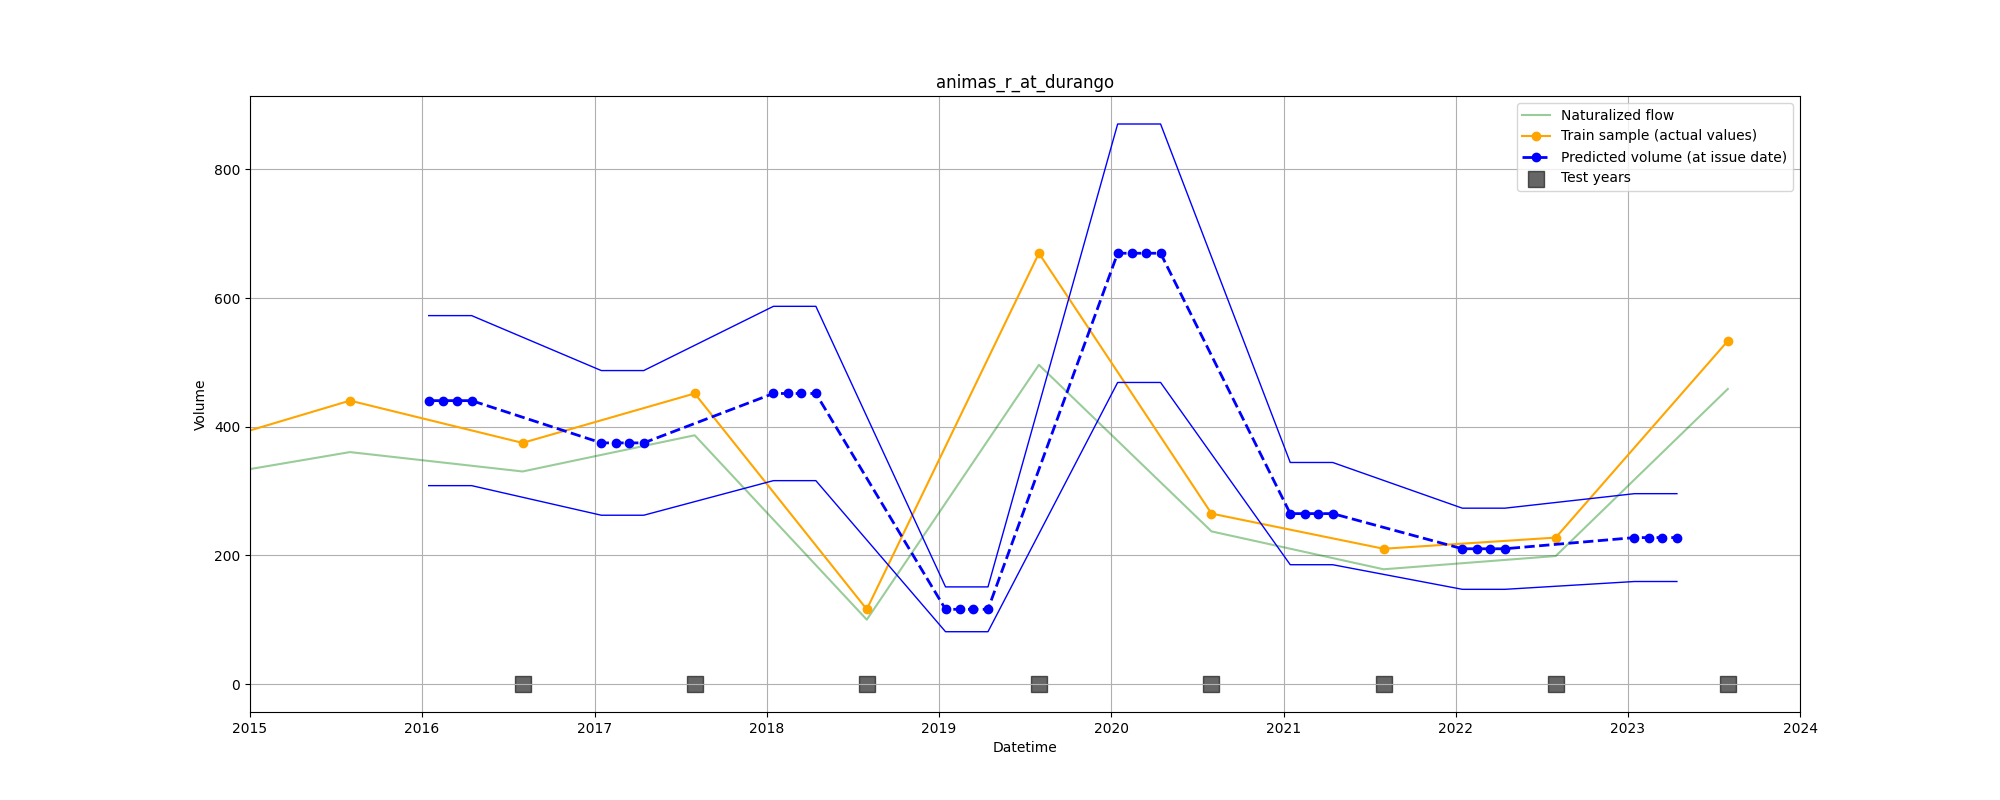
Figure 3. Forecasts for tests years for site animas_r_at_durango using
advanced repeating
All algorithms in the section below use the aggregation of historical data prior to the issue date as follows (Figure 4)
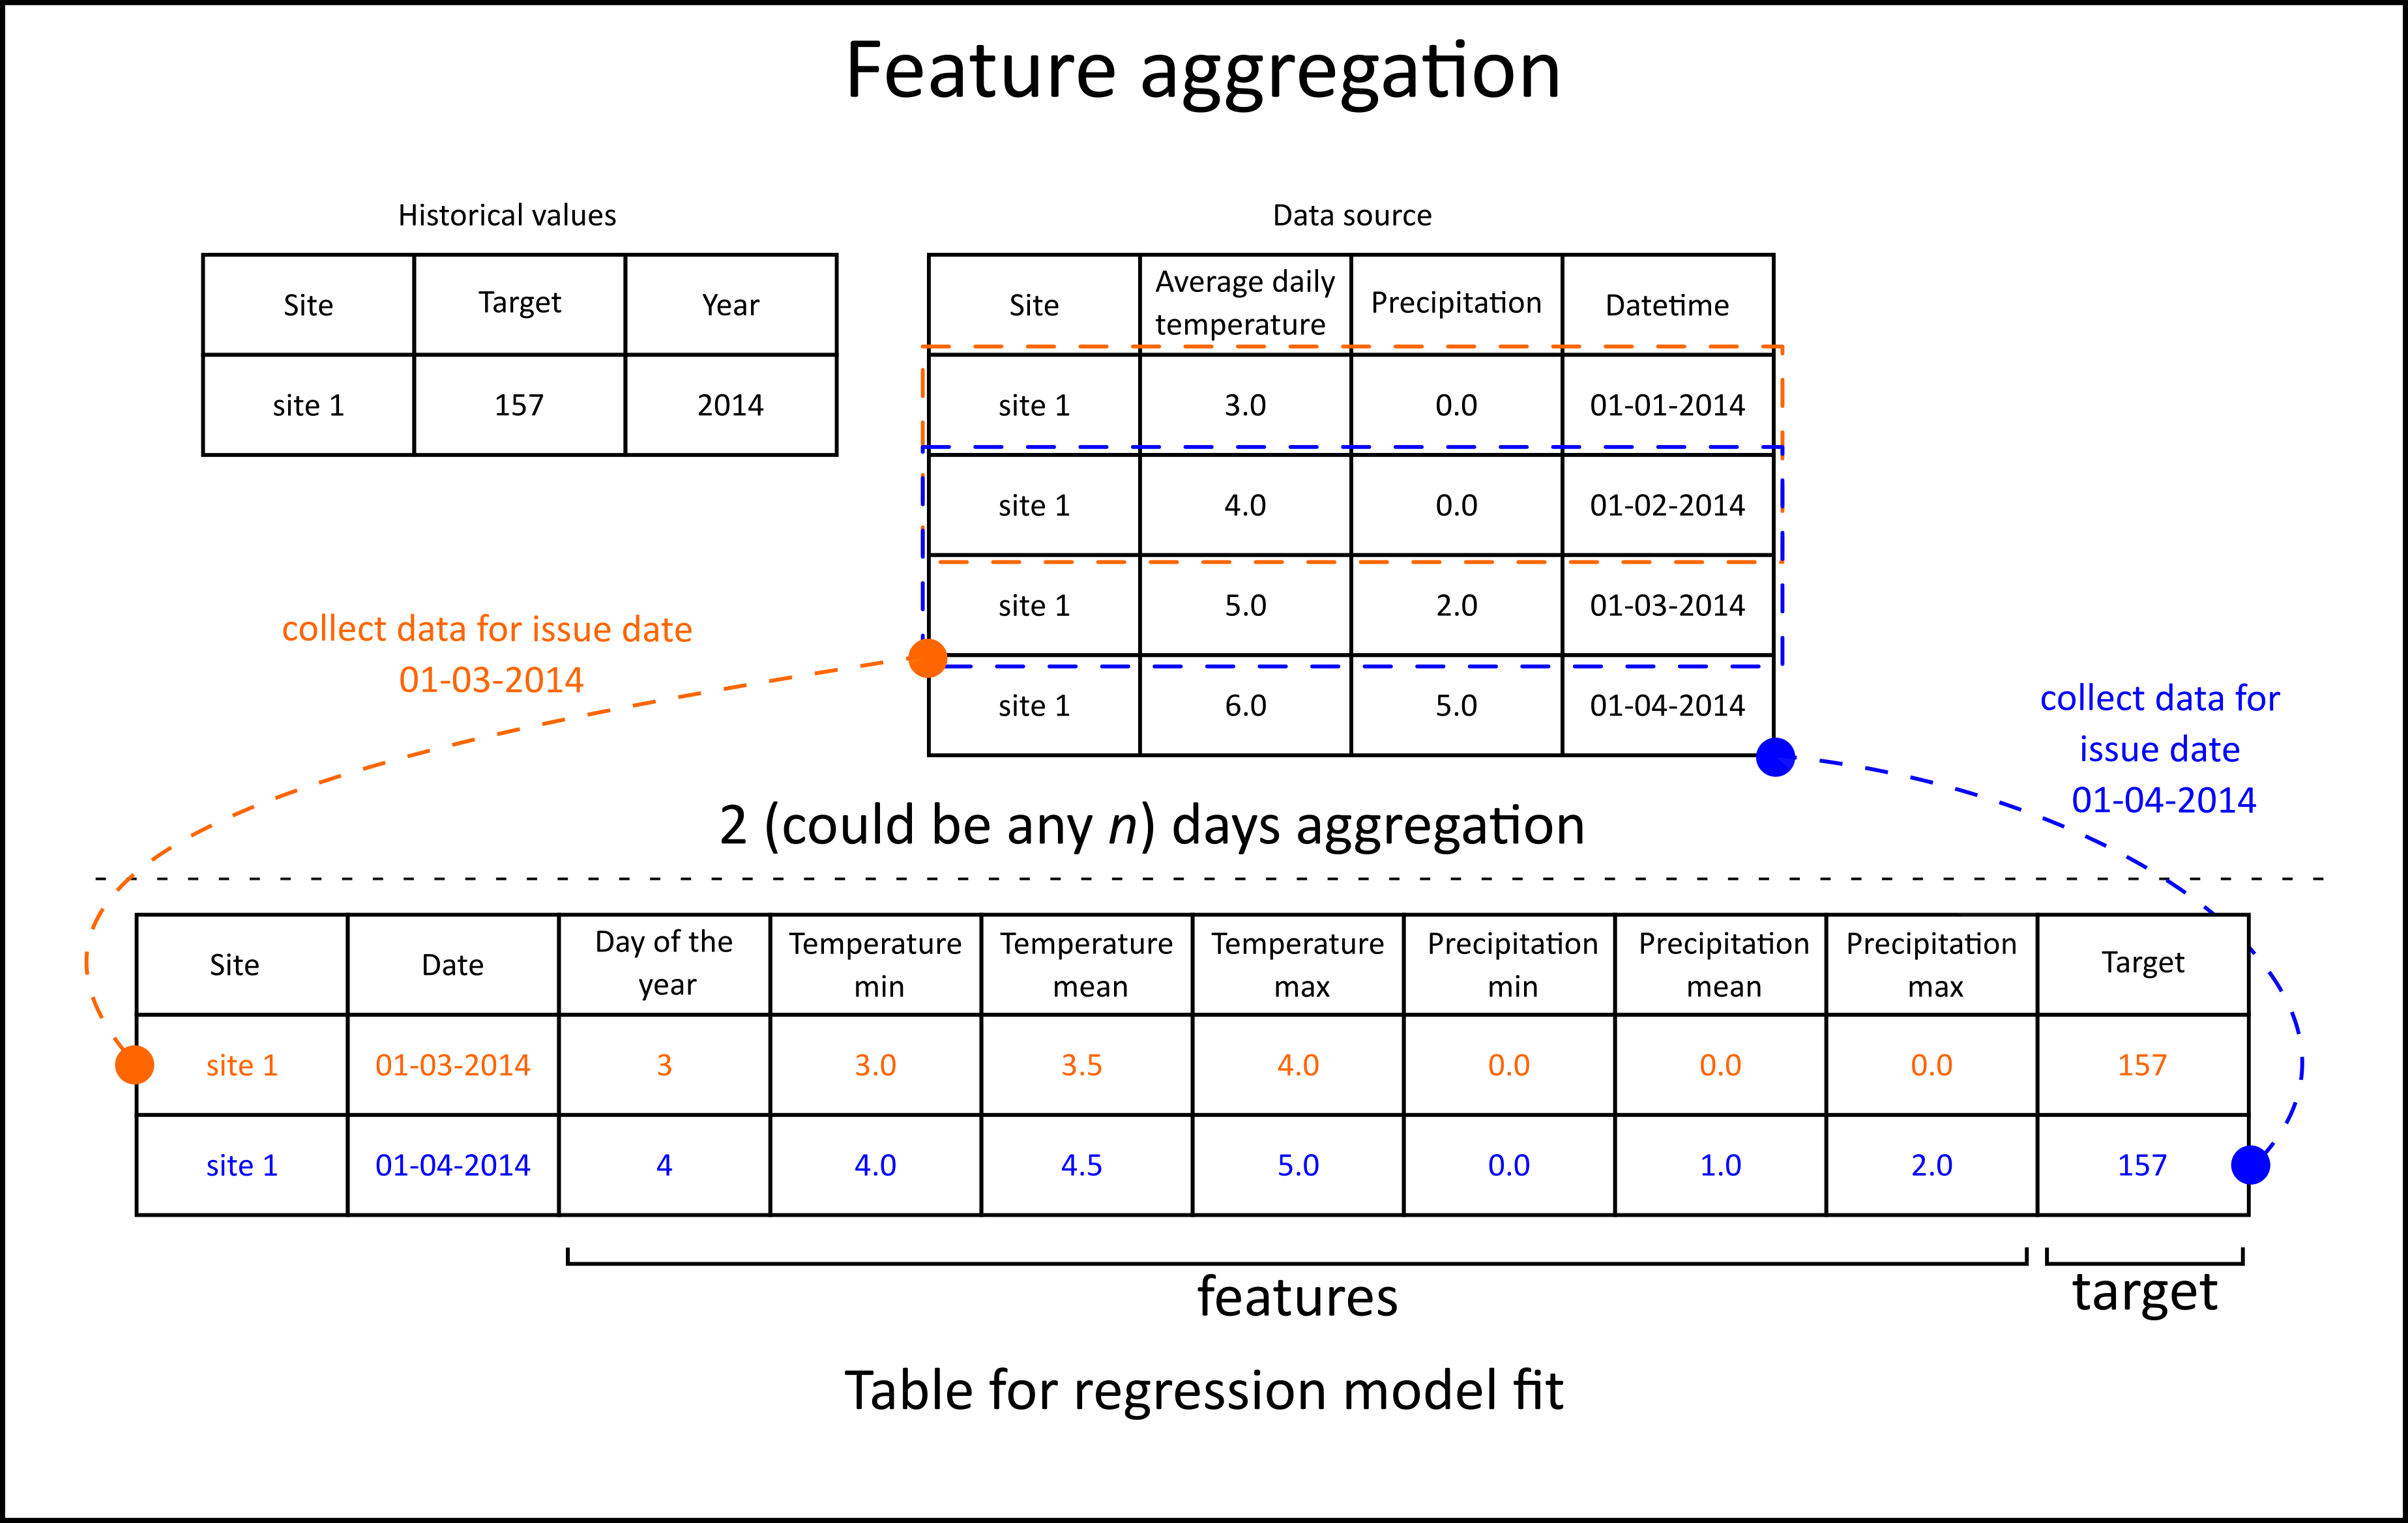
Figure 4. Example of generating features for a model using aggregation with defined lag of 2 days
Validation years: 2016, 2017, 2018, 2019, 2020, 2021, 2022, 2023
| Metric | Aggregation days 40 | Aggregation days 80 | Aggregation days 120 |
|---|---|---|---|
| MAE metric | 289.88 | 286.48 | 286.45 |
| MAPE metric | 43.60 | 43.72 | 43.56 |
| Symmetric MAPE metric | 38.61 | 38.77 | 38.75 |
| Quantile loss metric | 195.34 | 194.55 | 193.70 |
| Quantile loss metric (only for 0.5 quantile) | 289.88 | 286.48 | 286.45 |
This approach uses flow values aggregated over a specific period (for example 40, 80 or 120 days before the forecast issue date) to generate a forecast into the future.
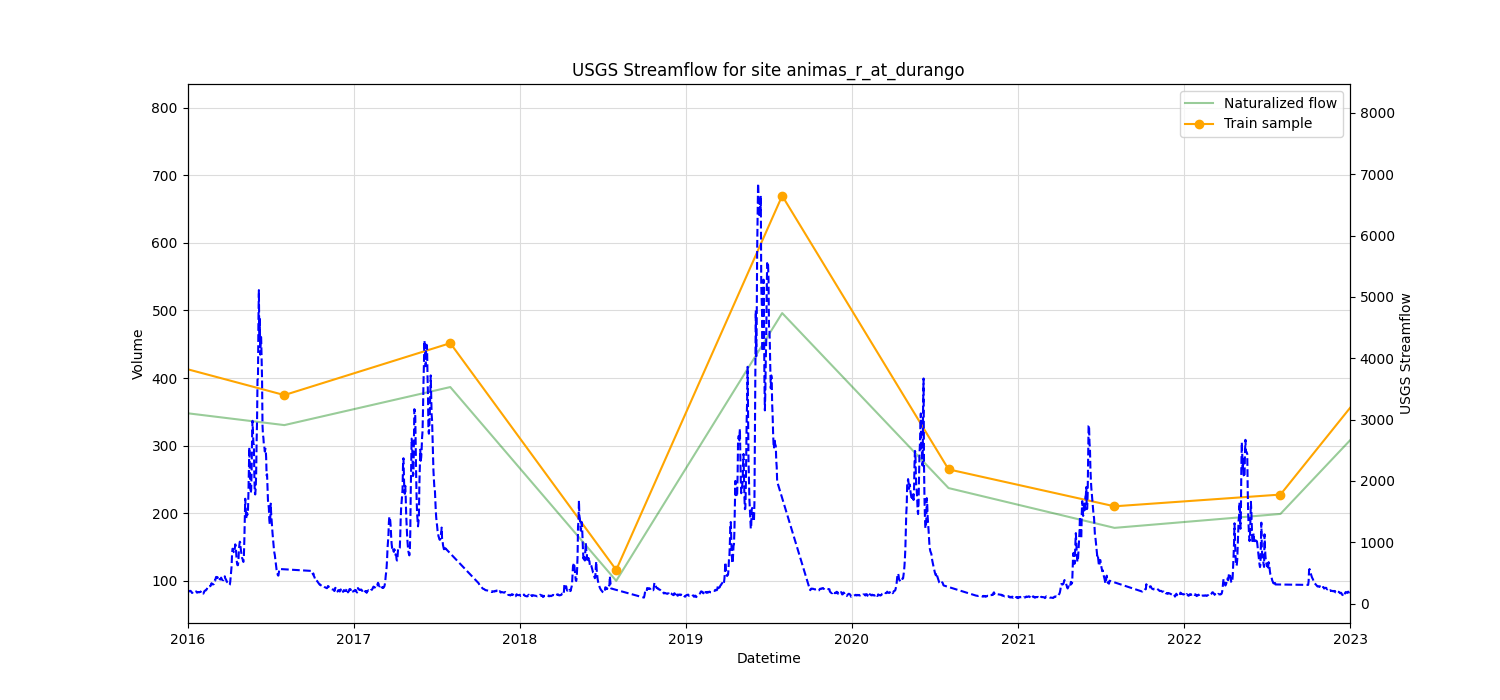
Figure 5. Representation of USGS streamflow data for animas_r_at_durango and actual values
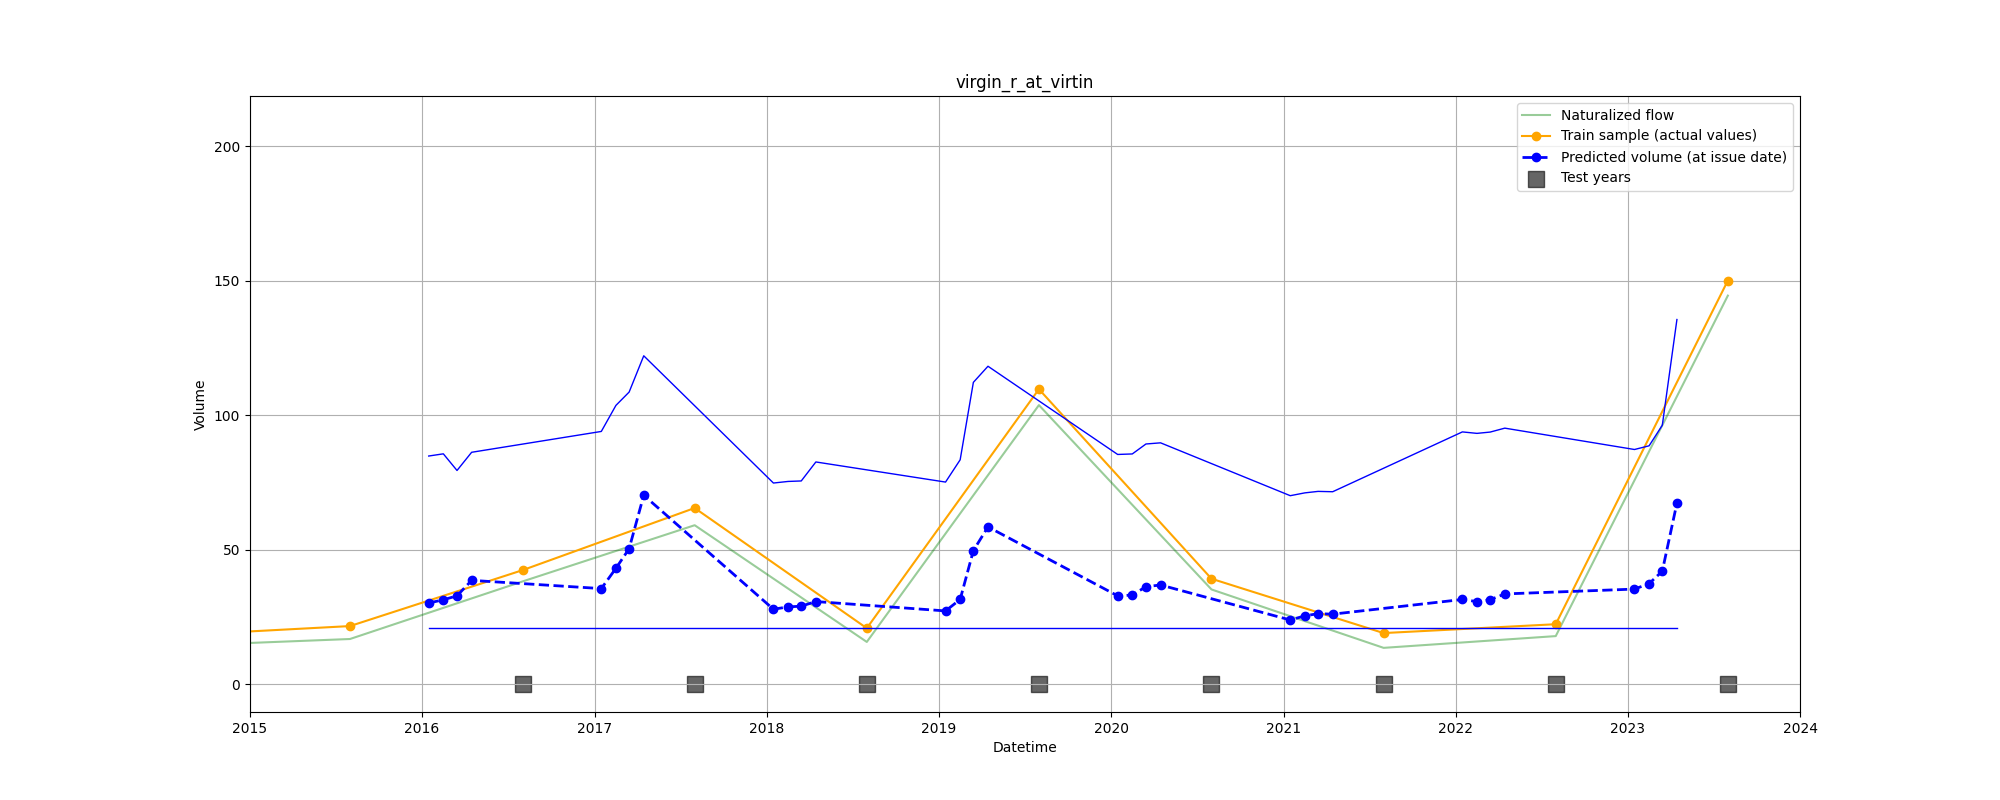
Figure 6. Forecasts for tests years for site virgin_r_at_virtin using USGS
streamflow based model (aggregation days: 120, kernel model - QuantileRegressor)
| Metric | Aggregation days 40 | Aggregation days 80 | Aggregation days 120 |
|---|---|---|---|
| MAE metric | 238.13 | 315.47 | 303.89 |
| MAPE metric | 40.60 | 51.64 | 49.86 |
| Symmetric MAPE metric | 33.19 | 36.84 | 36.14 |
| Quantile loss metric | 151.71 | 186.44 | 186.35 |
| Quantile loss metric (only for 0.5 quantile) | 238.13 | 315.47 | 303.89 |
Key features description:
PREC_DAILY- precipitationTAVG_DAILY- average daily temperatureTMAX_DAILY- max temperatureTMIN_DAILY- min temperatureWTEQ_DAILY- snow water equivalent
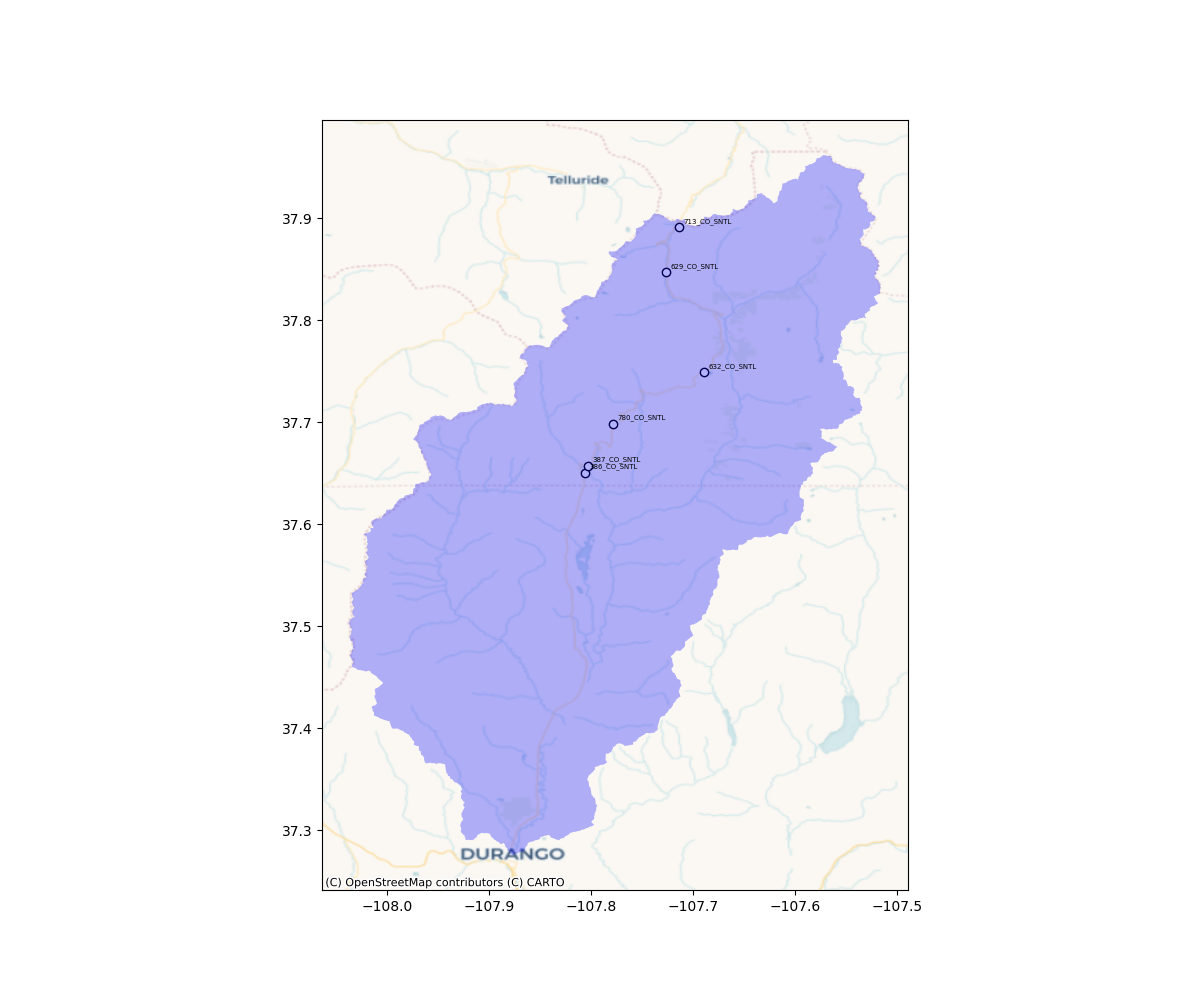
Figure 7. SNOTEL stations and basin of fontenelle_reservoir_inflow site
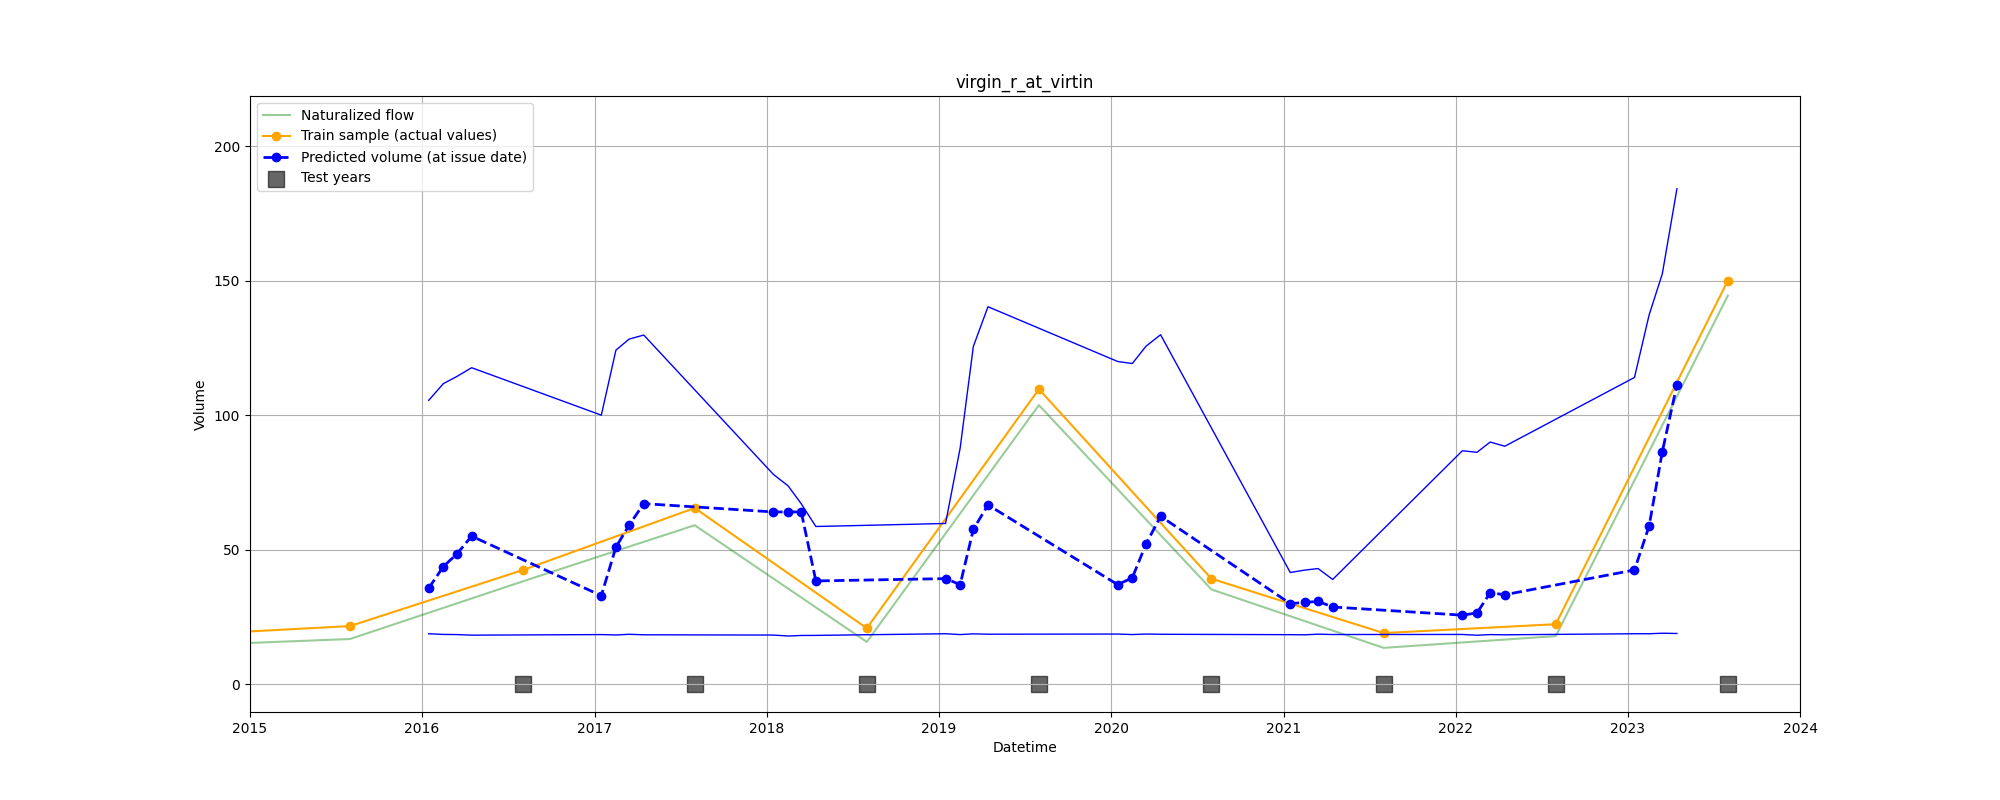
Figure 8. Forecasts for tests years for site virgin_r_at_virtin using SNOTEL stations
based model (aggregation days: 40, kernel model - QuantileRegressor)
Validation years: 2016, 2017, 2018, 2019, 2020, 2021, 2022, 2023
- MAE metric: 243.06
- MAPE metric: 39.85
- Symmetric MAPE metric: 33.93
- Quantile loss metric: 167.40
- Quantile loss metric (only for 0.5 quantile): 243.06
Combination of USGS streamflow -based model prediction and SNOTEL -based prediction
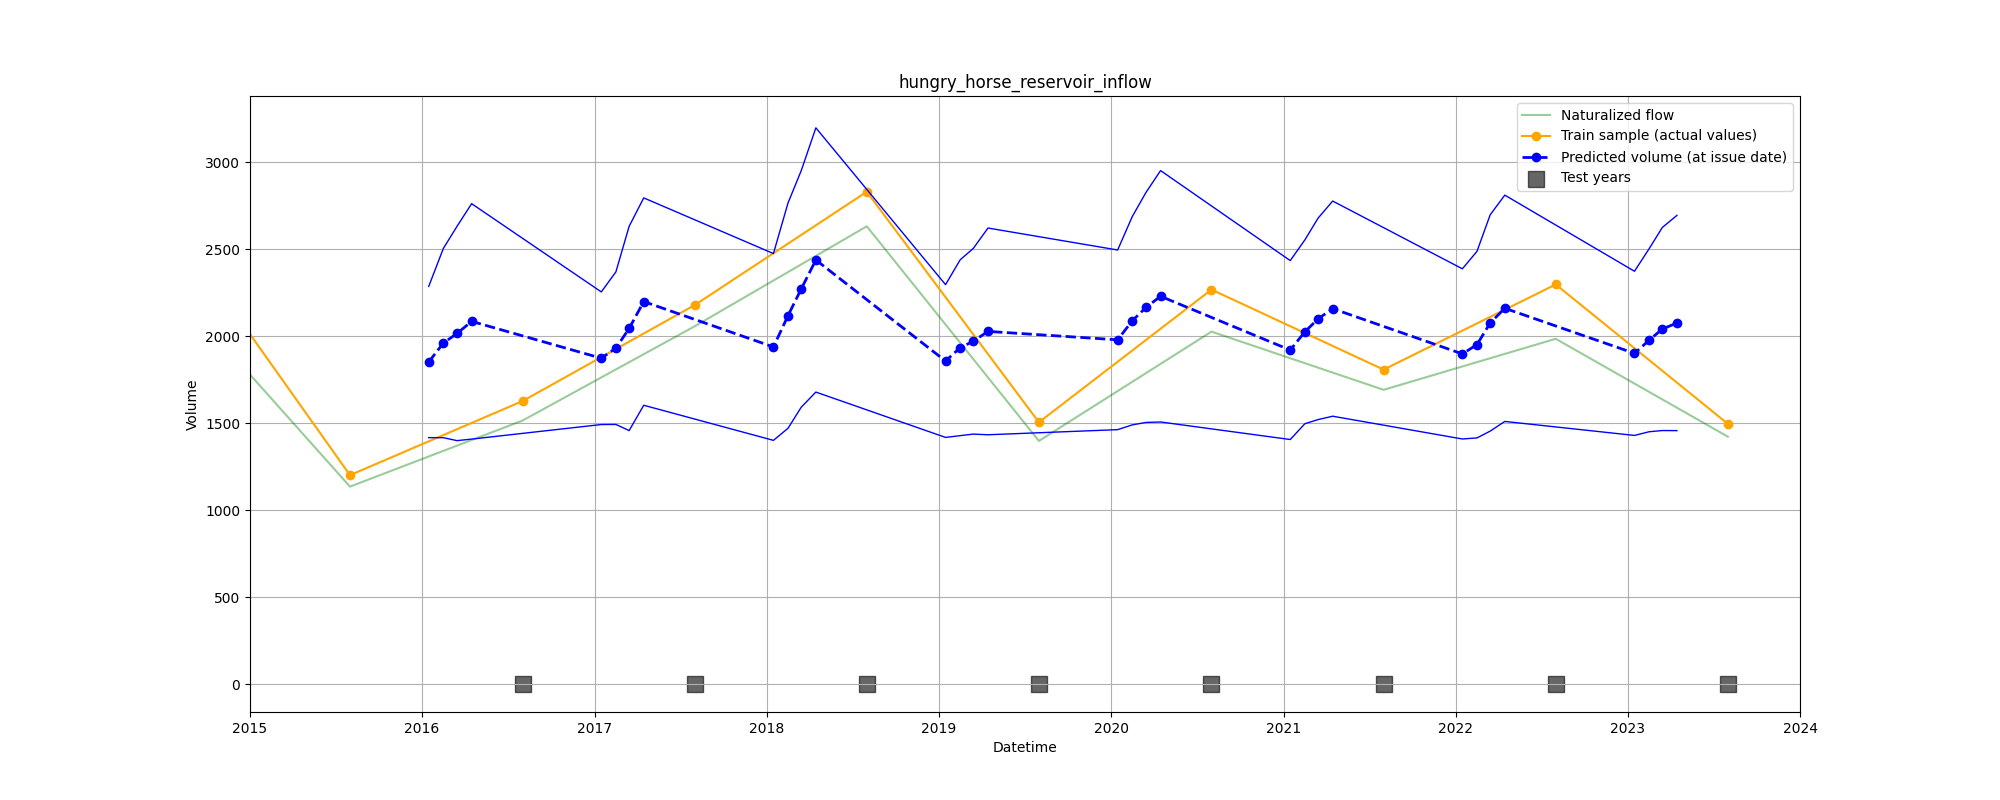
Figure 9. Forecasts for tests years for site hungry_horse_reservoir_inflow using simple ensemble
Validation years: 2016, 2017, 2018, 2019, 2020, 2021, 2022, 2023
- MAE metric: 240.41
- MAPE metric: 39.60
- Symmetric MAPE metric: 33.63
- Quantile loss metric: 165.20
- Quantile loss metric (only for 0.5 quantile): 240.41
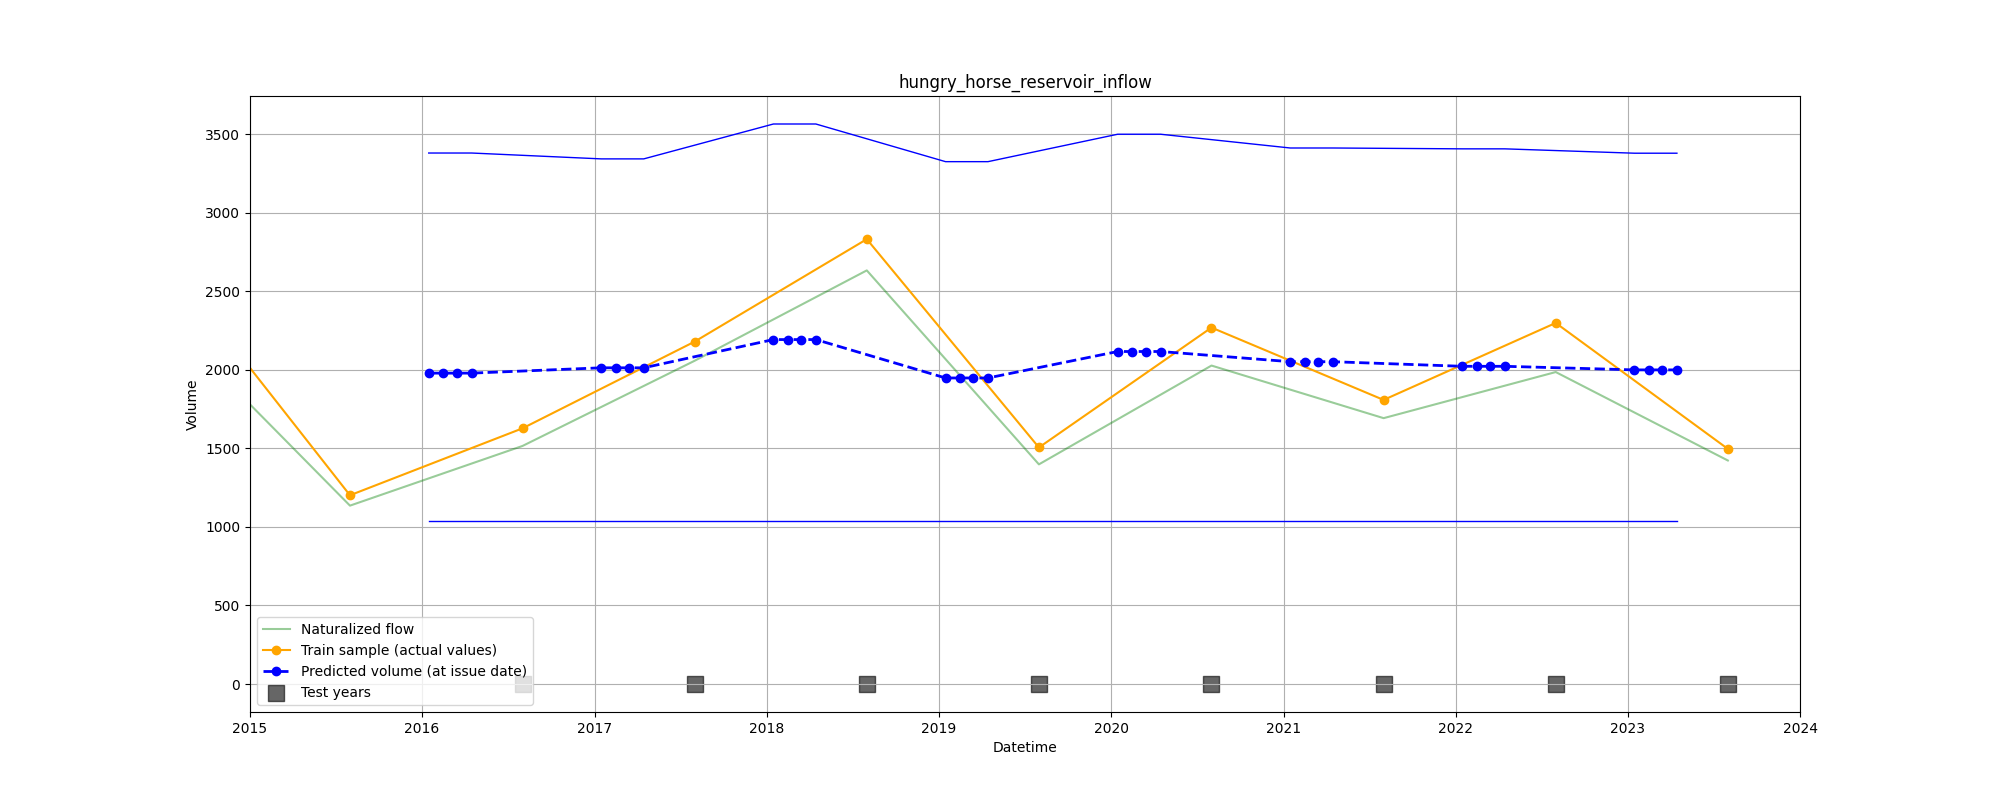
Figure 10. Forecasts for tests years for site hungry_horse_reservoir_inflow using simple ensemble with smoothing
| Metric | Aggregation days 40 | Aggregation days 80 | Aggregation days 120 |
|---|---|---|---|
| MAE metric | 220.73 | 216.84 | 215.10 |
| MAPE metric | 36.13 | 32.95 | 32.26 |
| Symmetric MAPE metric | 31.36 | 29.99 | 30.22 |
| Quantile loss metric | 146.95 | 140.51 | 137.92 |
| Quantile loss metric (only for 0.5 quantile) | 220.73 | 216.84 | 215.10 |
Modeled snow layer thickness, total of snow layers
Data from SNODAS files:
- Non-snow accumulation, 24-hour total
- Snow accumulation, 24-hour total
- Modeled snow layer thickness, total of snow layers
- Modeled average temperature, SWE-weighted average of snow layers, 24-hour average
- Modeled blowing snow sublimation, 24-hour total
- Modeled melt, bottom of snow layers, 24-hour total
- Modeled snowpack sublimation, 24-hour total
Data preprocessing for SNODAS is divided into two steps:
- Archive unpacking: Archives with
.datand.txtfiles are transformed into geotiff files - Data extraction: For each site id and for each datetime stamp, information is extracted and written as a
.csvfile
Animation 1. Snow accumulation per days for site hungry_horse_reservoir_inflow. Units: Kilograms per square meter / 10
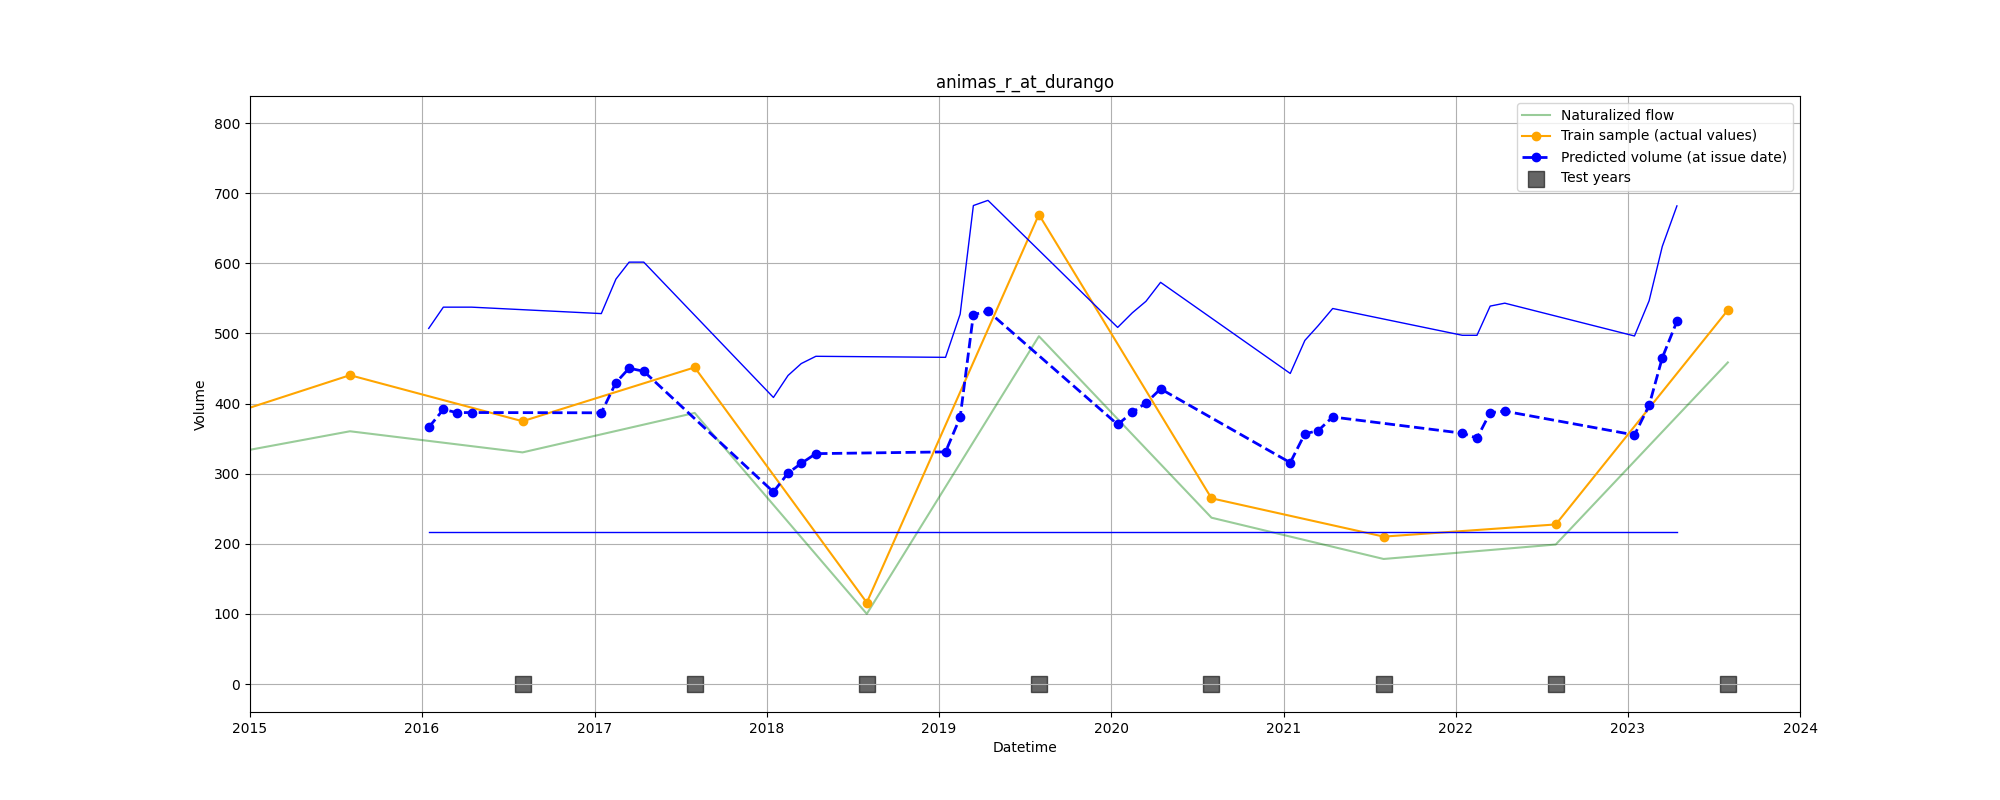
Figure 11. Forecasts for tests years for site animas_r_at_durango using SNODAS-based model (aggregation days: 120, kernel model - QuantileRegressor)
Important! This model submitted to the Hindcast Stage
Model assimilates PDSI, SNOTEL and Climate indices data
Validation years: 2016, 2017, 2018, 2019, 2020, 2021, 2022, 2023
- MAE metric: 214.44
- MAPE metric: 31.16
- Symmetric MAPE metric: 30.54
- Quantile loss metric: 137.65
- Quantile loss metric (only for 0.5 quantile): 214.44
Code for the model in the folder 9_common_ver_1.
Validation years: 2016, 2017, 2018, 2019, 2020, 2021, 2022, 2023
- MAE metric: 197.09
- MAPE metric: 30.71
- Symmetric MAPE metric: 29.03
- Quantile loss metric: 132.90
- Quantile loss metric (only for 0.5 quantile): 197.09
Since SNODAS and SNOTEL data are compatible in the terms of feature engineering is was decided to use only SNOTEL data because it is much easier to process (Figure 12)
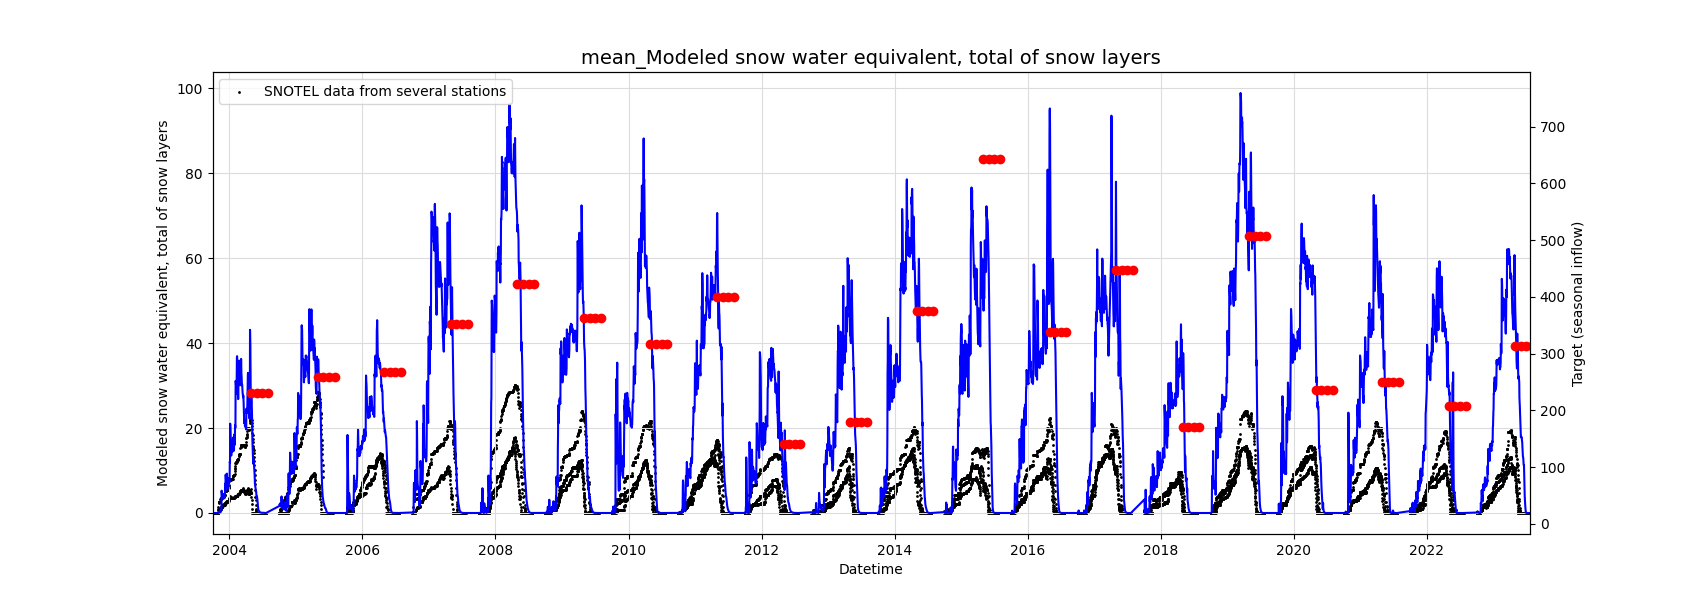
Figure 12. SNODAS and SNOTEL data comparison vs target for site pueblo_reservoir_inflow
The graph shows that snowpack does not completely determine target. Therefore, it was decided to include an additional parameter, PDSI, in the model to account for soil characteristics.
Common model. Final model metrics.
- MAE metric: 177.17
- MAPE metric: 27.97
- Symmetric MAPE metric: 26.30
- Quantile loss metric: 120.78
- Quantile loss metric (only for 0.5 quantile): 177.17
To find the optimal configuration of hyperparameters (days SNOTEL short, days SNOTEL long, days PDSI), a brute force algorithm
was applied. The figures below show the results of
calculations for two loss functions: Quantile loss and MAE (Figure 13 and Figure 14)
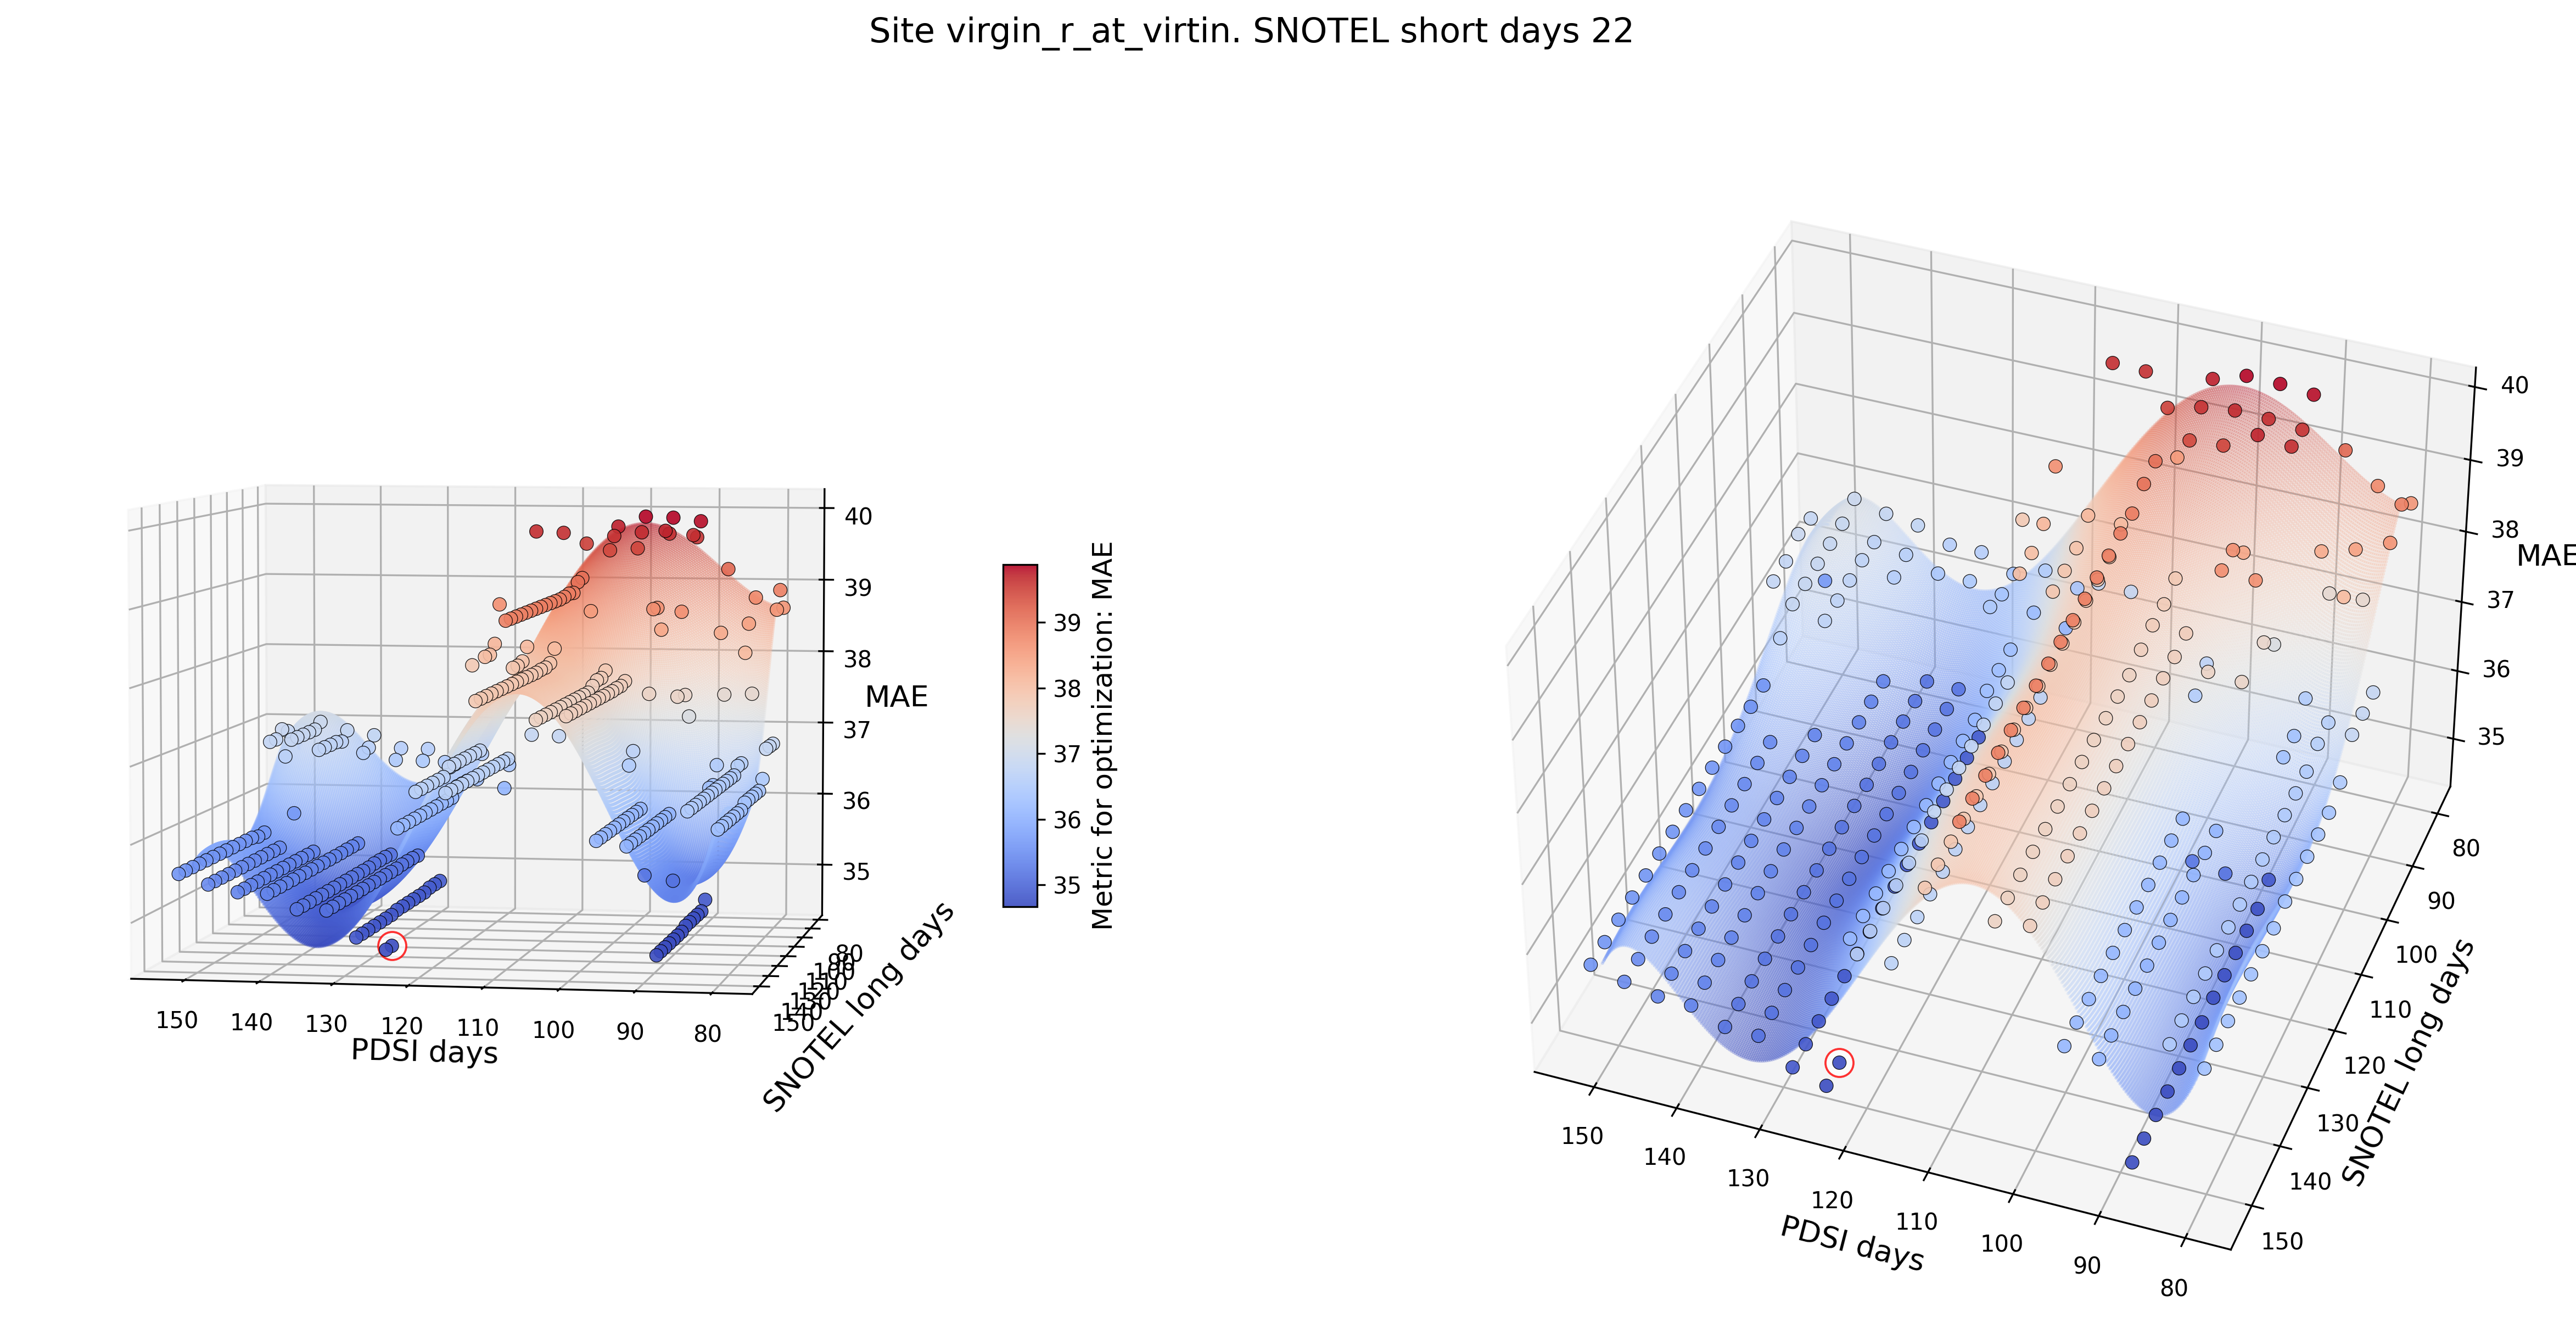
Figure 13. Exploration of MAE landscape for common model for virgin_r_at_virtin site with constant days SNOTEL short=22 parameter.
Optimal configuration for this site: days SNOTEL short=22, days SNOTEL long=148, days PDSI=124)
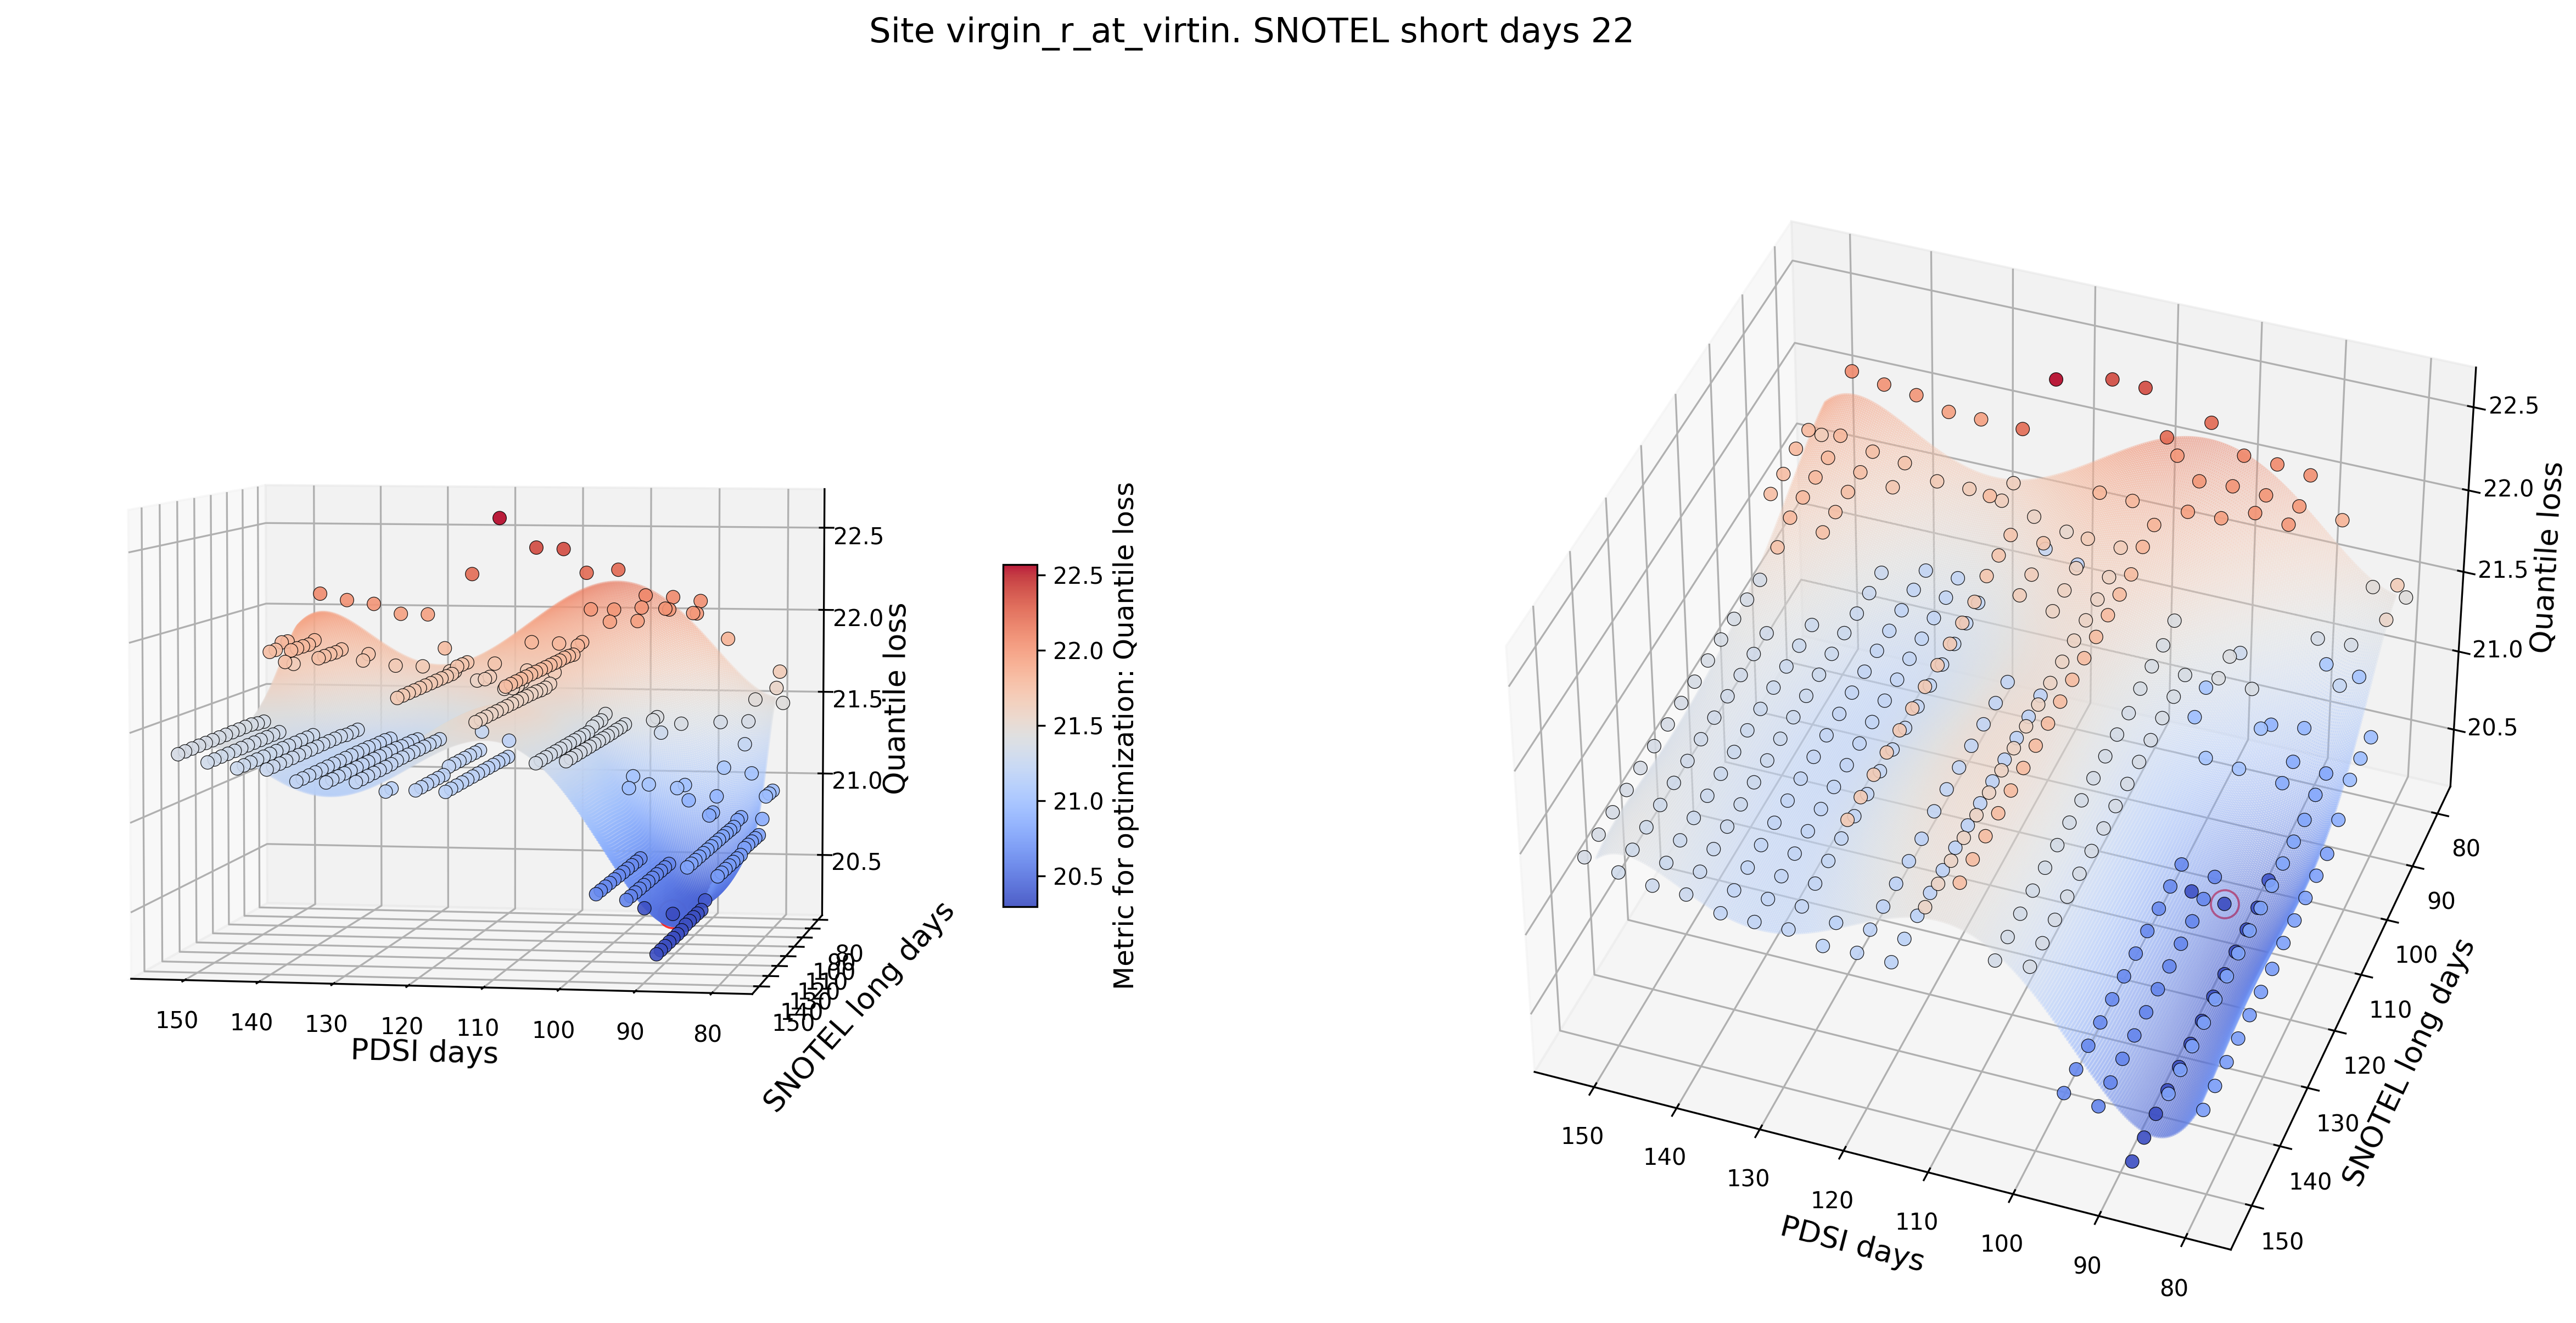
Figure 14. Exploration of Quantile loss landscape for common model for virgin_r_at_virtin site with constant days SNOTEL short=22 parameter.
Optimal configuration for this site: days SNOTEL short=22, days SNOTEL long=108, days PDSI=92)
The results of applying all the approaches are shown below
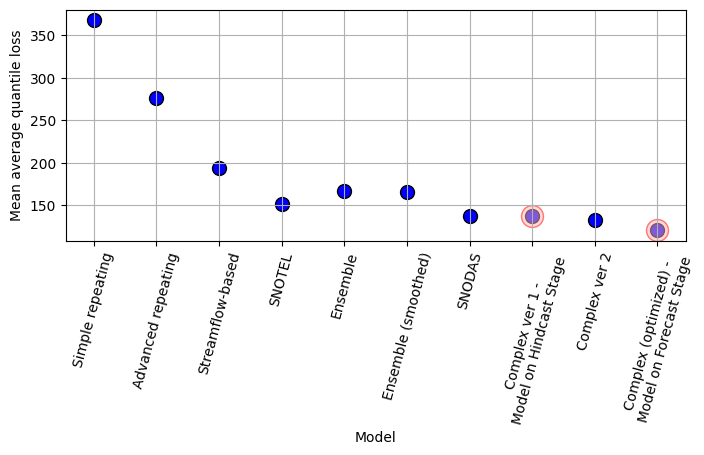
Figure 15. Average mean Quantile loss for implemented models on validation sample
In the folder with cross validation 11_cross_validation_final_model there are scripts which check how the model perform during cross validation.
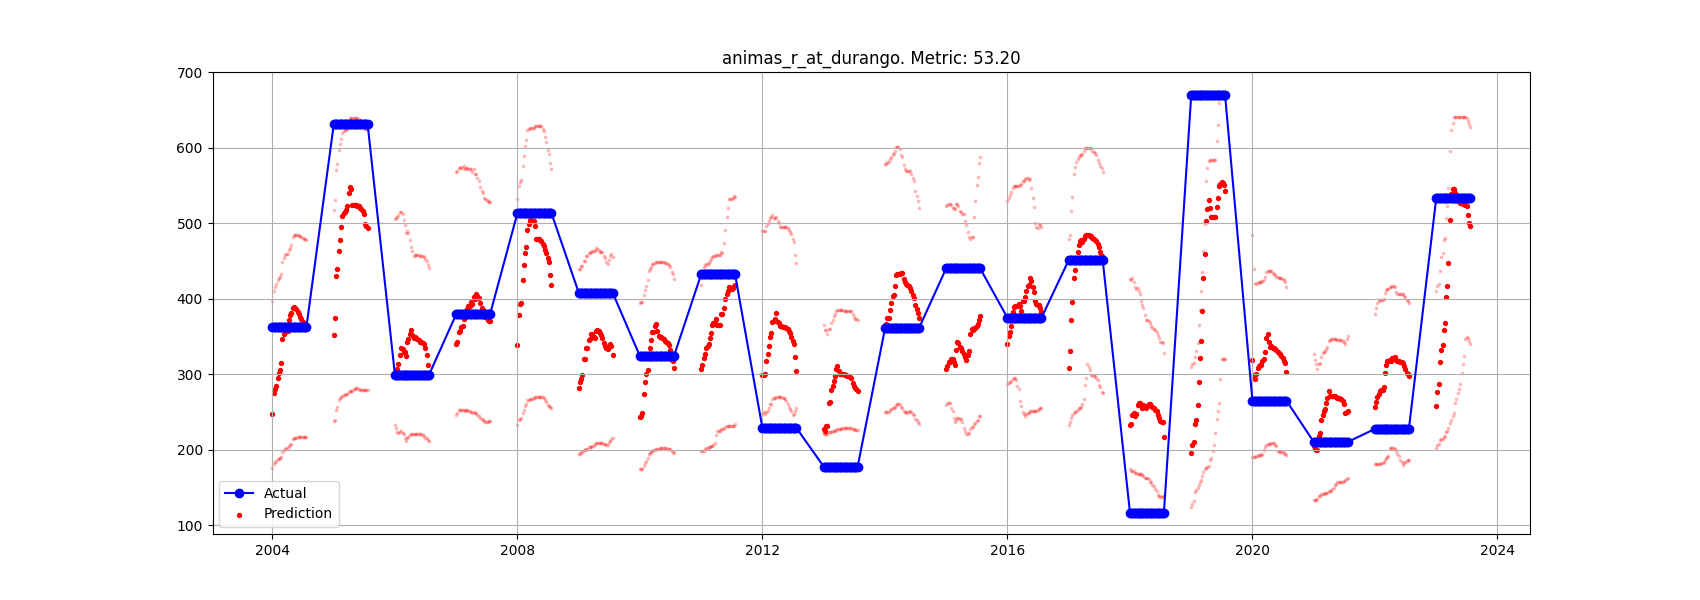
Figure 16. Comparison of the predicted and actual values obtained during model cross validation
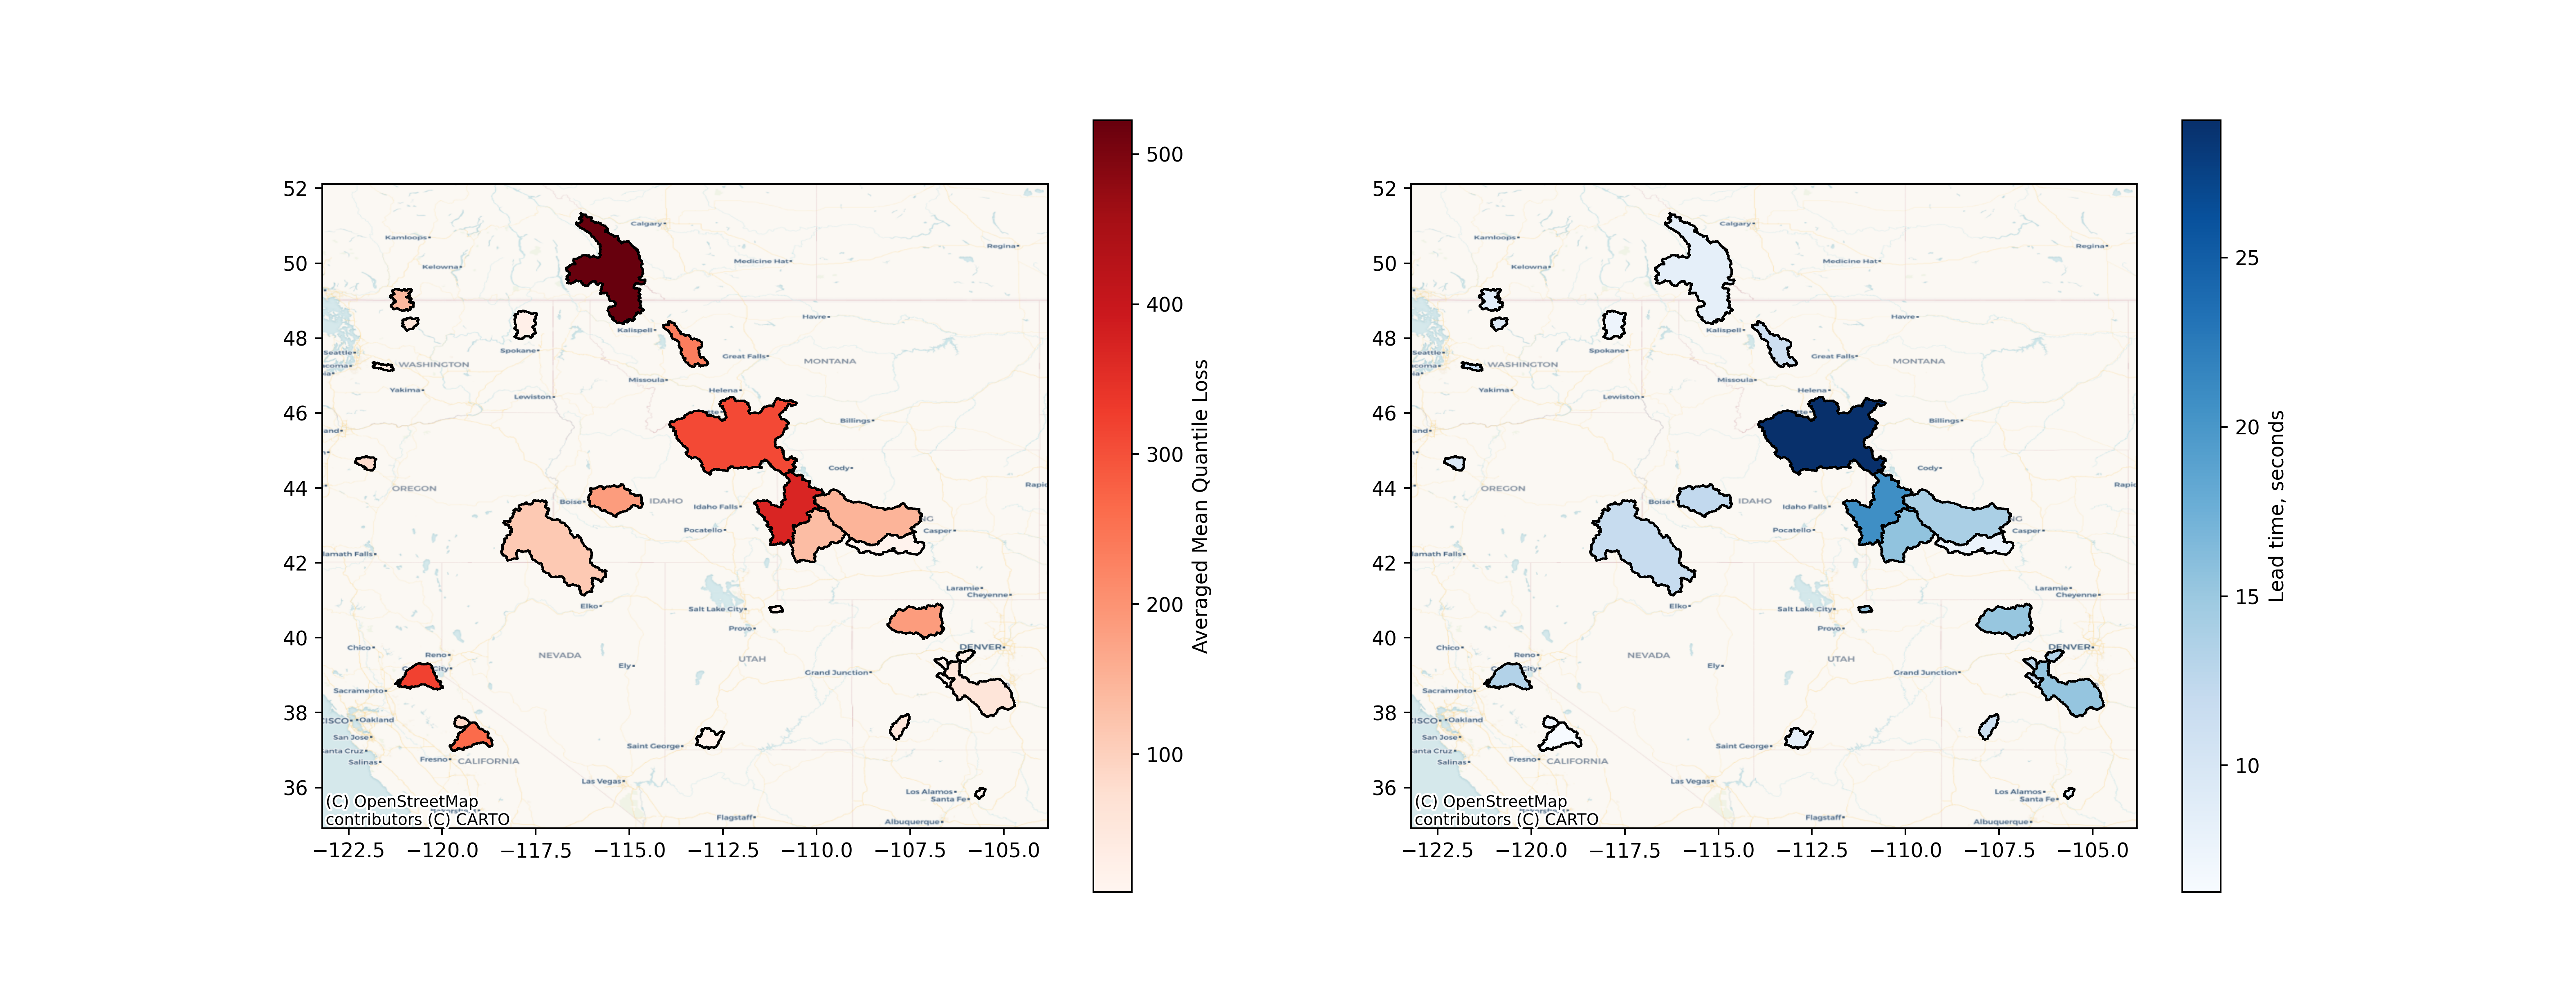
Figure 17. Cross validation results map with Averaged Mean Quantile Loss (left) and Lead time, seconds (right) per site