Google Earth Engine is a cloud-based geospatial analysis platform that enables users to visualize and analyze satellite images of our planet. Scientists and non-profits use Earth Engine for remote sensing research, predicting disease outbreaks, natural resource management, and more. Google Earth Engine combines a multi-petabyte catalog of satellite imagery and geospatial datasets with planetary-scale analysis capabilities. Scientists, researchers, and developers use Earth Engine to detect changes, map trends, and quantify differences on the Earth's surface.
It features Ready-To-Use Datasets: The public data archive includes more than thirty years of historical imagery and scientific datasets, updated and expanded daily. It contains over forty petabytes of geospatial data instantly available for analysis.
Python and JavaScript client libraries for calling the Google Earth Engine API.
Important Note: Access to Google Earth Engine is currently only available to registered users. The API is in active development, and users should expect the API to change. When (not if) API changes occur, applications that use the API will likely need to be updated.
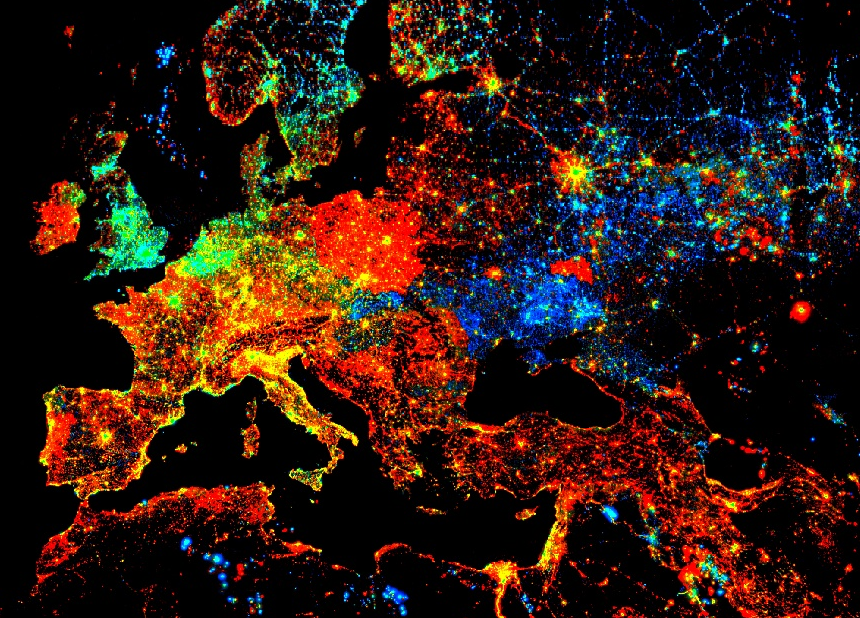
Here's an example screenshot and the corresponding Code Editor JavaScript code:
// Compute the trend of night-time lights.

// Adds a band containing image date as years since 1991.
function createTimeBand(img) {
  var year = ee.Date(img.get('system:time_start')).get('year').subtract(1991);
  return ee.Image(year).byte().addBands(img);
}

// Map the time band creation helper over the night-time lights collection.
// https://developers.google.com/earth-engine/datasets/catalog/NOAA_DMSP-OLS_NIGHTTIME_LIGHTS
var collection = ee.ImageCollection('NOAA/DMSP-OLS/NIGHTTIME_LIGHTS')
    .select('stable_lights')
    .map(createTimeBand);

// Compute a linear fit over the series of values at each pixel, visualizing
// the y-intercept in green, and positive/negative slopes as red/blue.
Map.addLayer(
    collection.reduce(ee.Reducer.linearFit()),
    {min: 0, max: [0.18, 20, -0.18], bands: ['scale', 'offset', 'scale']},
    'stable lights trend');