Home
Analyze open medical data sets to gain insights
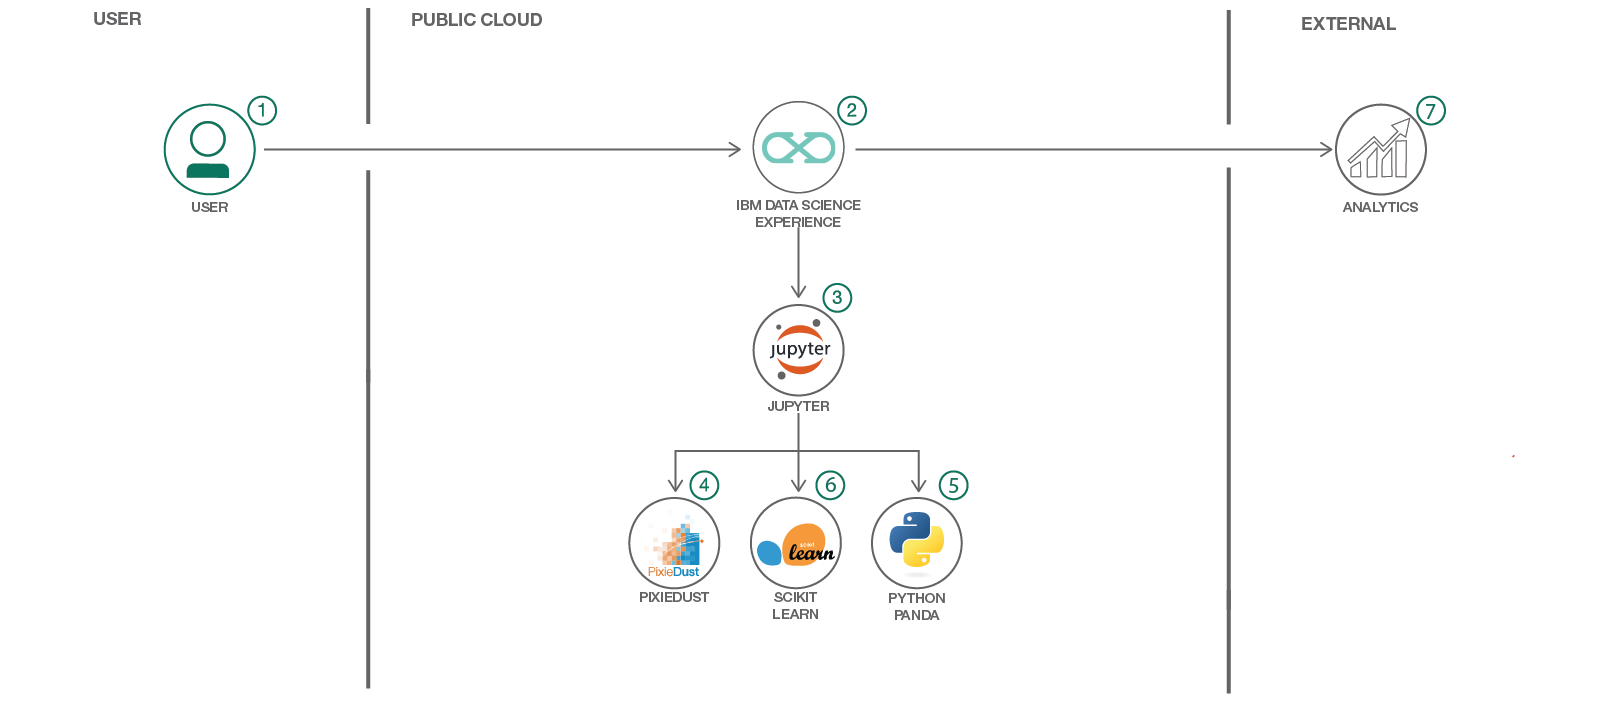
Use Machine Learning to Predict U.S. Opioid Prescribers with DSX and Scikit Learn
Cognitive & Data Analytics
This pattern dives into a dataset which looks at opioid overdose deaths by state as well as different, unique physicians, their credentials, specialties, whether or not they've prescribed opioids in 2014 as well as the specific prescriptions they've prescribed. Follow along to see how to explore the data in a DSX notebook, visualize a few initial findings using Pixie Dust, and then use scikit learn to use machine learning to train several models and evaluate which have the most accurate predictions of opioid prescriptions.
A pattern focusing on how to use scikit learn and python (in DSX) to predict opioid prescribers based off of a 2014 kaggle dataset. This code pattern was created for data scientists and data lovers who are interested in social justice issues, health issues and/or those who are new to DSX and machine learning. This will guide the user through exploring data, cleaning data, training models and evaluating them.
The user will learn:
- How to use DSX.
- How to explore multiple dataframes.
- How to visualize explorations.
- How to clean the data using python and pandas.
- How to build several machine learning models to predict a target variable.
- How to evaluate the models' performance.
- Log into IBM's DSX service.
- Upload the data as a data asset into DSX.
- Start a notebook in DSX and input the data asset previously created.
- Explore the data with pandas
- Create data visualizations with Pixie Dust.
- Train machine learning models with scikit learn.
- Evaluate their prediction performance.
- IBM Data Science Experience: Analyze data using RStudio, Jupyter, and Python in a configured, collaborative environment that includes IBM value-adds, such as managed Spark.
- Watson Analytics: Watson Analytics guides analysis with automated data visualization and discovery so you can uncover insights on your own.
- Data Science: Systems and scientific methods to analyze structured and unstructured data in order to extract knowledge and insights.
- Python: Python is a programming language that lets you work more quickly and integrate your systems more effectively.
- pandas: A Python library providing high-performance, easy-to-use data structures.
- DSX: https://datascience.ibm.com/docs/content/analyze-data/creating-notebooks.html.
- Pandas:http://pandas.pydata.org/
- Pixie Dust: https://ibm-watson-data-lab.github.io/pixiedust/displayapi.html#introduction
- Data Set used: https://www.kaggle.com/apryor6/us-opiate-prescriptions/data
- Scikit Learn: http://scikit-learn.org/stable/