Home
In addition to the text based documentation here, additional information in other formats (video, slides) is available at https://umgear.org/manual.html.
The gene Expression Analysis Resource (gEAR) is a website for visualization and analysis of multiomic data both in public and private domains. The gEAR enables upload, visualization and analysis of bulk RNA sequencing, scRNA-seq data, and epigenetic data.
gEAR is under active development and we are continuously adding new features. If you need assistance with any issues or have suggestions, please contact our user helpdesk https://umgear.org/contact.html.
The gEAR is maintained by a team at the University of Maryland School of Medicine, and led by Dr. Ronna Hertzano and Joshua Orvis. The gEAR is supported by the NIDCD/NIH R01DC013817, R01DC019370, NIMH/NIH R24MH114815 and the Hearing Health Foundation (Hearing Restoration Project).
To create an account, click the create account button at the top right of the homepage or follow the link here (Create gEAR Account). On this page you will enter some basic information about you and your email address (which can be used to recover your password). After creating an account, you will have access to all the tools available on the gEAR. To see your user information, click on your username in the top right.
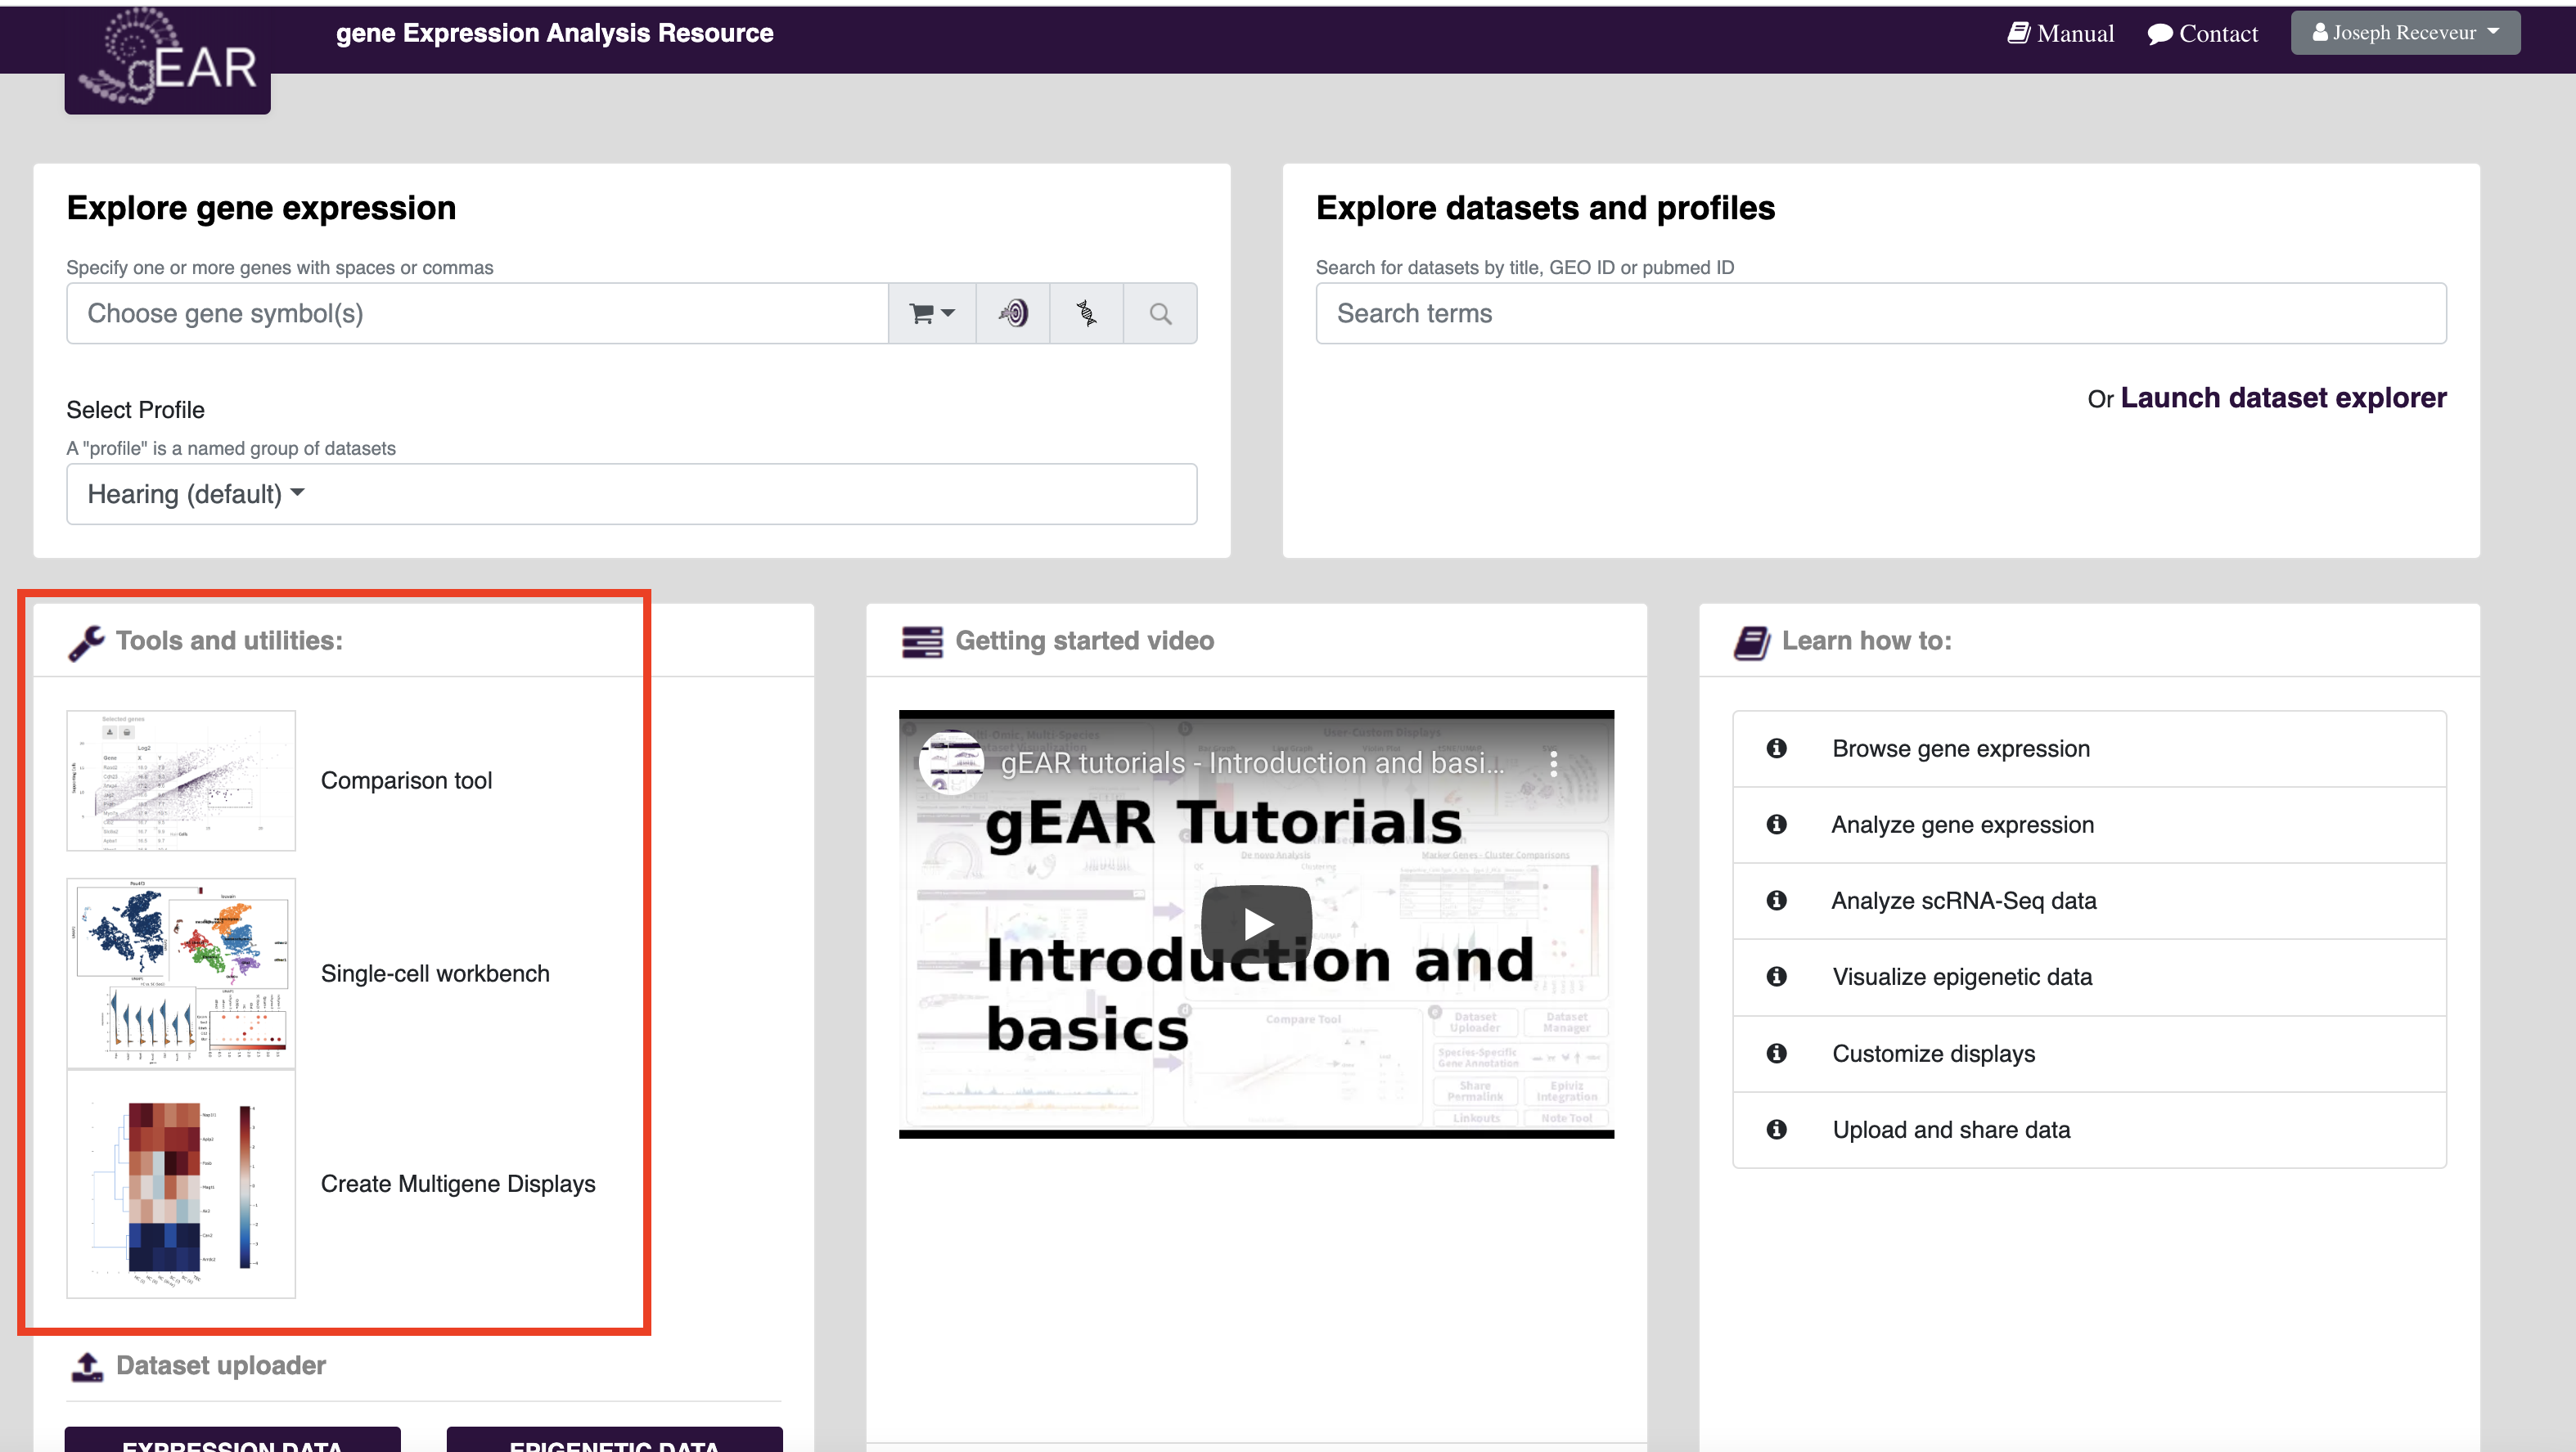
The gEAR homepage (umgear.org) contains links to the most commonly used tools and utilities on the gEAR. At any time on the site, you can return to the homepage by clicking the gEAR icon in the top left corner.
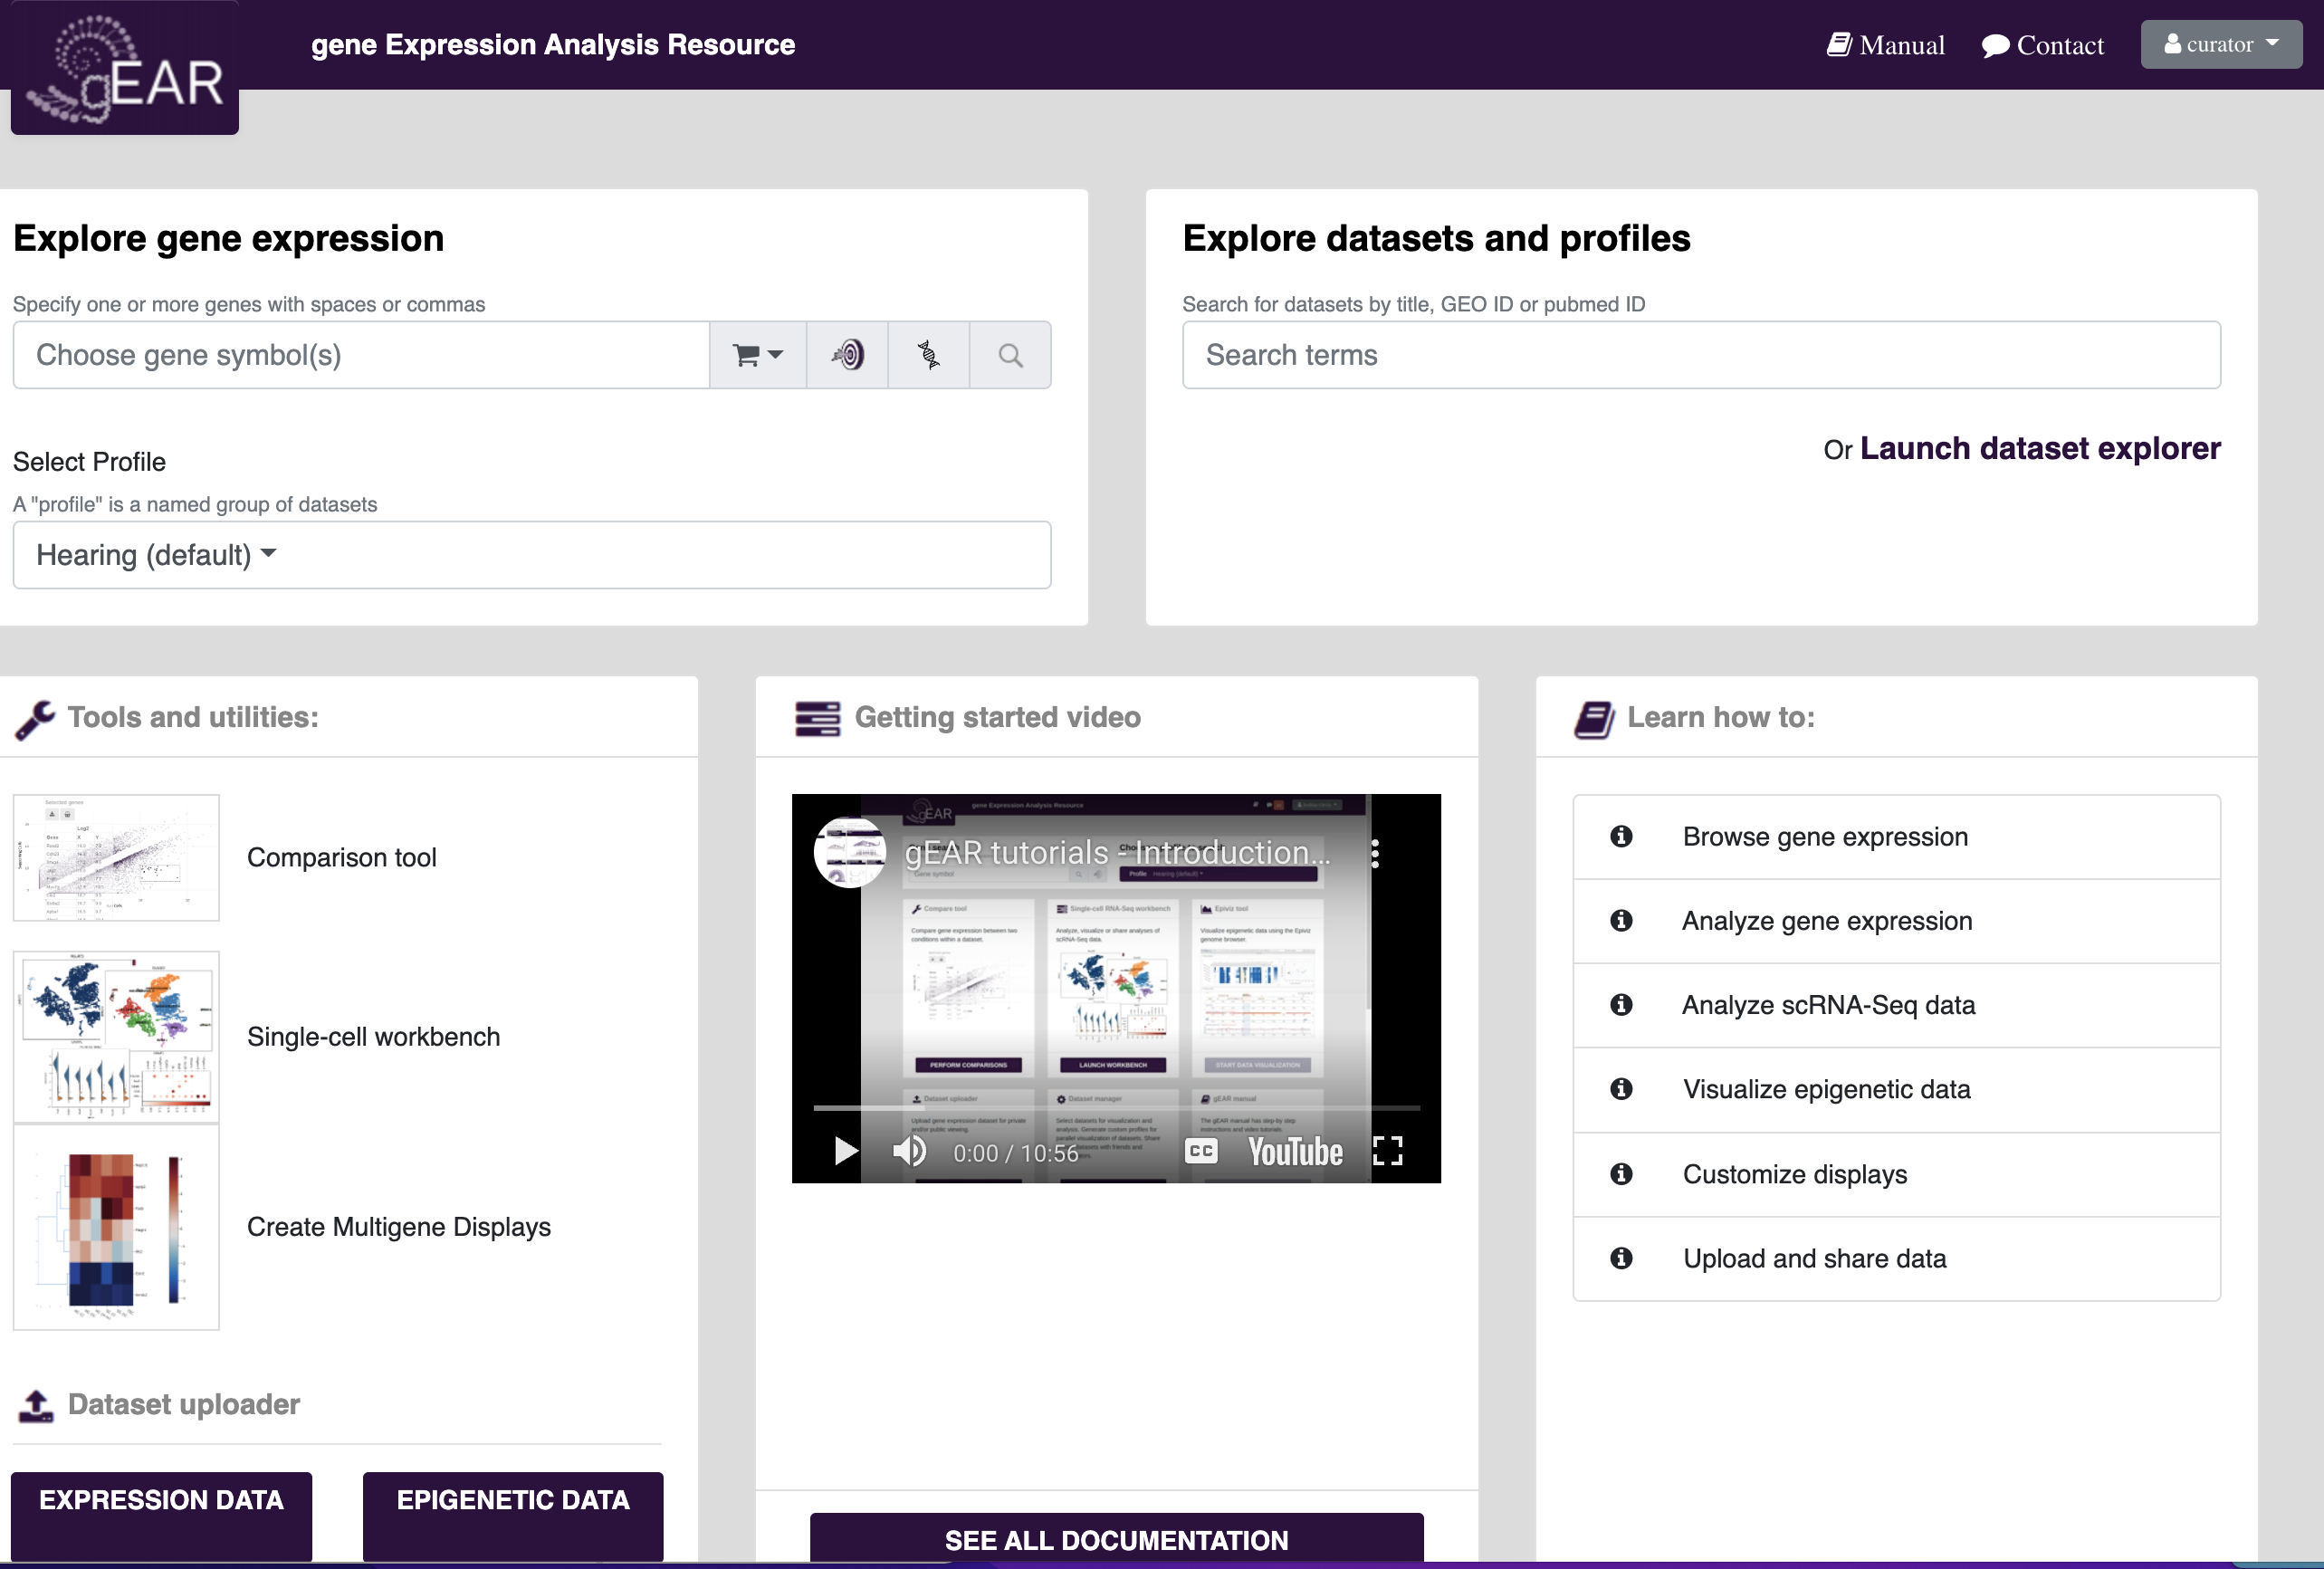
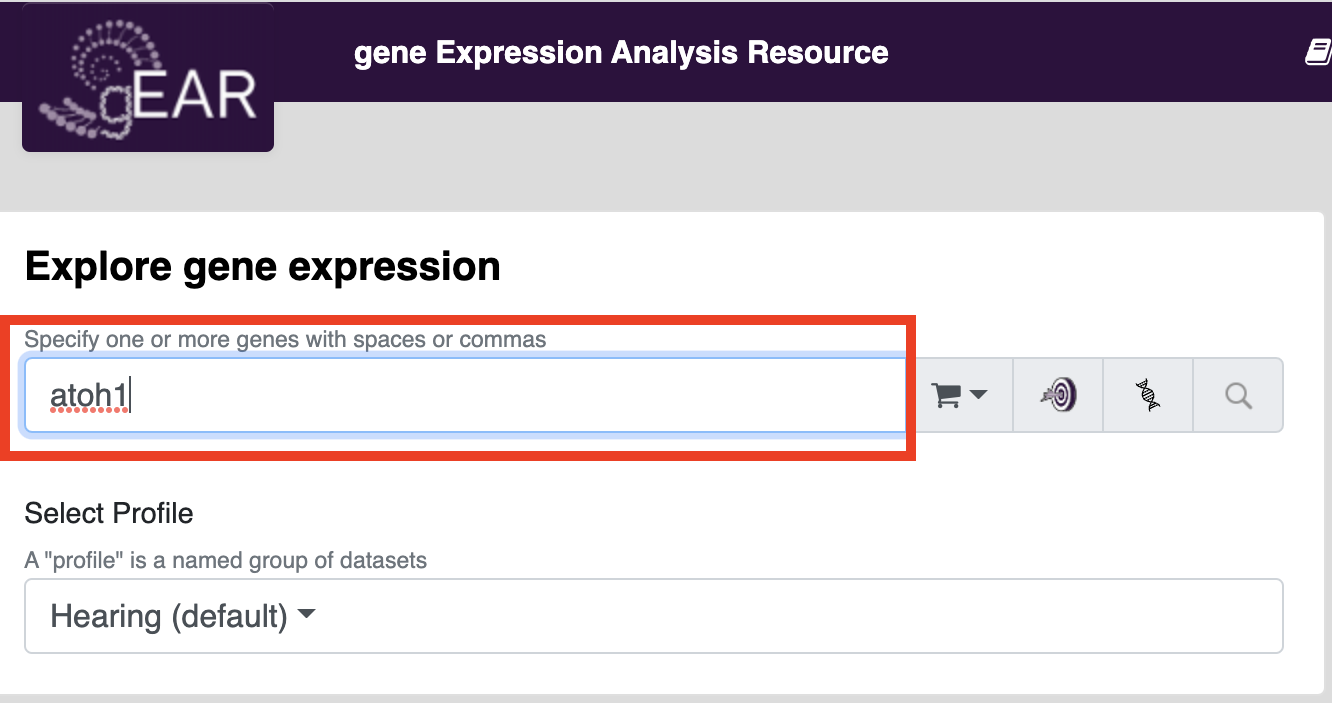
Searching for genes of interest in public datasets is one of the most common uses of the gEAR platform. A good place to start searching is on the homepage. To search for your gene of interest, put your gene name in the gene expression search bar (see below) and press search.
For more information about searching for genes of interest and other basic functions in gEAR see:
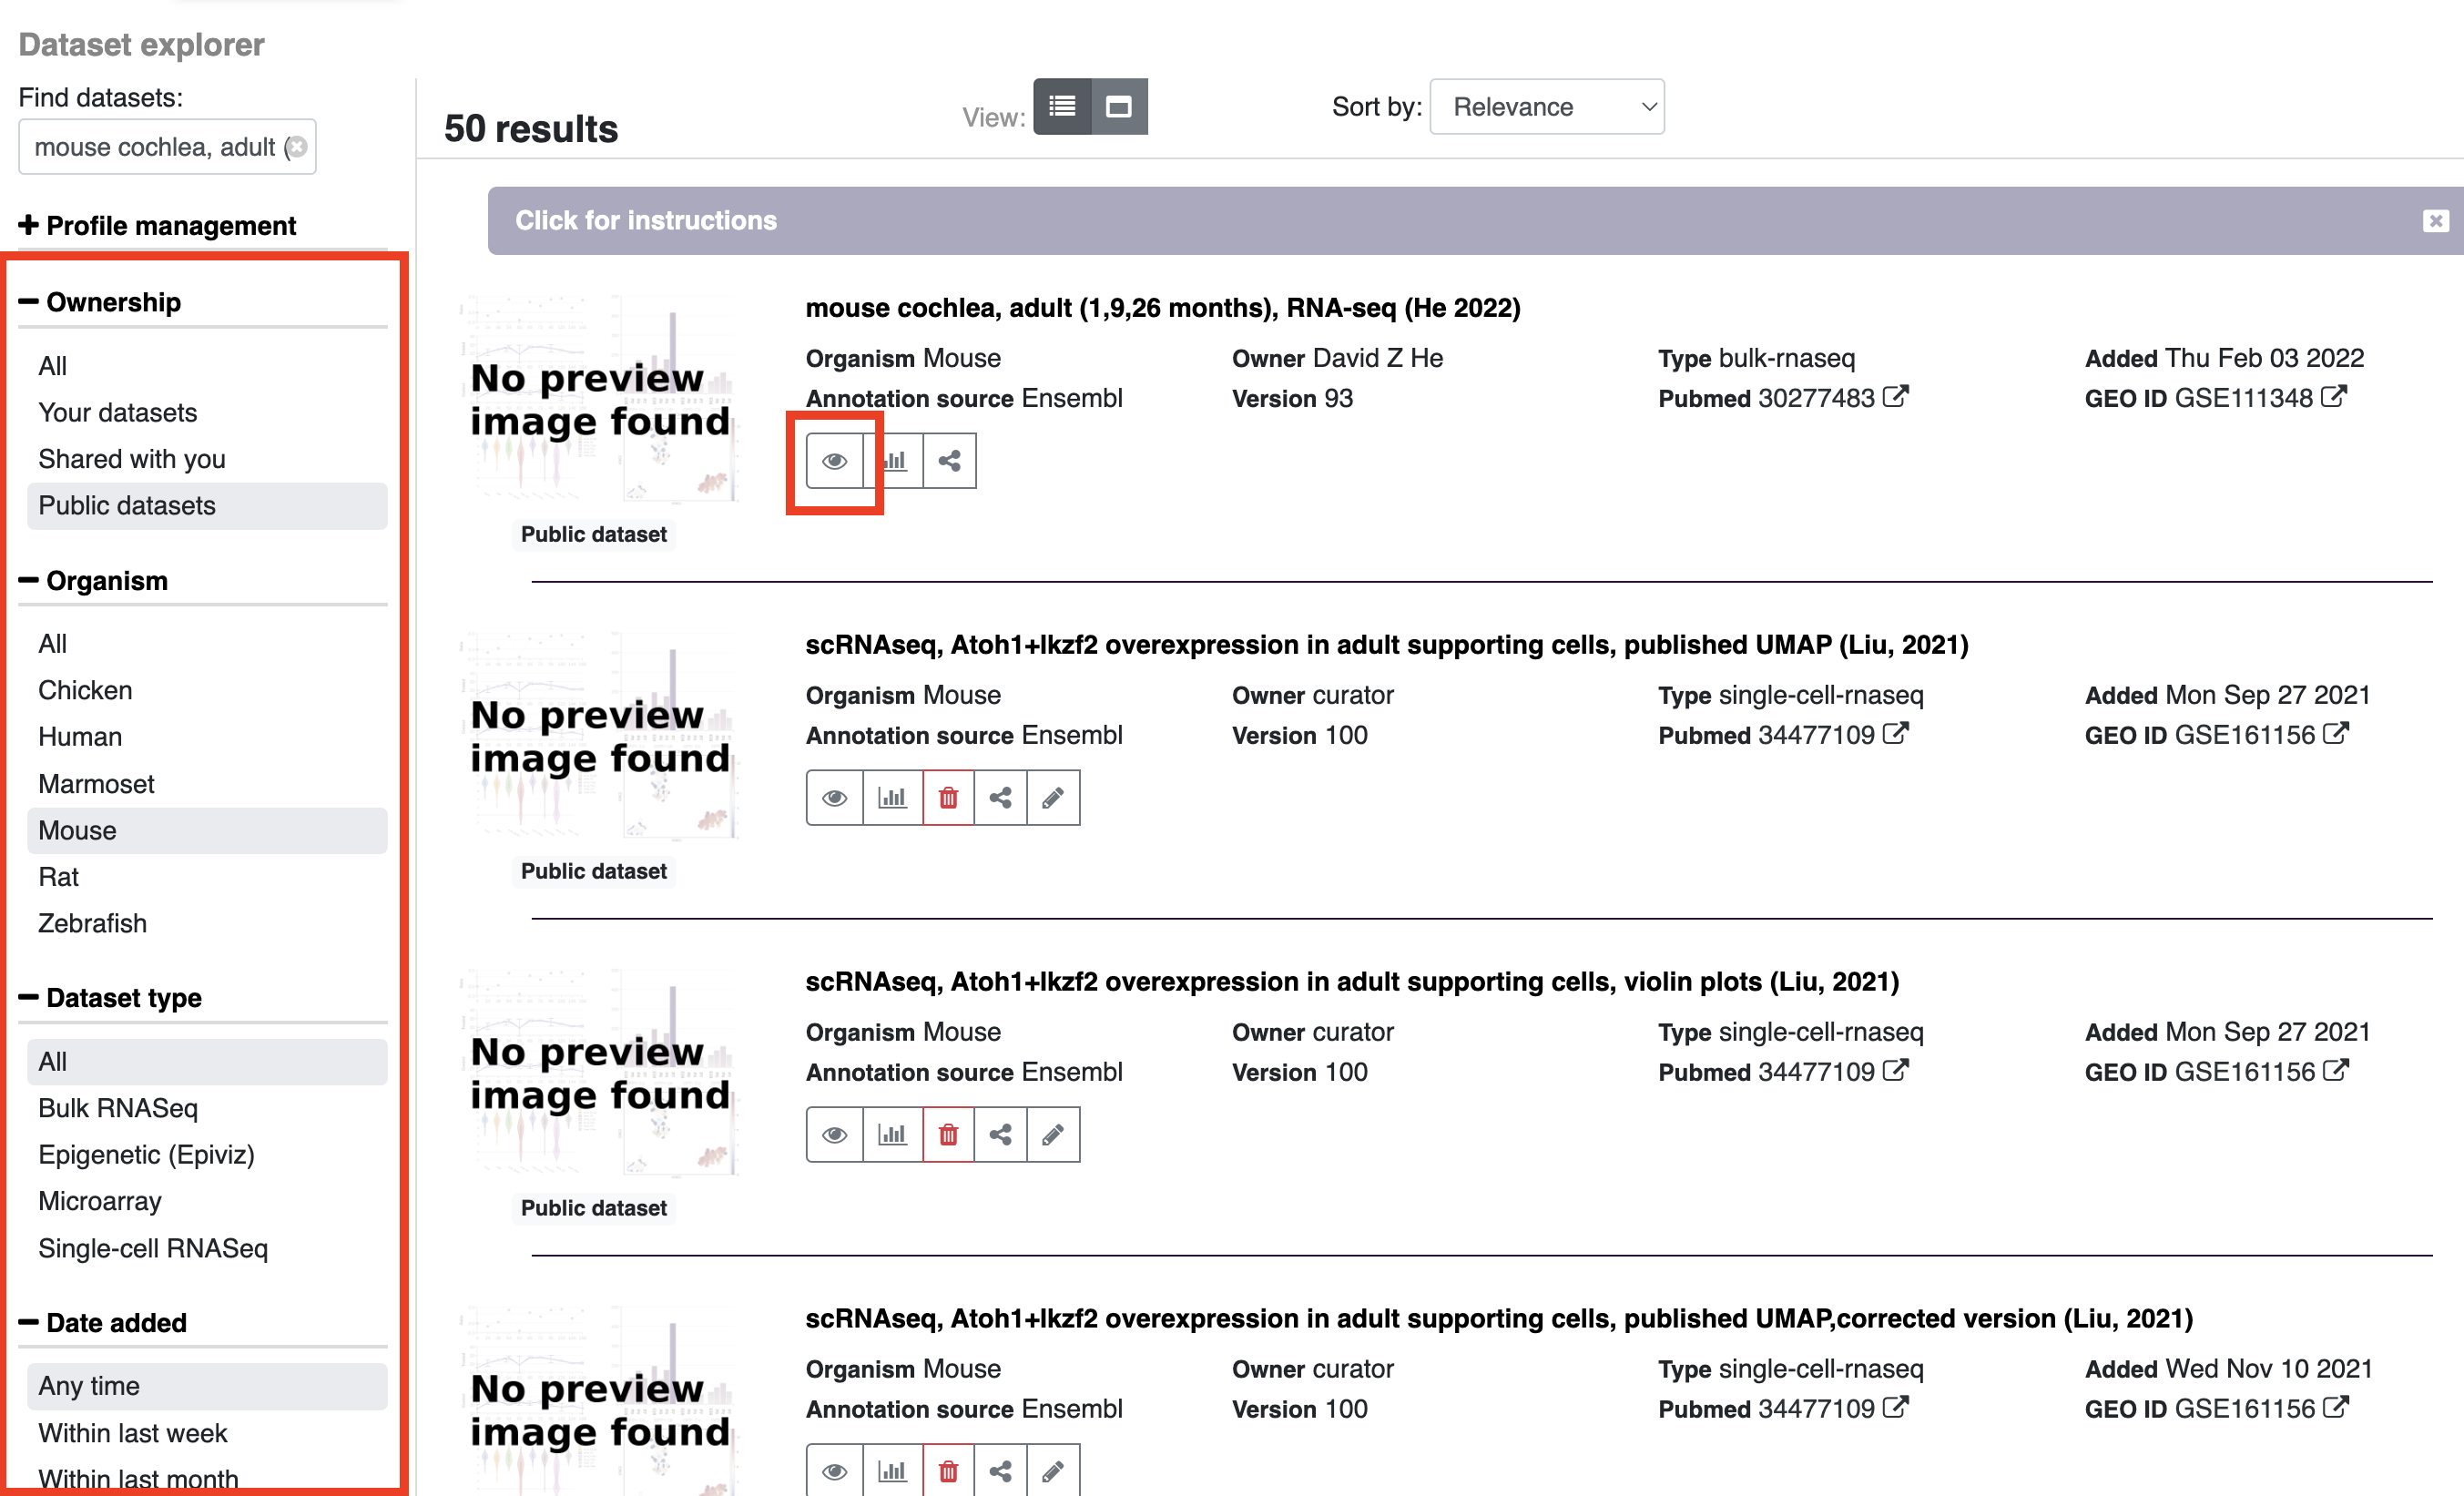
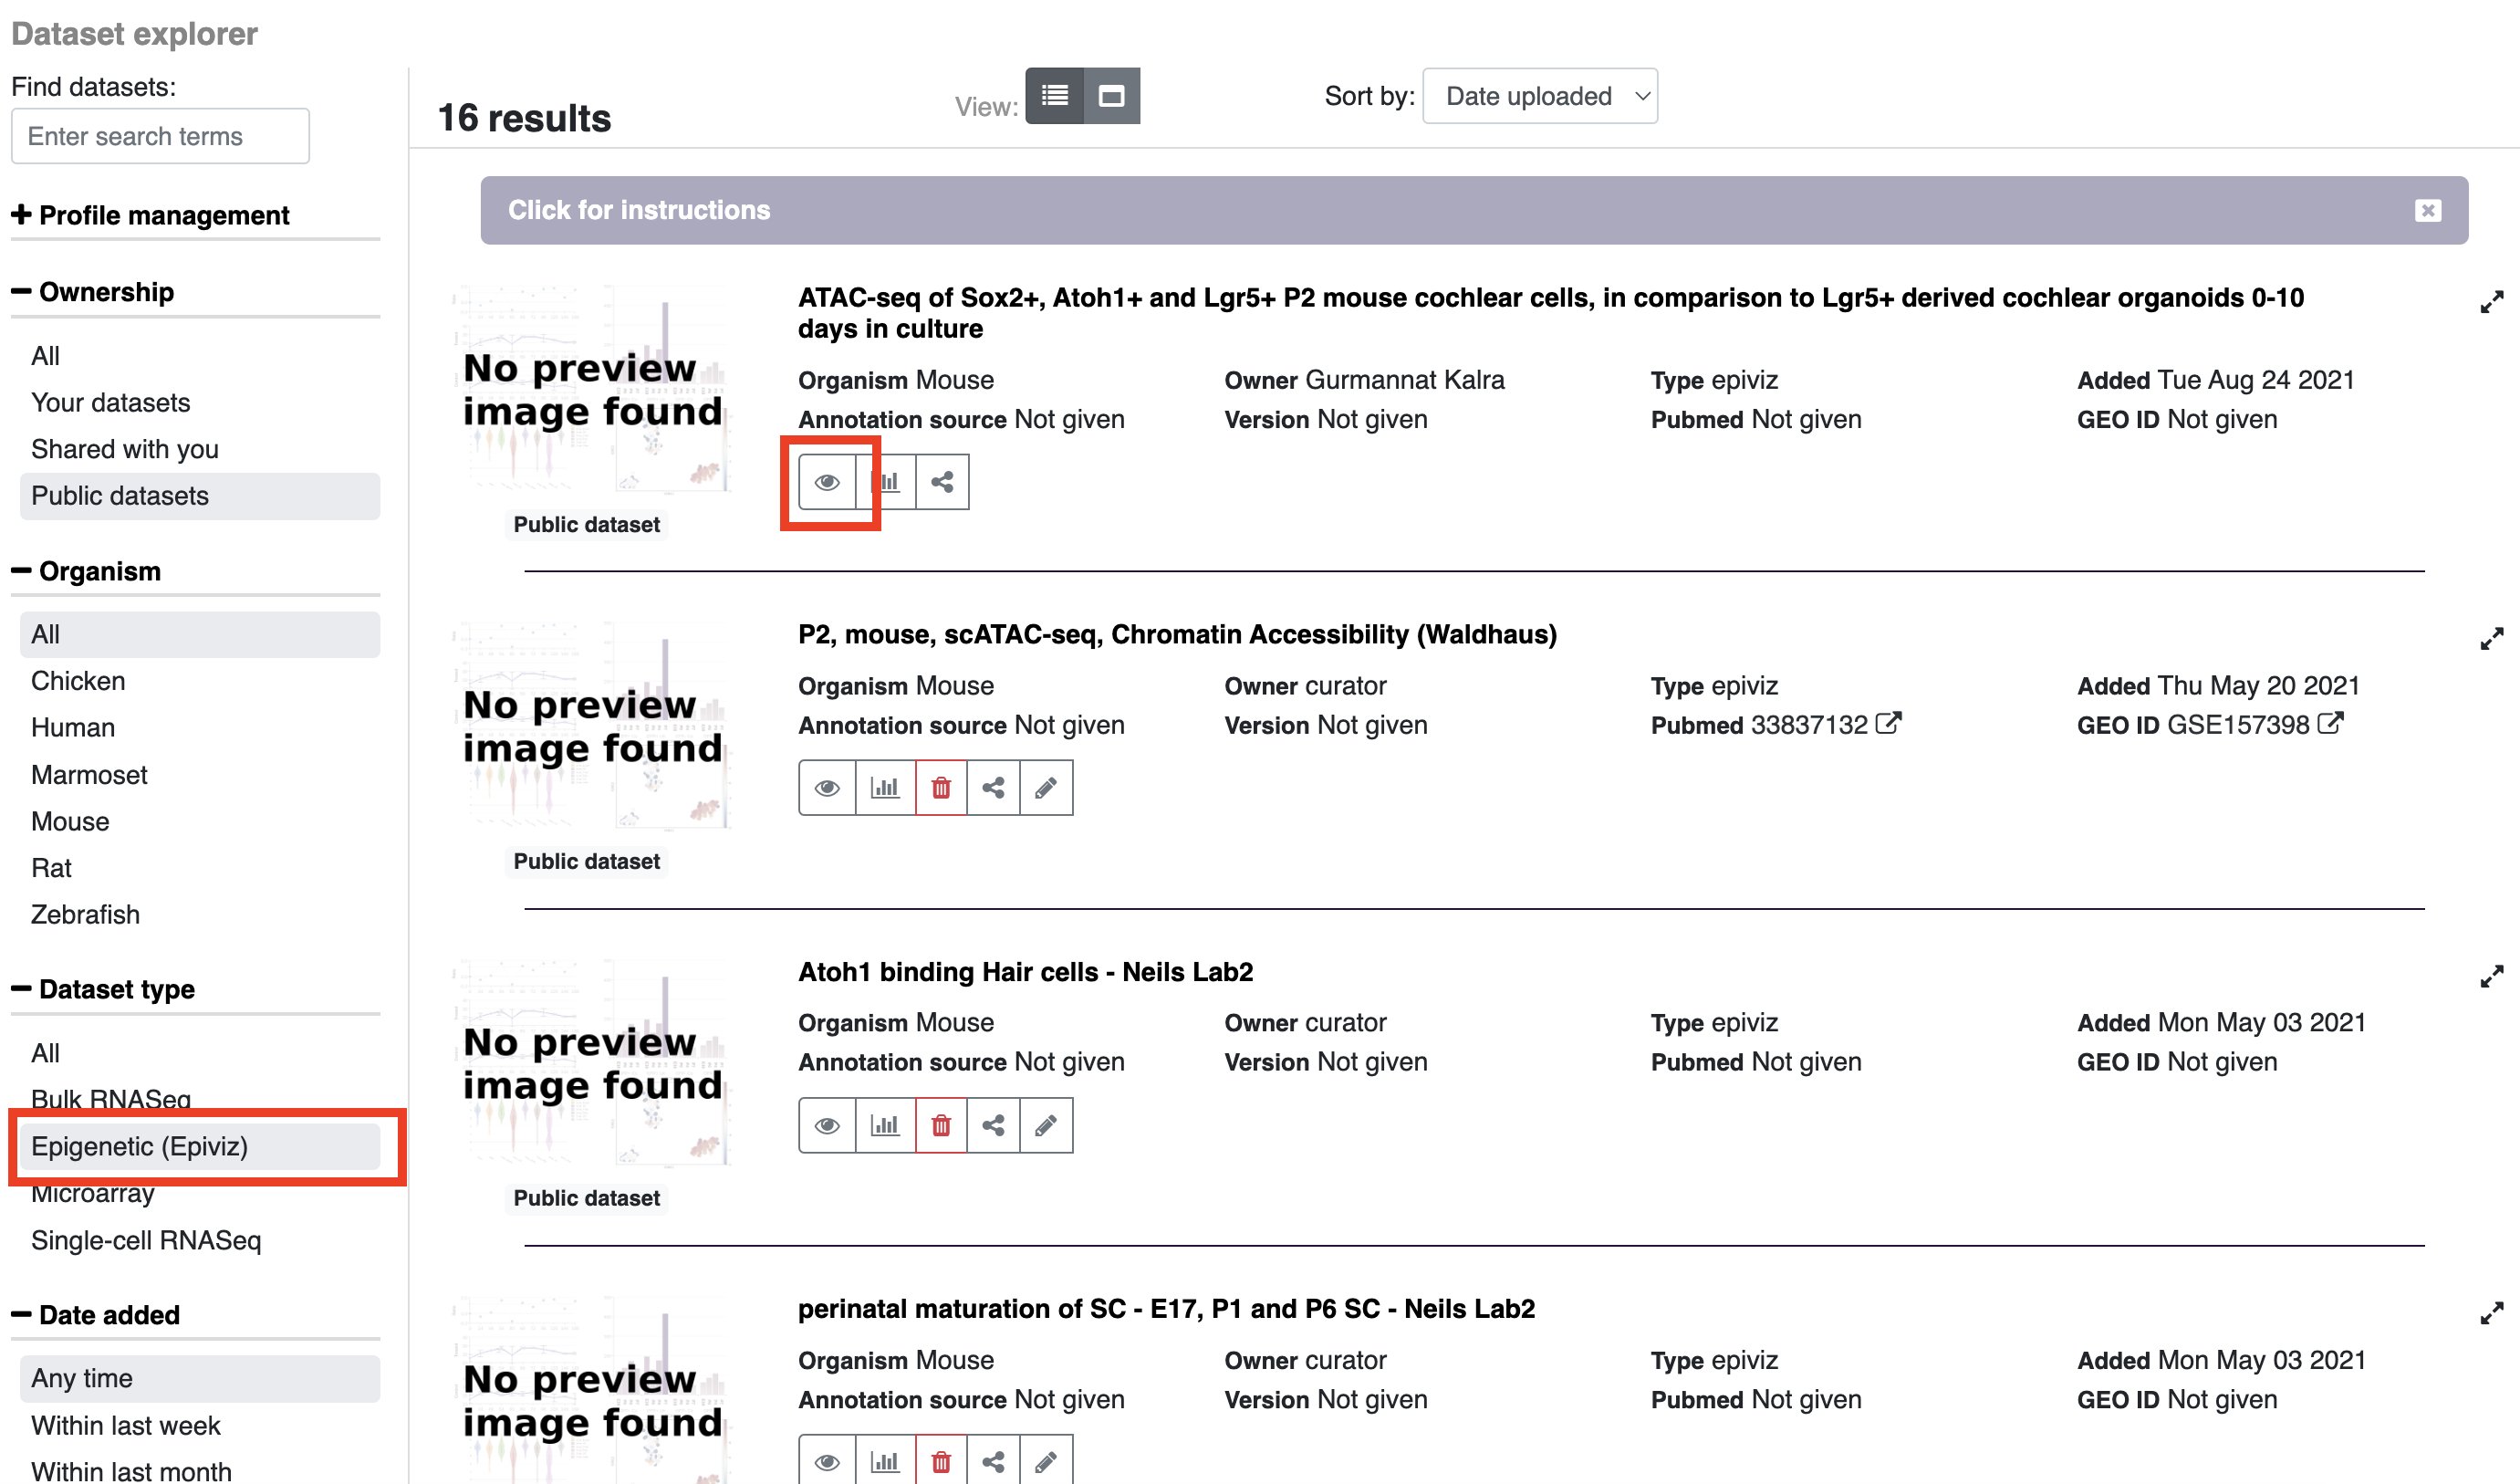
If you wish to look at results for a particular dataset or explore what datasets are available, you can either search by adding terms to the explore datasets box on the homepage or launch the dataset explorer (Either option will open the dataset explorer).

Once in the dataset explorer you can refine your search by type of data, date, organism, etc. by choosing options on the left side of the page. To search for genes within a particular dataset, click on the eye symbol and enter your gene/genes of interest in the search box.
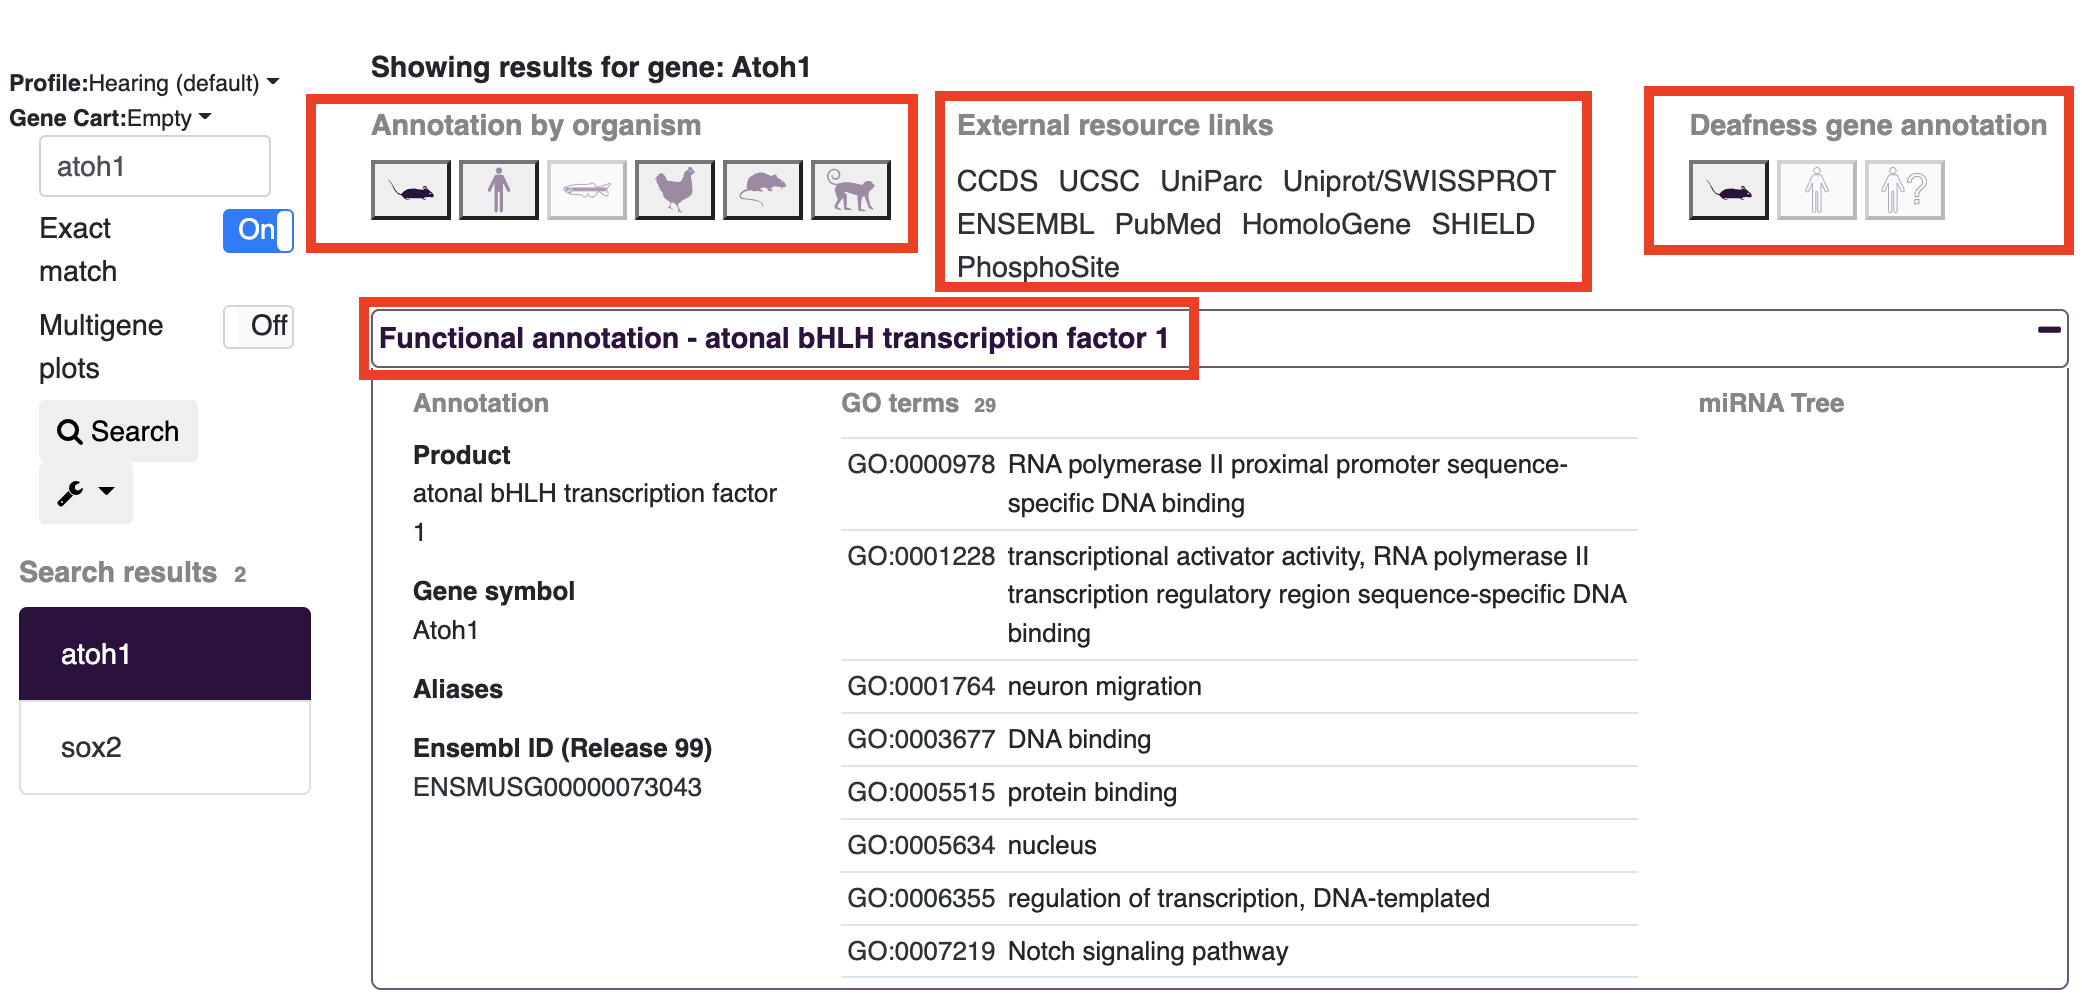
Gene annotations can be viewed on the gEAR platform in several ways. After searching for a gene, you will see several annotation results at the top of the screen.
-
Annotation by organism:
- The icons under this header will provide information about genes across different species. In the example below (searching for Atoh1) currently shows the mouse annotation as highlighted. Choosing other organism icons will provide the name of the gene in that organism (e.g. ATOH1 in humans) and update the external links to match the gene name listed after "Showing results for gene:".
-
External resource links:
- These options open a new window with the pages for the searched gene on other web resources. Note: If your search includes more than one gene, the links will be displayed only for the first gene in your search.
-
Deafness gene annotation:
- On gEAR there is additional annotation information related to deafness (for common deafness related genes). Clicking on the icon will provide a list of phenotypes and links out to deafness specific resources.
-
Functional annotation:
- Clicking on the functional annotation text will expand the window to show additional information for the gene of choice including: GO terms, full names, and any aliases.
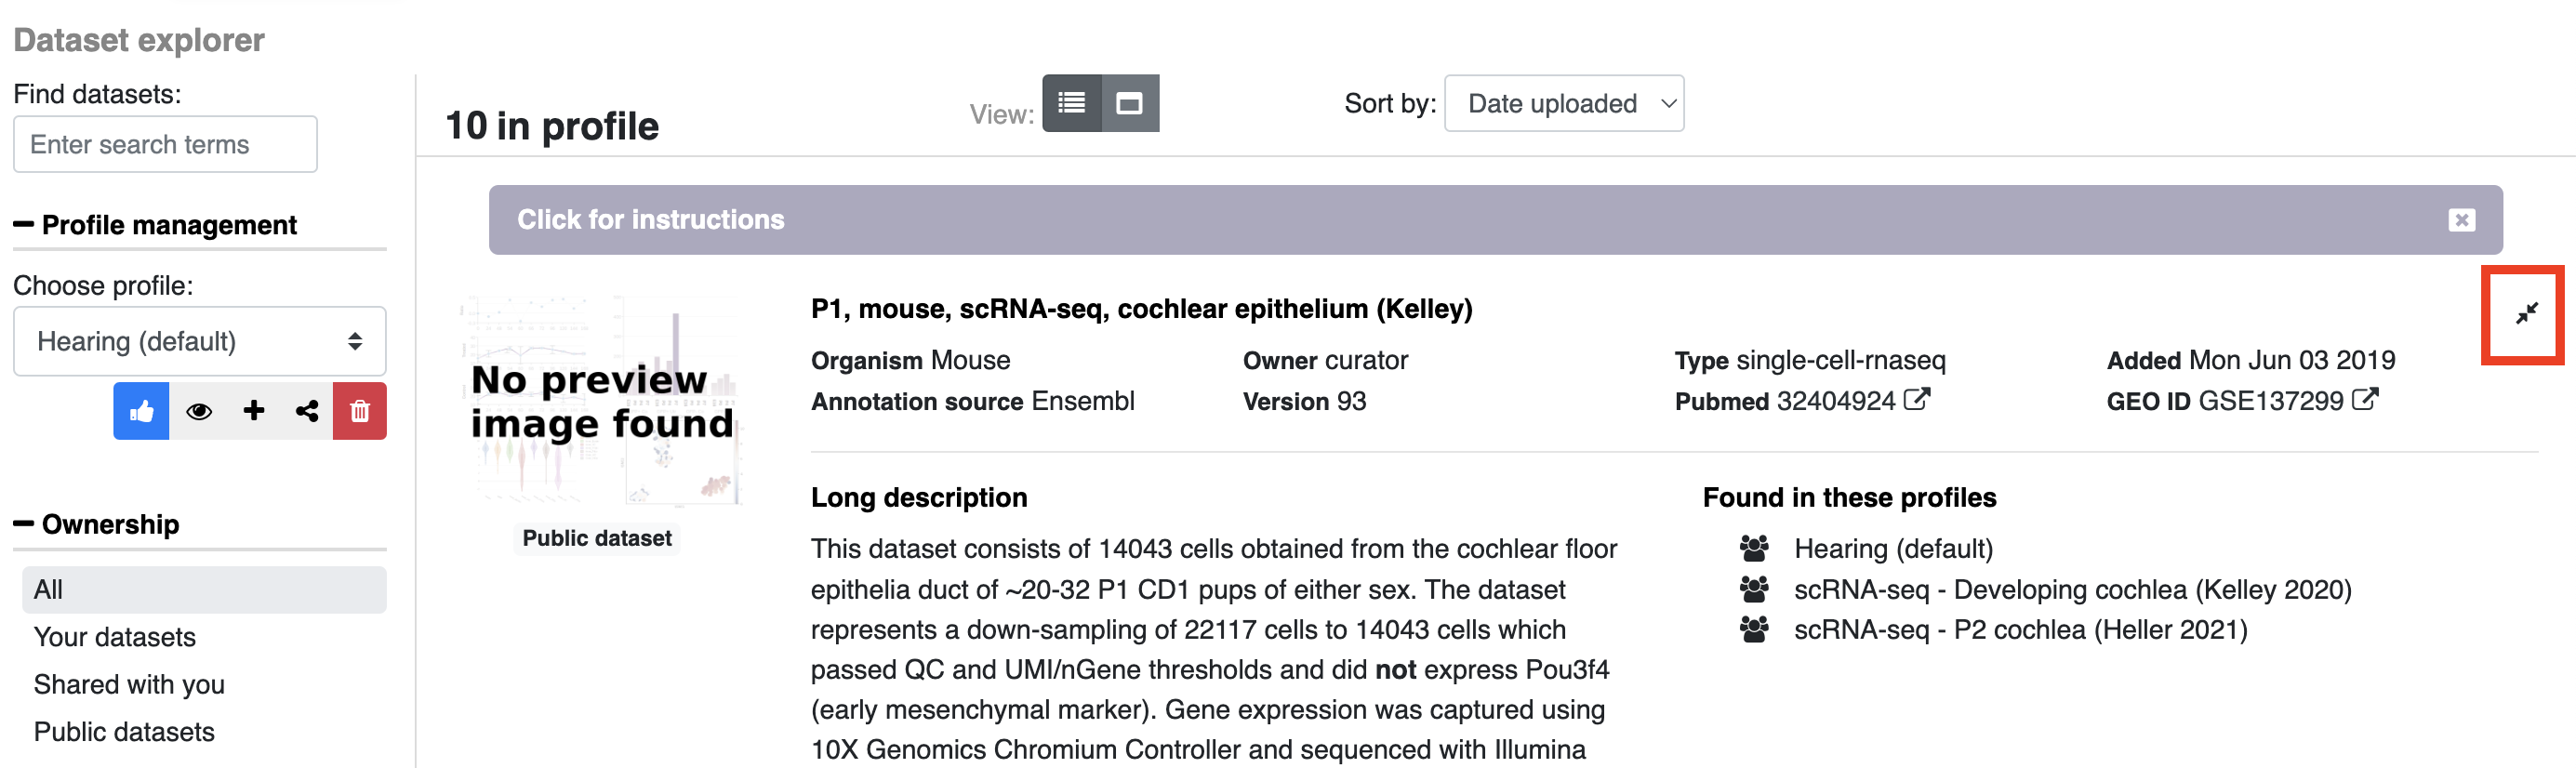
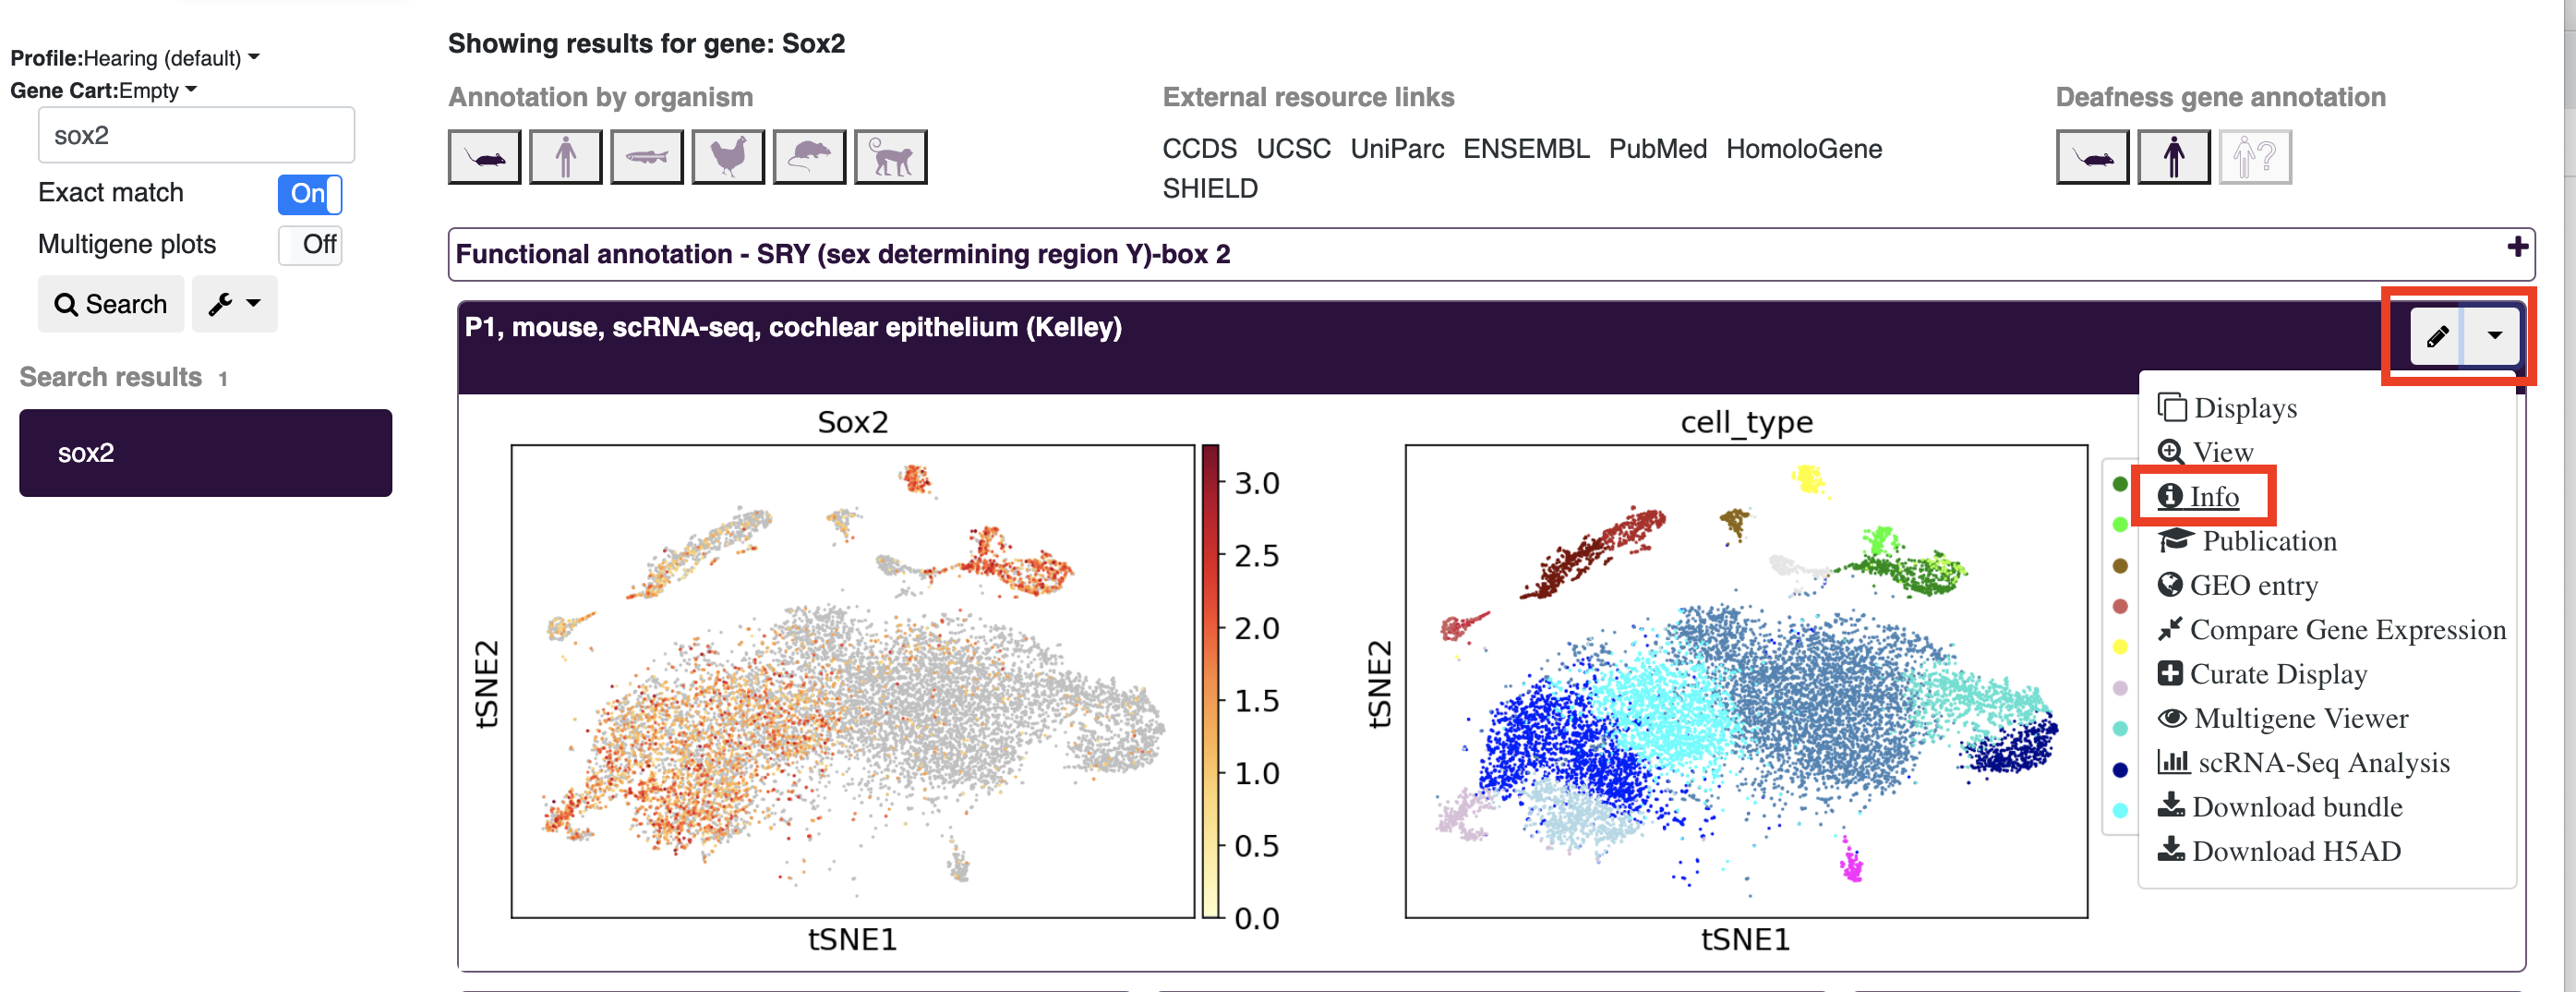
There are two ways of viewing the information associated with a dataset:
- Within the dataset explorer, click the expand button located on the right side of each entry.
- When viewing a profile (e.g. after searching for a gene), open the dropdown menu and click info for a popup window with additional information to appear.
Profiles are gEAR's way of collecting together datasets around a similar topic. The gEAR team maintains a number of curated profiles but any user can create their own profile of datasets to explore.
To select a profile you wish to search within, use the dropdown menu in the gene expression viewer to pick a profile (you will see options for highlighted profiles, you own profiles, profiles from groups you are a part of, and profiles shared with you.
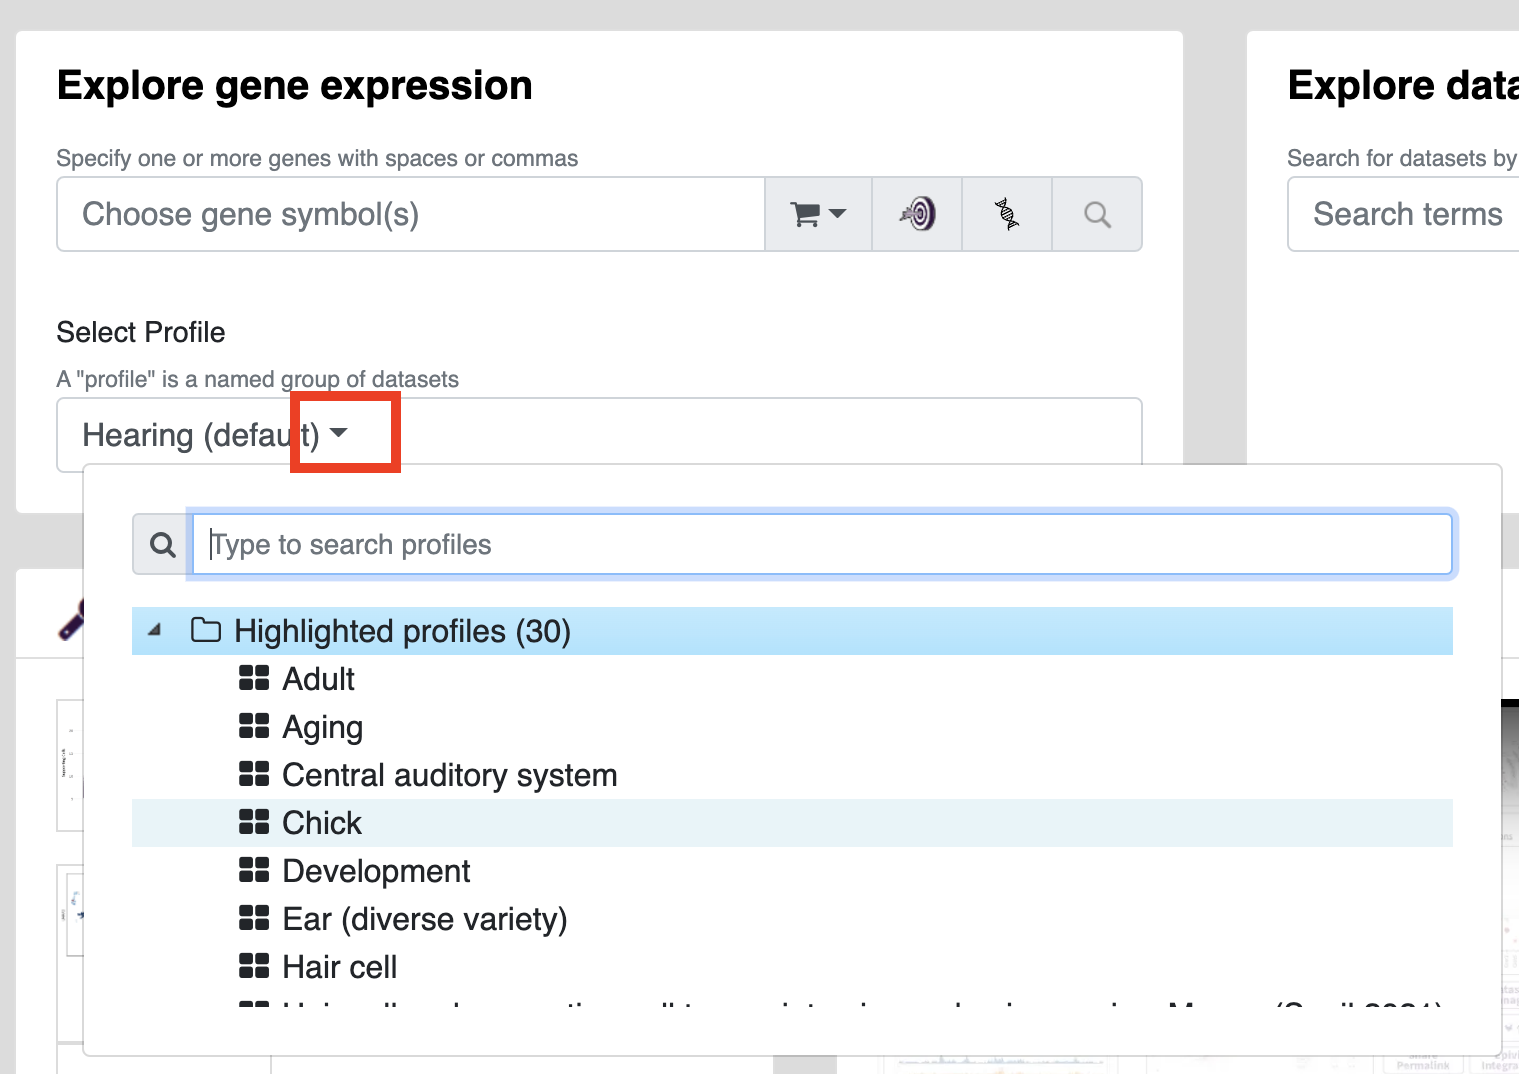
The default profile (Hearing) contains 10 datasets that offer a broad overview of gene expression while other profiles may be devoted to specific organisms (e.g. zebrafish) or collections of displays used in individual publications. Profiles can be created and modified in the Dataset Explorer (Note: you can't directly modify profiles owned by others but feel free to make duplicates with any modifications you wish).
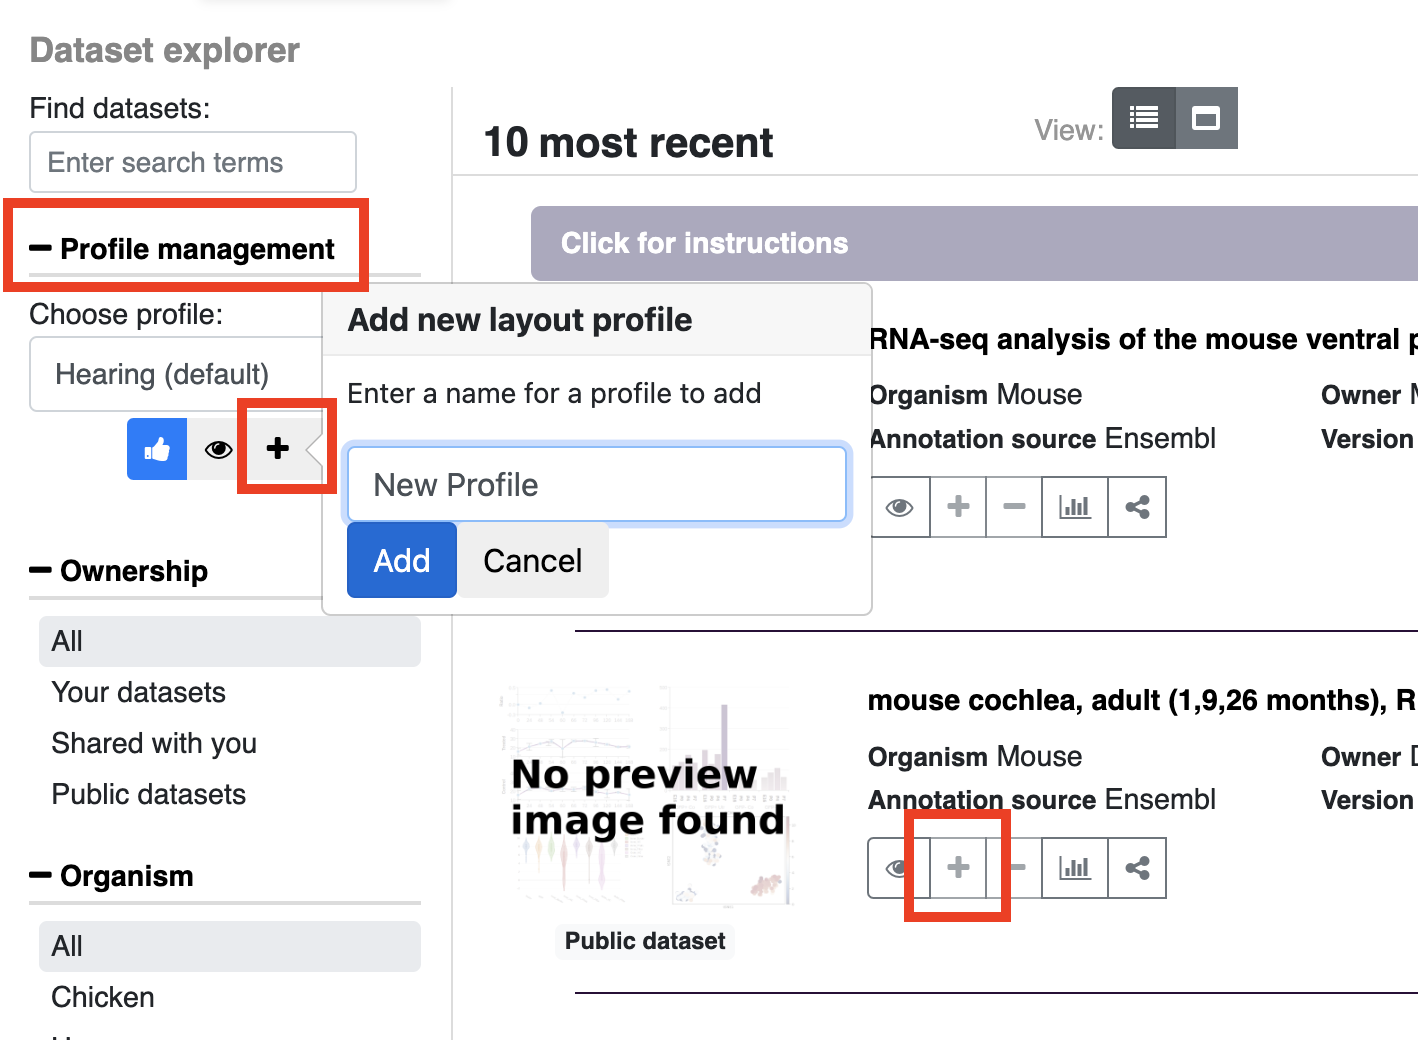
In the dataset explorer, open profile management (on the left bar) and choose the plus icon to create a new profile. Add a profile name and click add. After you click add, you will see the new profile name in the dropdown menu. To add datasets to this profile, click the plus sign shown in the entry for each dataset, to remove already added datasets use the minus icon. If a dataset is already in the profile or if you do not have permission to modify a particular profile the plus sign will be grayed out. To see what profiles are currently in the profile, click the eye icon. If you wish to make another profile your default on the homepage (i.e. a profile other than the default Hearing profile) click the blue thumbs up arrow.
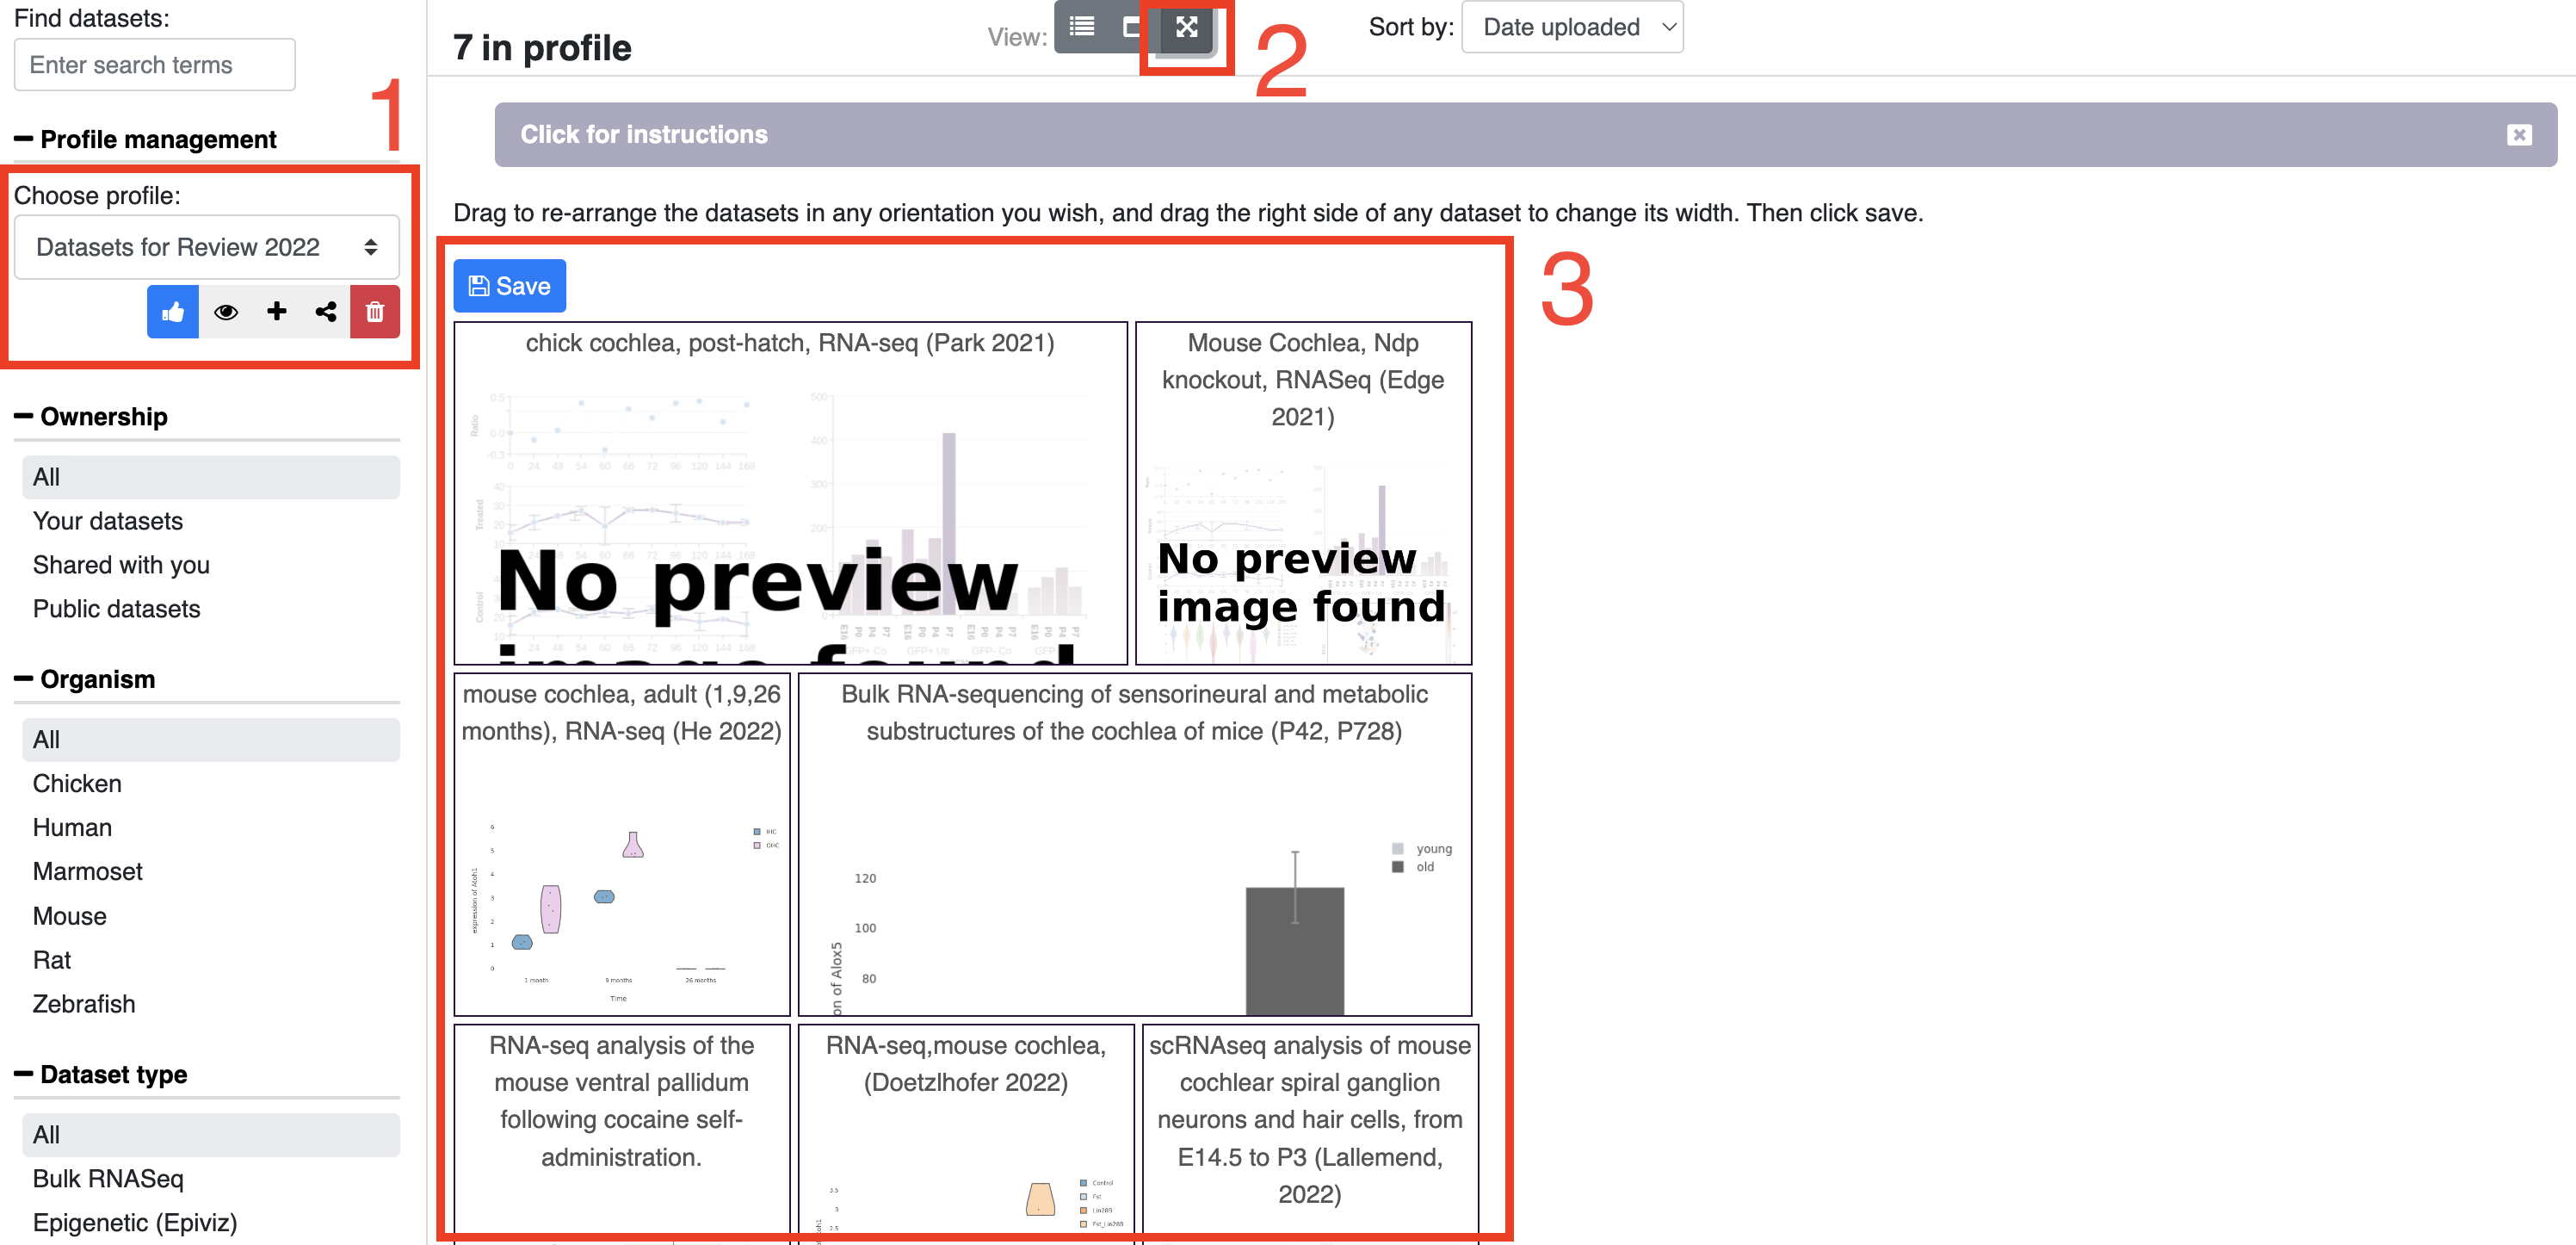
The layout of profiles (e.g. how they are viewed when searching) can be altered in the dataset explorer.
First, select the profile you wish to alter using the Profile Management dropdown (note: you can only alter profiles you own, but feel free to make duplicates of other profiles and alter however you wish).
Next click on the arrangement view button (top center of page). If you do not have permission to alter the layout of the profile, this button will not be present.
By dragging, you can rearrange the order and size of each dataset within the profile. Make sure to hit save when finished.
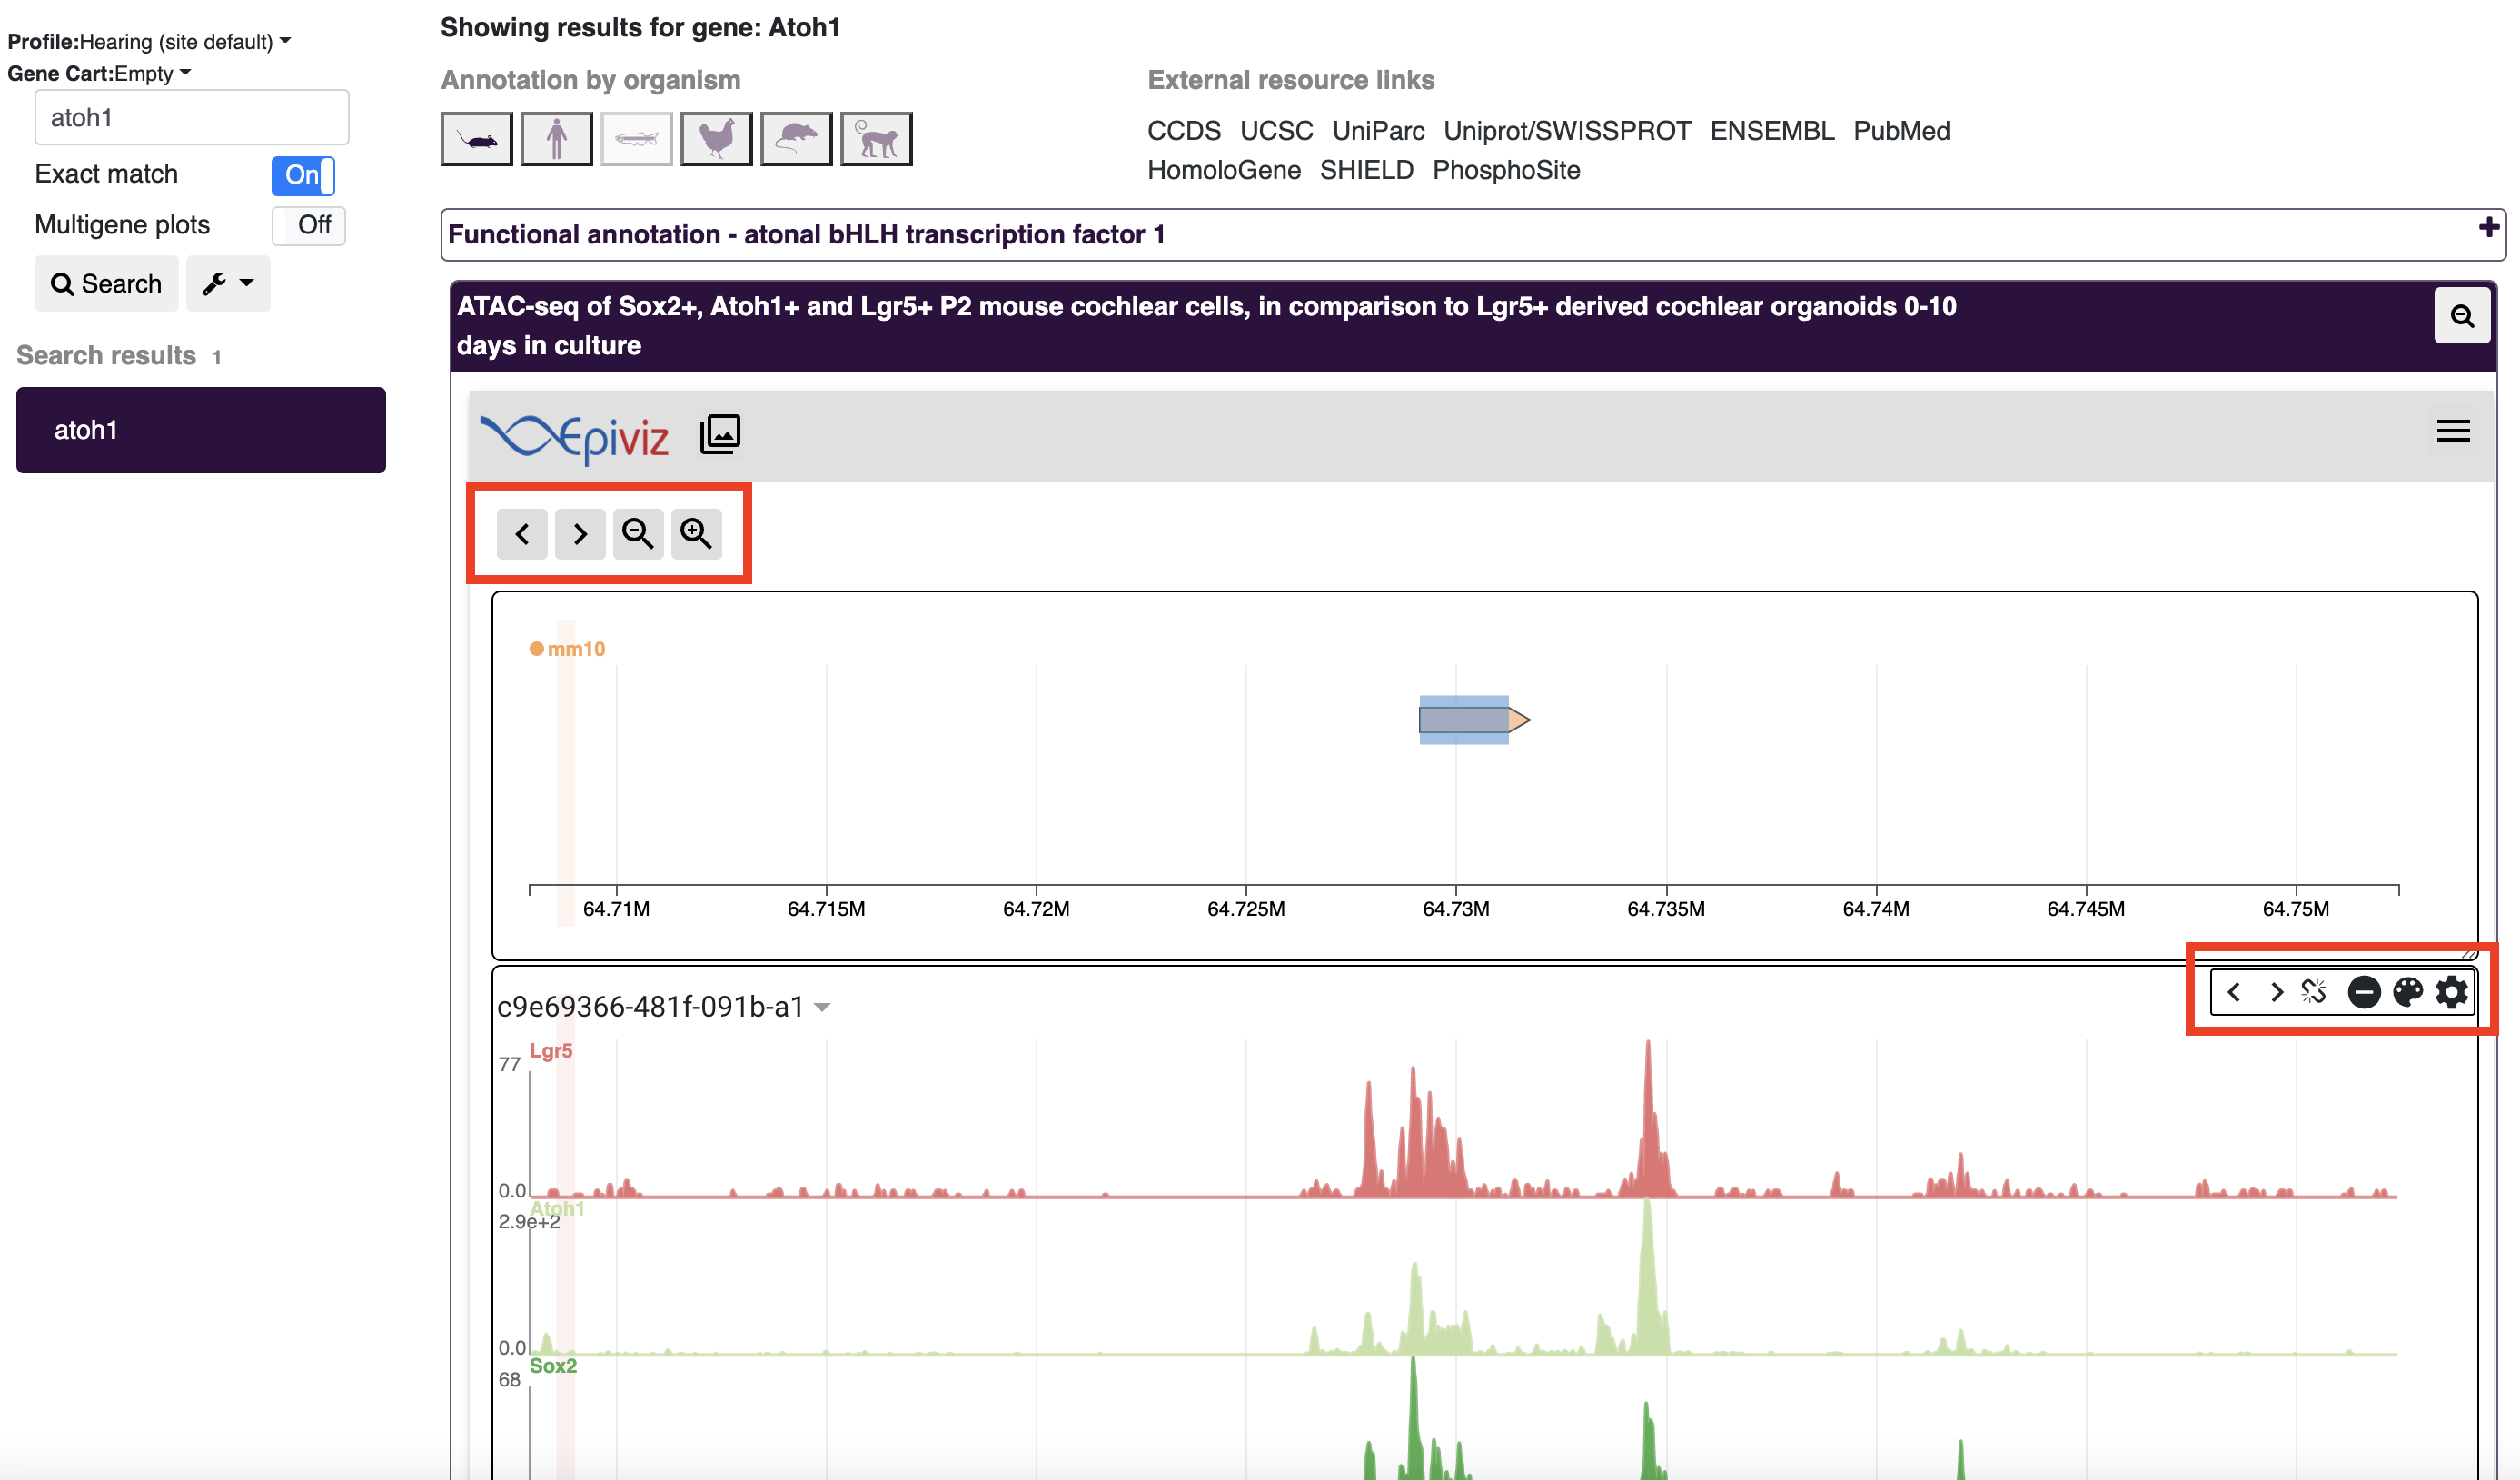
gEAR offers visualization of functional genomics data through integration with Epiviz (EpiViz site). EpiViz displays can be viewed in existing profiles or in the dataset explorer (similar to how other datasets are viewed by clicking the eye icon).
EpiViz displays are separated into several panels. The top panel displays the genome build for the searched gene of interest (atoh1 in the example below), while the panels below show the expression profiles of the various samples present in the dataset. Both panels have various controls for zooming into regions, or changing plot attributes.
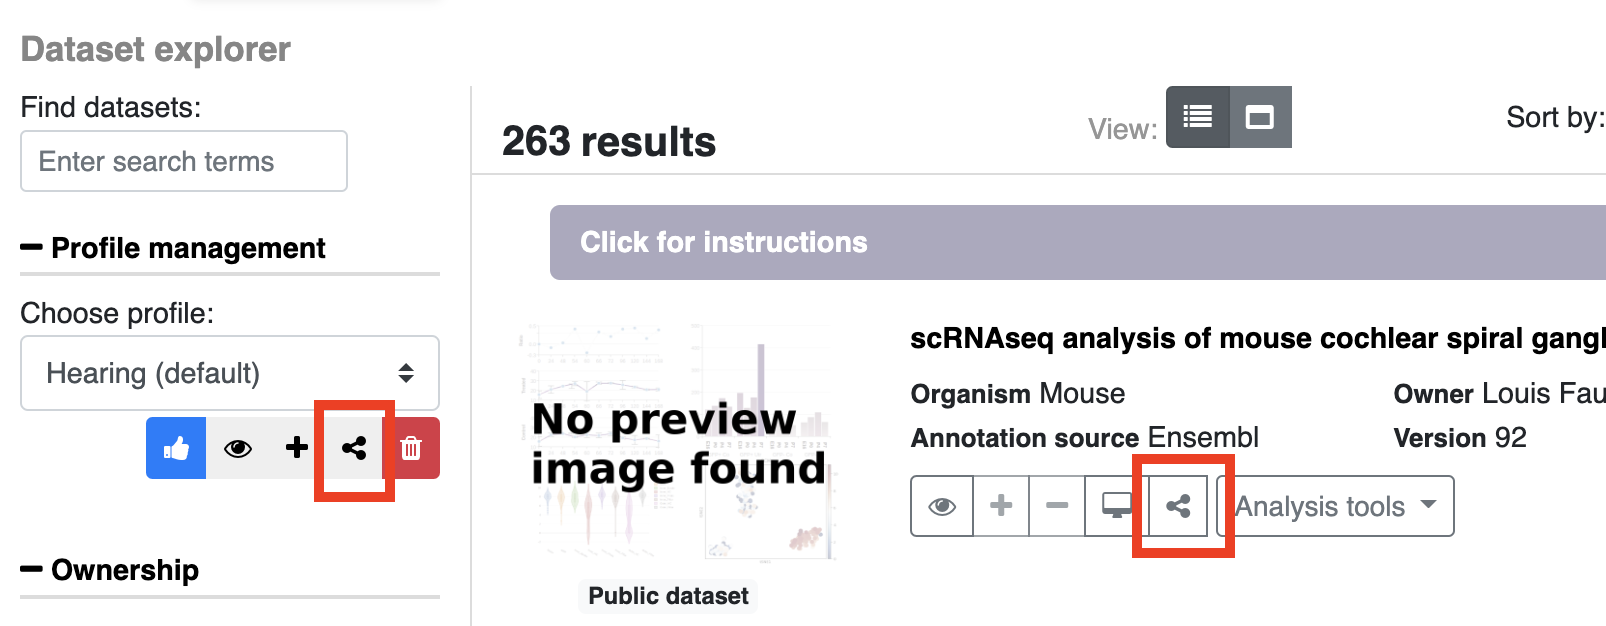
While public profiles and datasets are visible to all gEAR users, any dataset or profile can be shared via a URL. To share, find the dataset or profile in the dataset explorer page and choose the share icon next to either the profile or dataset name to copy the URL to your clipboard (see below). A common use of these URLs is to provide a link in manuscript figure captions to allow readers to conduct their own exploration of data used in a manuscript figure.
If you wish to share datasets or profiles with a group of individuals (functionality currently in development) contact the curator team for assistance with setting up group permissions.
If you would like custom permalinks , please contact our curator team for assistance.
gEAR incorporates several tools for analyzing data with the goal of improving the reusability of genomic data. Graphical interfaces are built around common analysis tools (e.g. a Seurat pipeline for single-cell data) to make the tools more accessible for those without coding experience or the need to download data. The tools can be accessed from the homepage or by clicking on the analysis tools buttons in the dataset explorer.
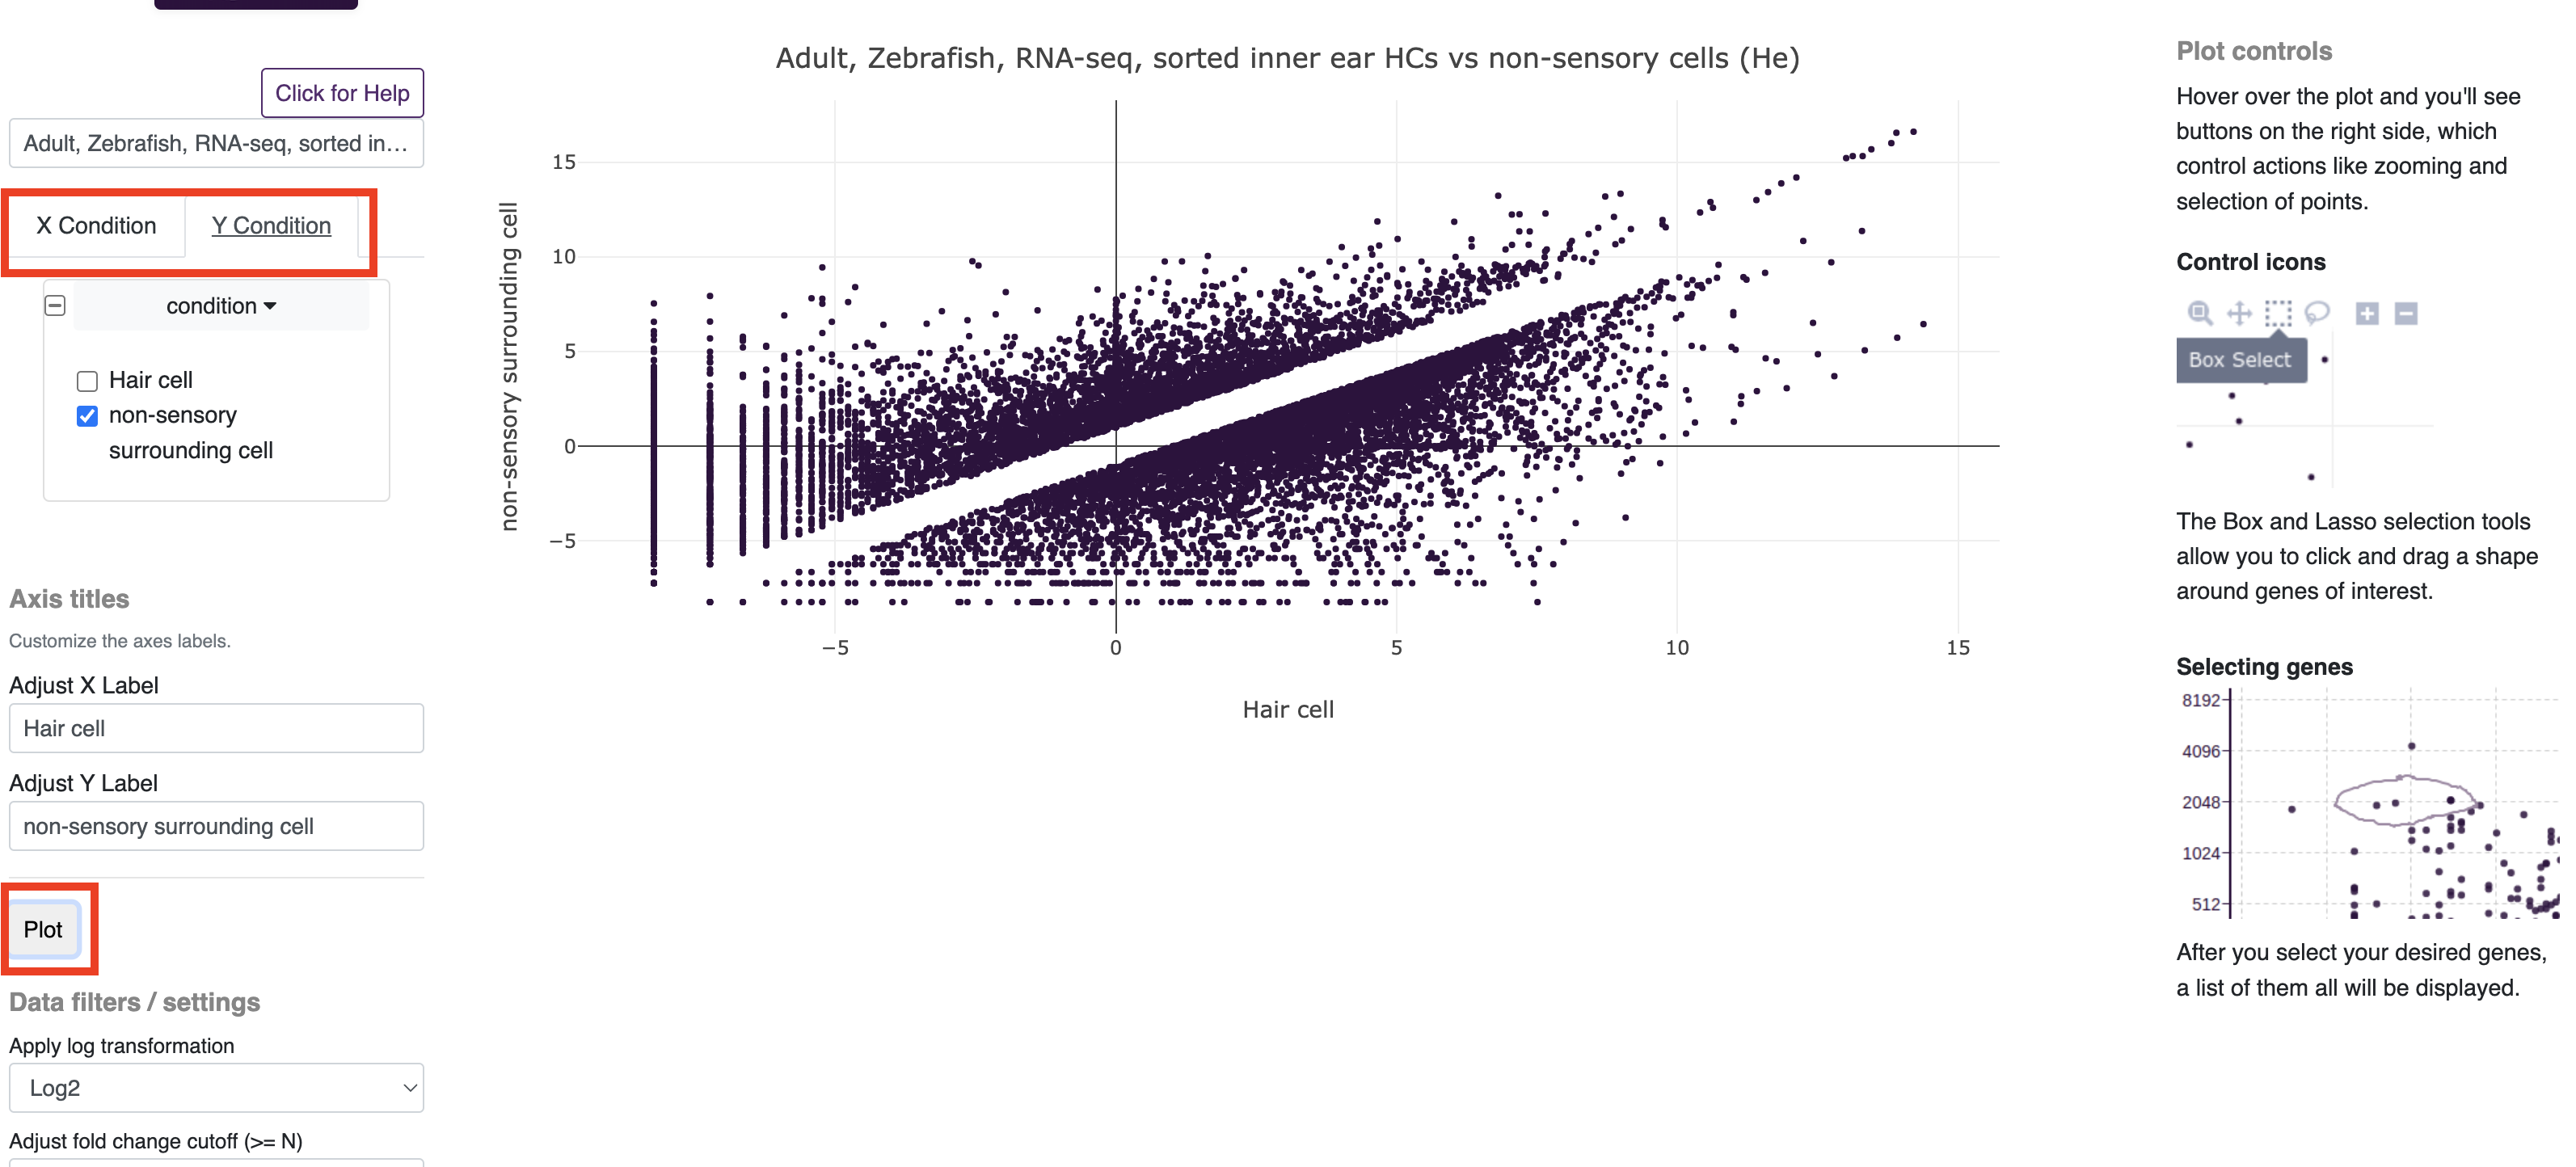
The comparison tool is designed for comparing differences in gene expression (e.g. bulk RNAseq) between two groups of samples and testing for statistical differences in expression (Note: If the dataset does not have replicates, statistical tests will be unavailable. For more in depth instruction of how to use this tool, see the instructions on the tool page (Link).
To get started with the RNAseq comparison tool, select the dataset you wish to use in the dropdown menu and the condition you would like to compare on your x and y axis. Groups can be included or excluded from the analysis using the dropdown and toggle menus. After clicking the plot button, you will notice that genes less than 2 fold change are omitted from the plot (to increase plotting speed), this setting can be changed by increasing or decreasing the fold change cutoff option. Similarly there are options for colorizing or only including genes on the plot which reach a set threshold for significance between groups. In order to perform statistical testing, the dataset must have a column named "replicate" with the replicate ID number for each sample.
The workbench for single cell RNAseq (scRNAseq) is designed to allow biologists meaningful access to single cell data, even with limited informatics training. The workbench begins by selecting a dataset for analysis, and then offers analysis tools following several standard pre-processing steps. It was designed to mimic the workflow of a standardized Seurat pipeline. For more in depth instruction of how to use this tool, see the instructions on the tool page (Link).
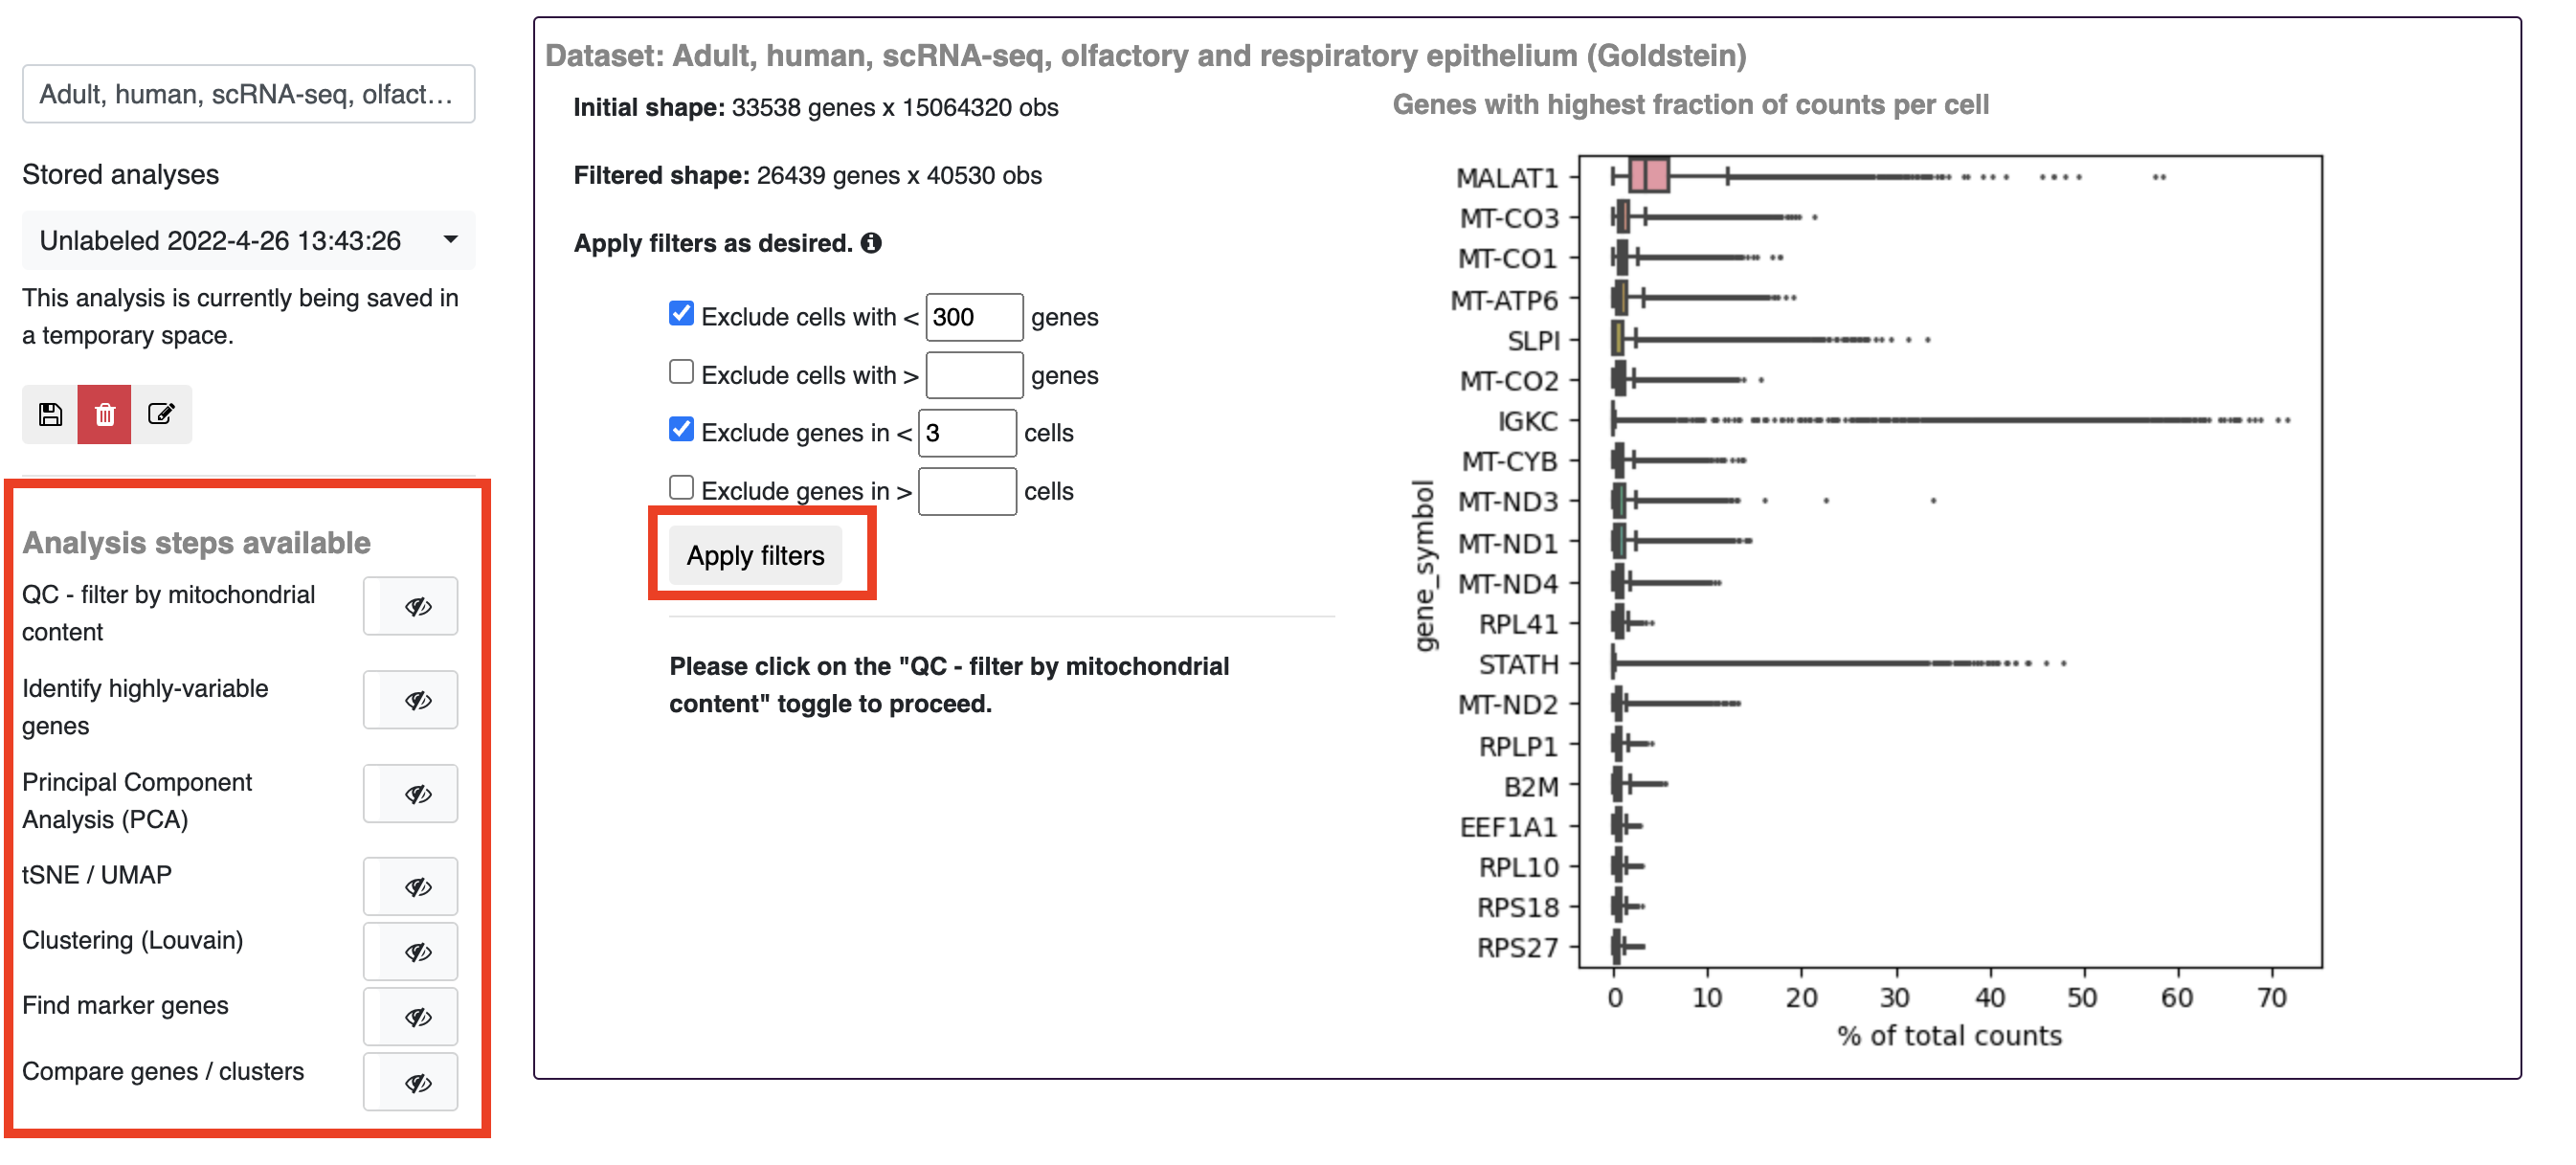
After opening the single cell workbench and choosing a dataset, there will be a choice whether to conduct a new analysis or start from a stored analysis. Stored analysis starts with precomputed results, either uploaded by the dataset owner or from an analysis already conducted and saved on the gEAR platform.
To start at the beginning of the single cell processing steps (i.e. without using a stored analysis), first pick initial filtering criteria to apply to the data. Next, choose 'Apply filter' before moving to the next step. To advance between steps, use the toggle buttons on the left side of the page. In each step of the pipeline, there are general recommendations for criteria to select but these can be changed to better fit your dataset or question.
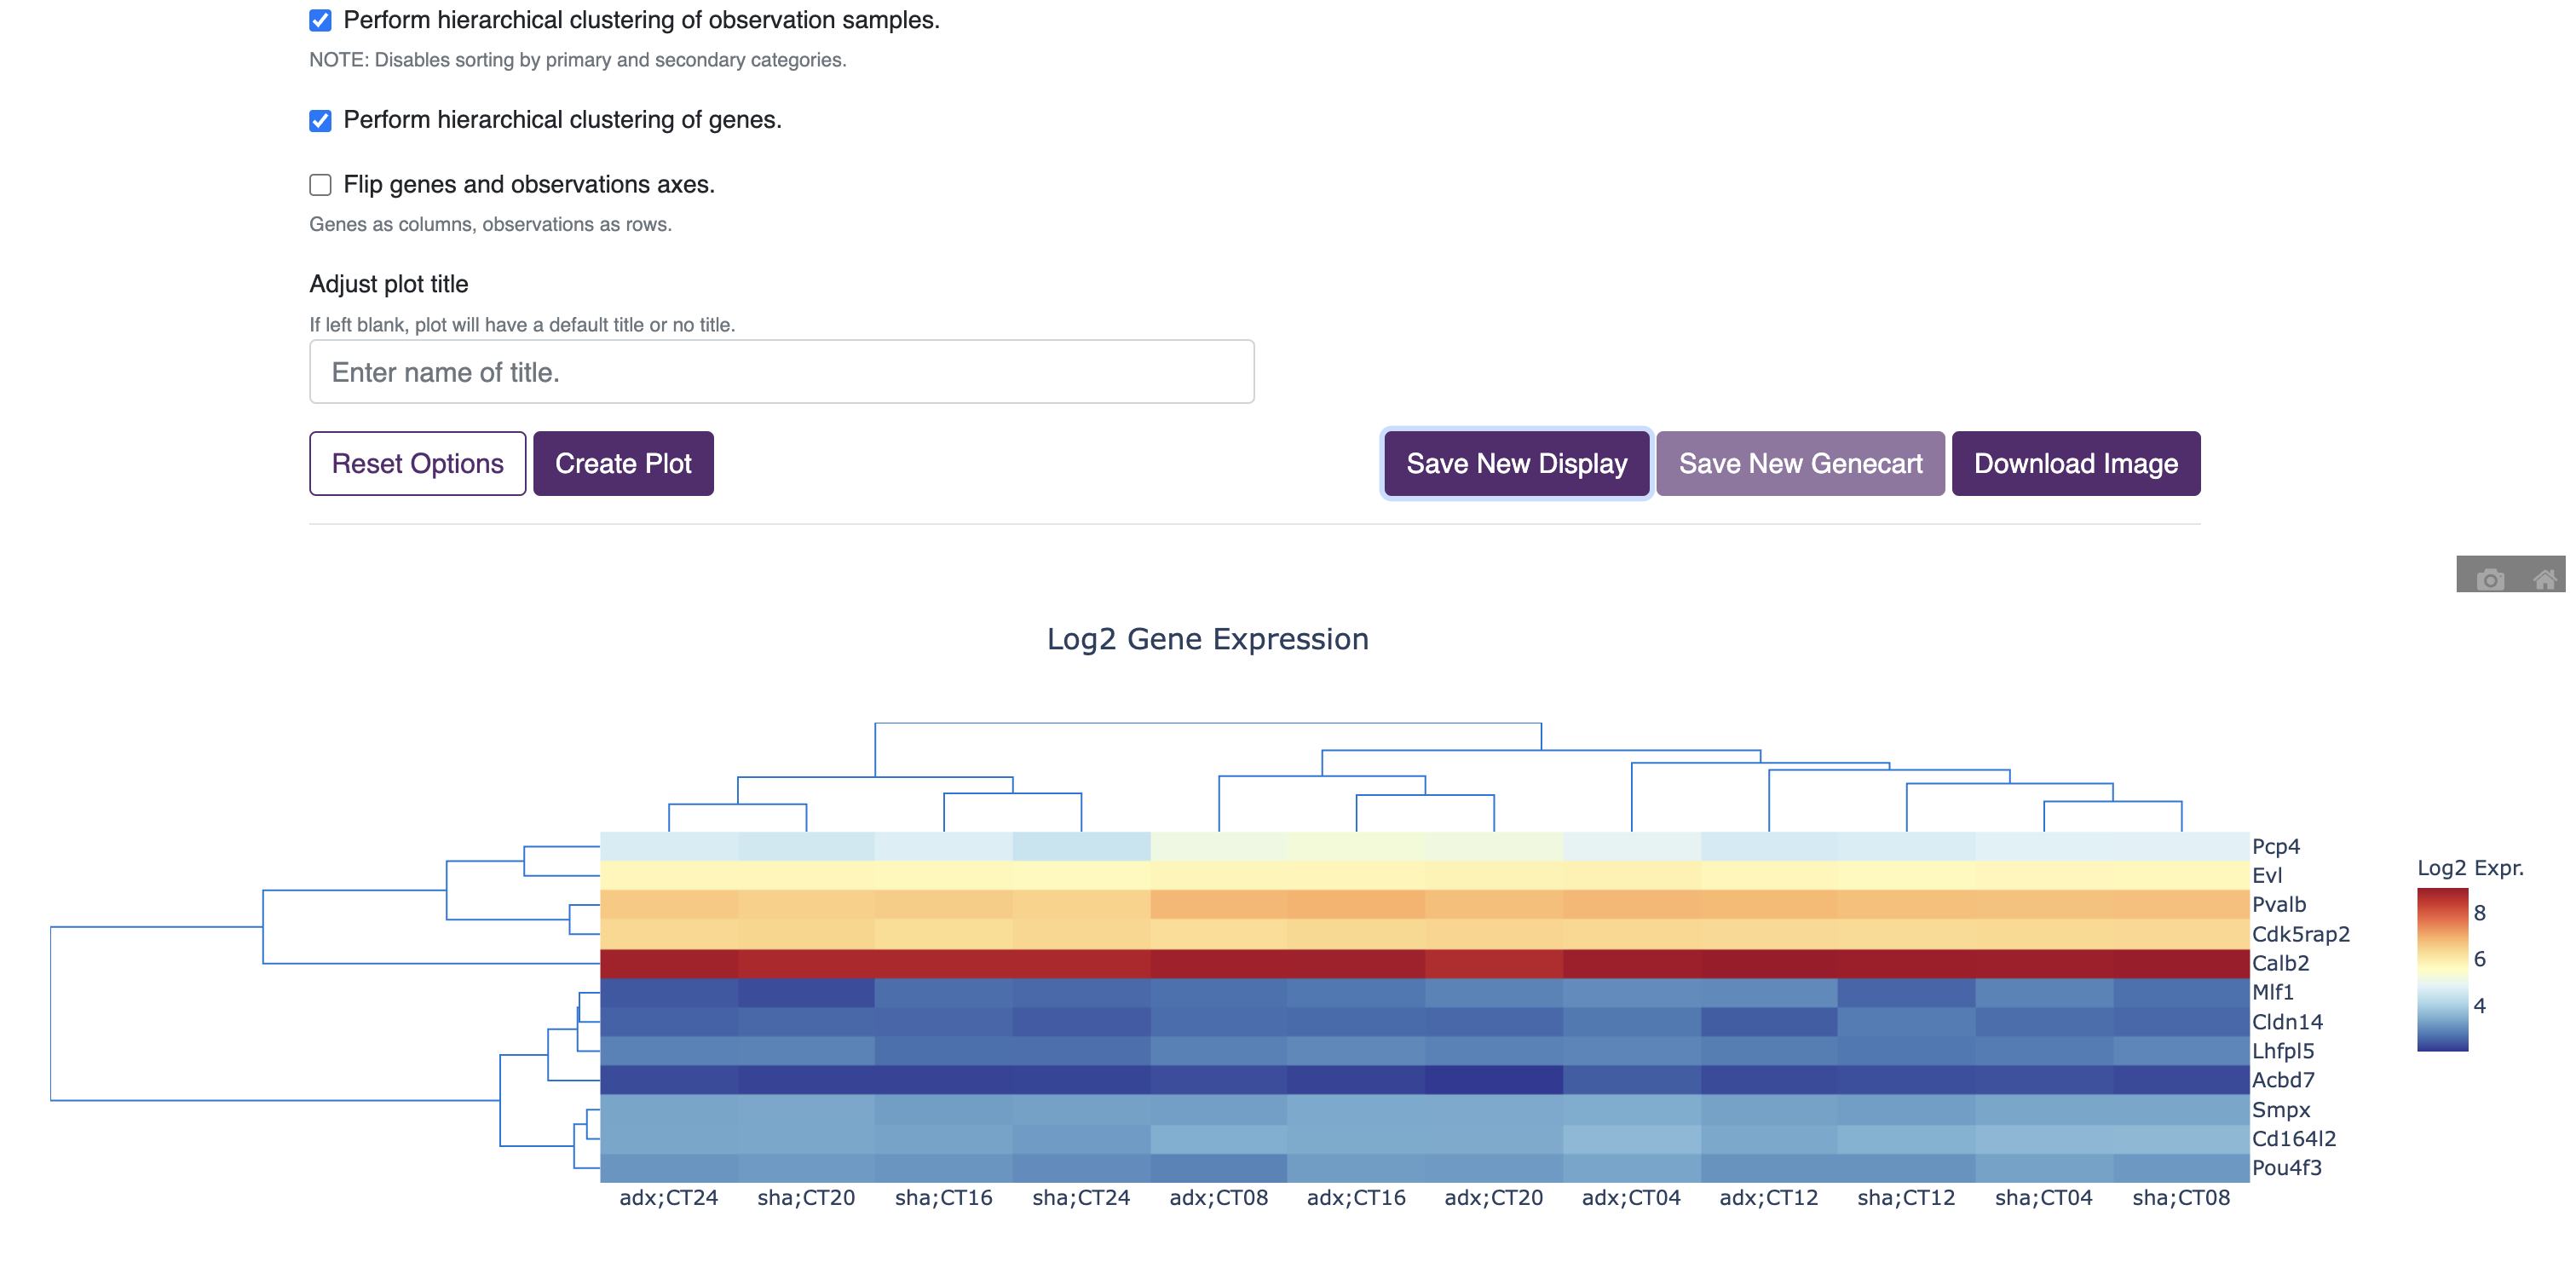
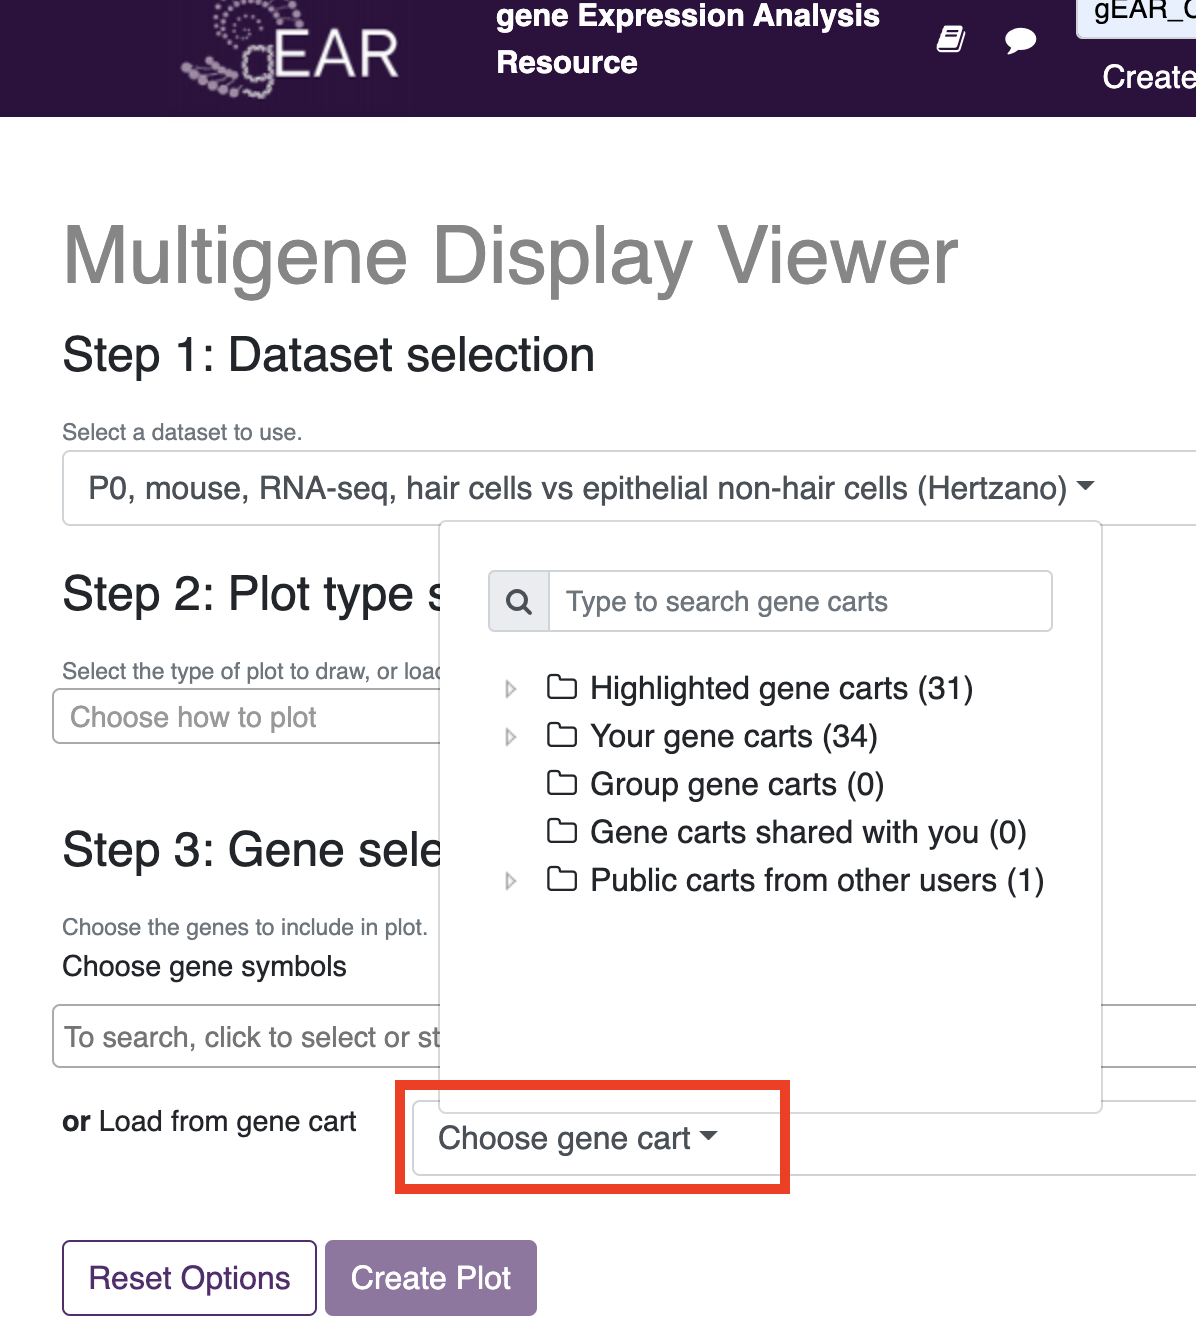
The multigene curator (Link) allows for the creation of displays and plots involving more than one gene (e.g. heatmaps, volcano plots, quadrant plots, etc).
- Select a dataset to plot
- Choose a plot type
- Add gene names of interest. Genes can either be added manually or via a gene cart. If you start typing a gene name, all genes that match and are present in the dataset will be displayed in the dropdown menu
- Select what groups and plot attributes to include
- Create plot After creating the plot, the display can either be saved as a display for the dataset used (Save New Display), or downloaded as an image. Note: if you make a multigene display the default view for a dataset, it will only be used as the default view if 'Multigene display' is toggled on during a search. Also during this step, you can create a new gene cart from the genes selected to be included in the plot.
Similar to how profiles are used on gEAR to collect datasets, gene carts are used to make comparisons of multiple genes easier across multiple analyses. Gene carts have various functions throughout the site but their most common use is to create user defined lists of genes that can be added into multigene plots or other plotting functions. For example, if you find a set of genes in one analysis (or from a manuscript) and want to view how they differ between treatment groups in another dataset, you could either manually add the gene names each time you wish to use them or store them together in a gene cart and be able to quickly access and share your gene lists with others.
Gene carts can be created manually, via upload, or directly from analysis outputs:
-
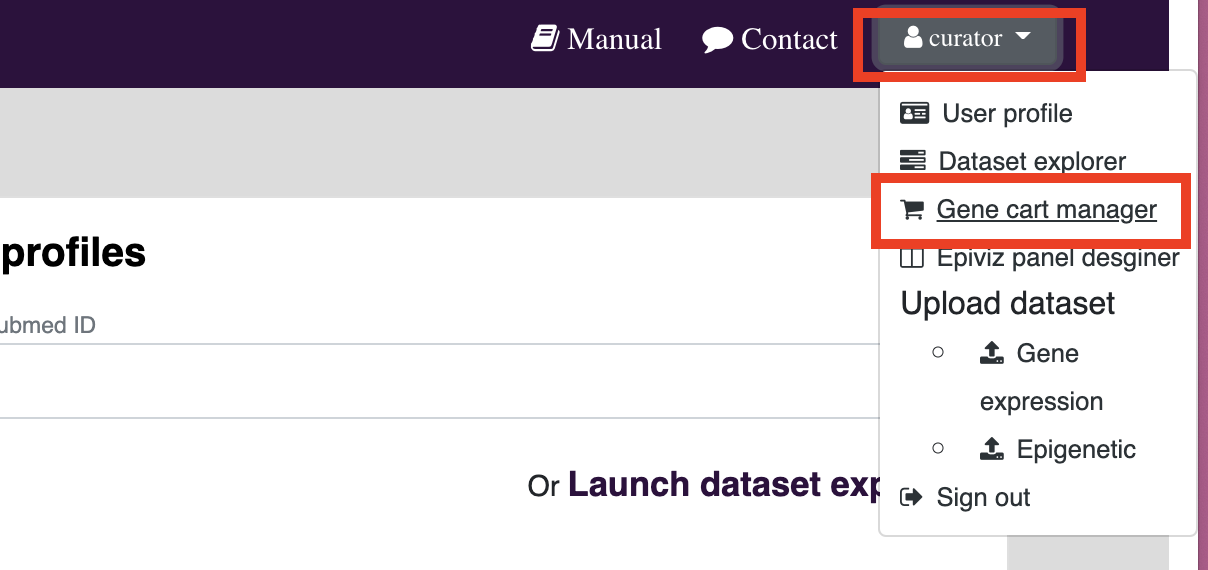
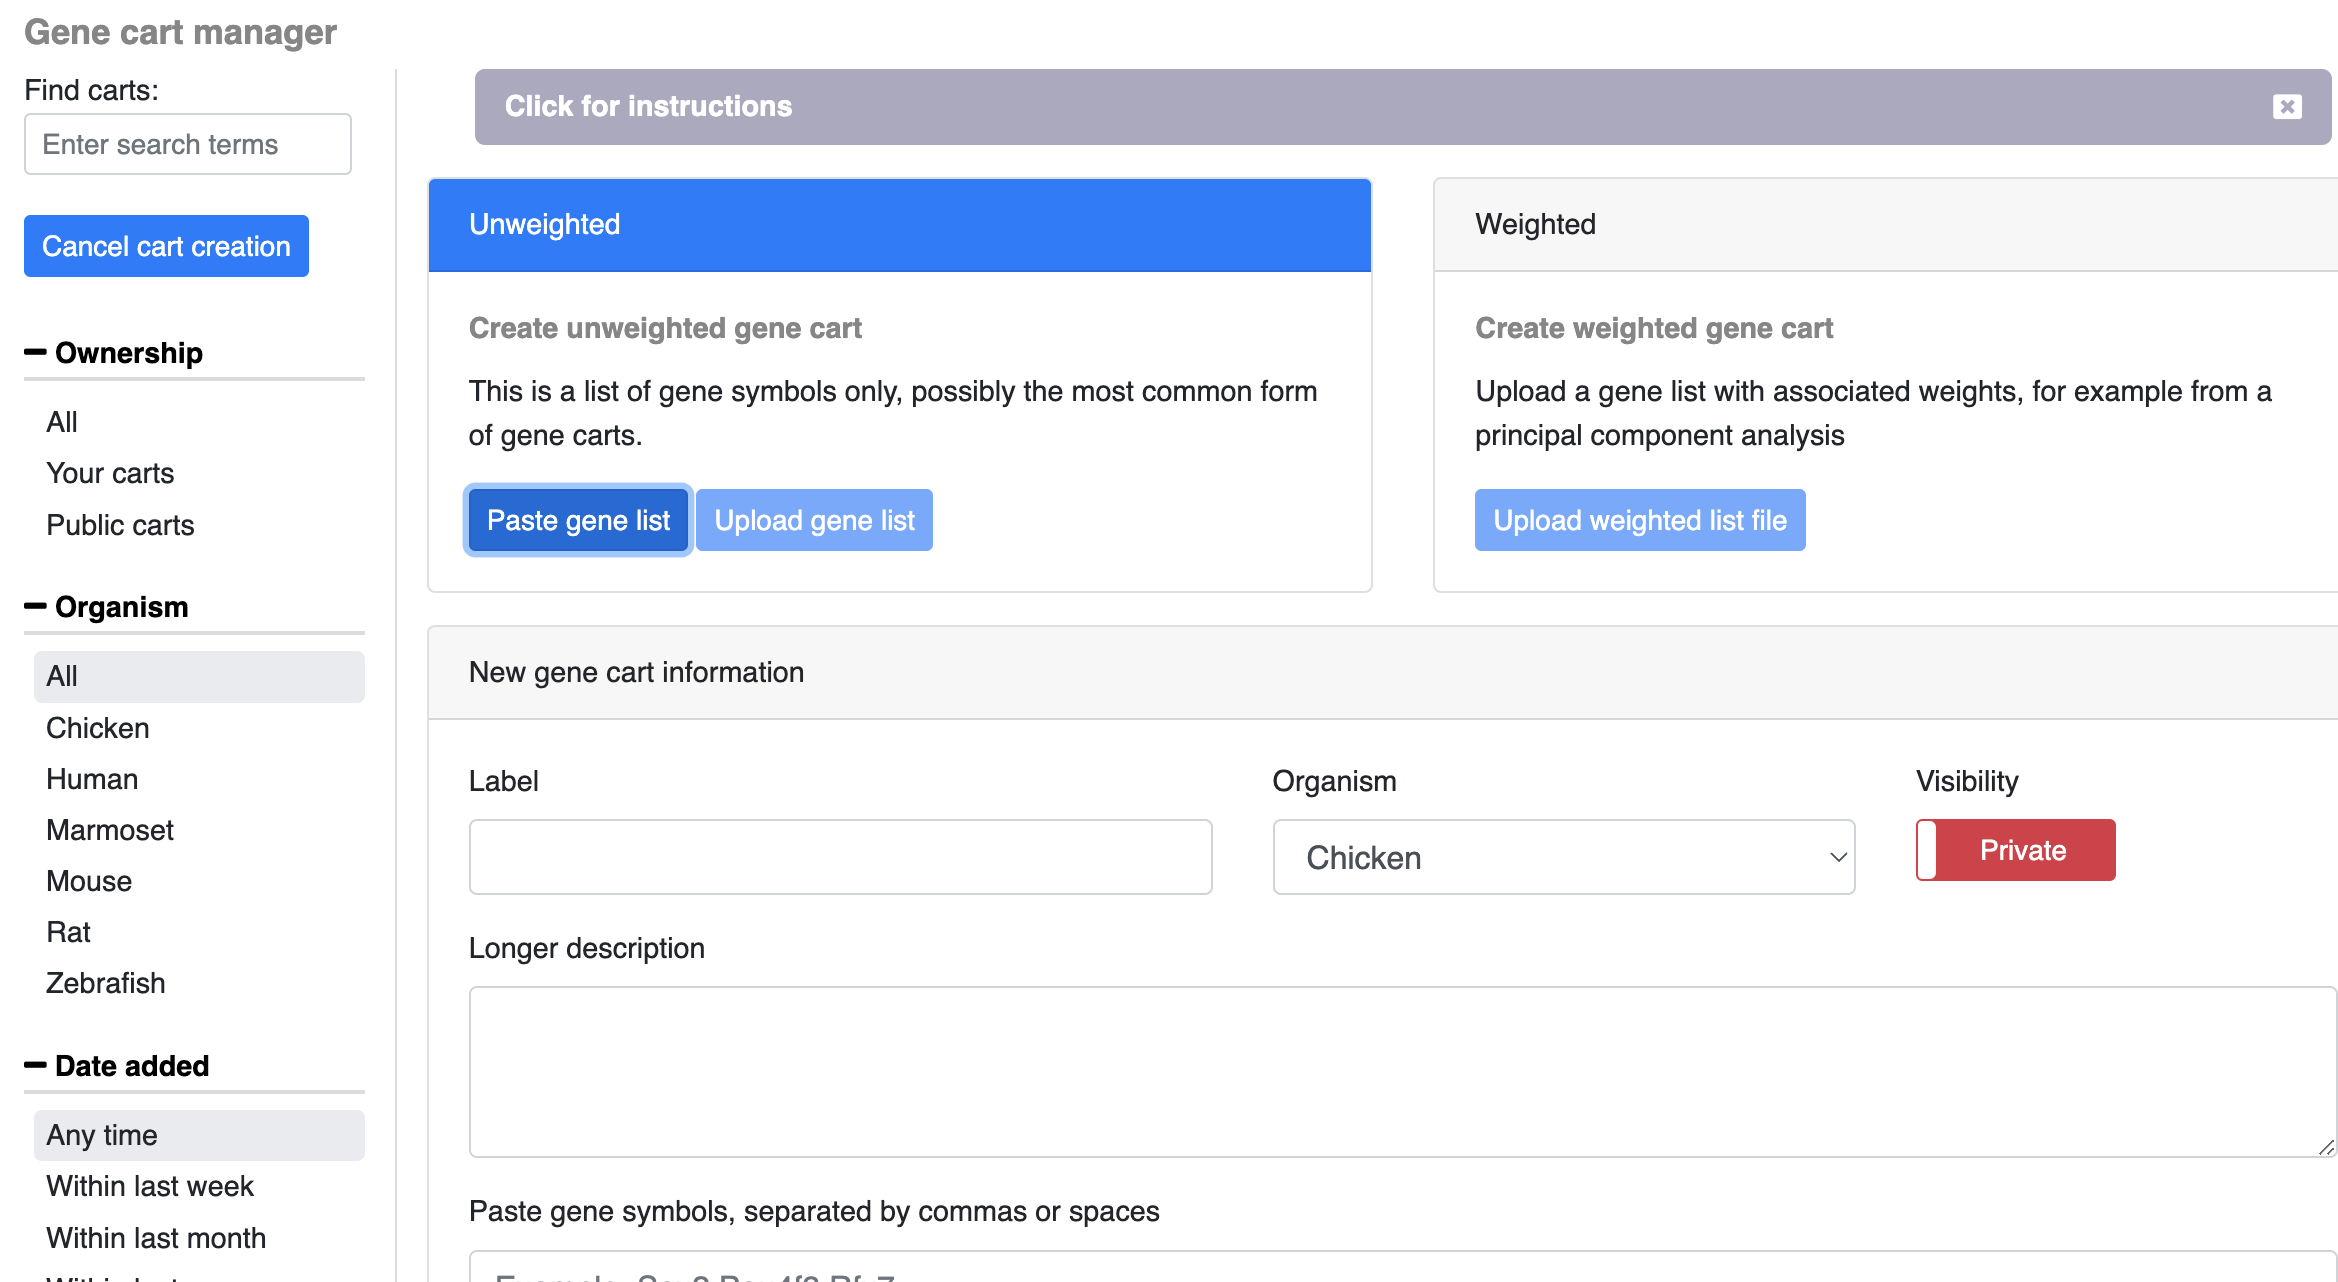
Manually/ via upload: Open the gene cart manager by clicking on your username in the top right of the page and selecting Gene Cart Manager. The Gene Cart Manager follows a similar layout as the dataset explorer where you can search for other public or private gene carts. To create a new cart, click on the create new cart button on the left side of the window. To upload from a file, choose the upload gene list option and select the file you wish to upload (file must be comma or space separated gene symbols). To add genes (either by copy/paste or manual entry, choose paste gene list. In addition to the genes you wish to add, give the list a name, description, and select the organism and privacy you wish for the cart (gene carts are private by default).
-
More information coming soon on weighted gene carts
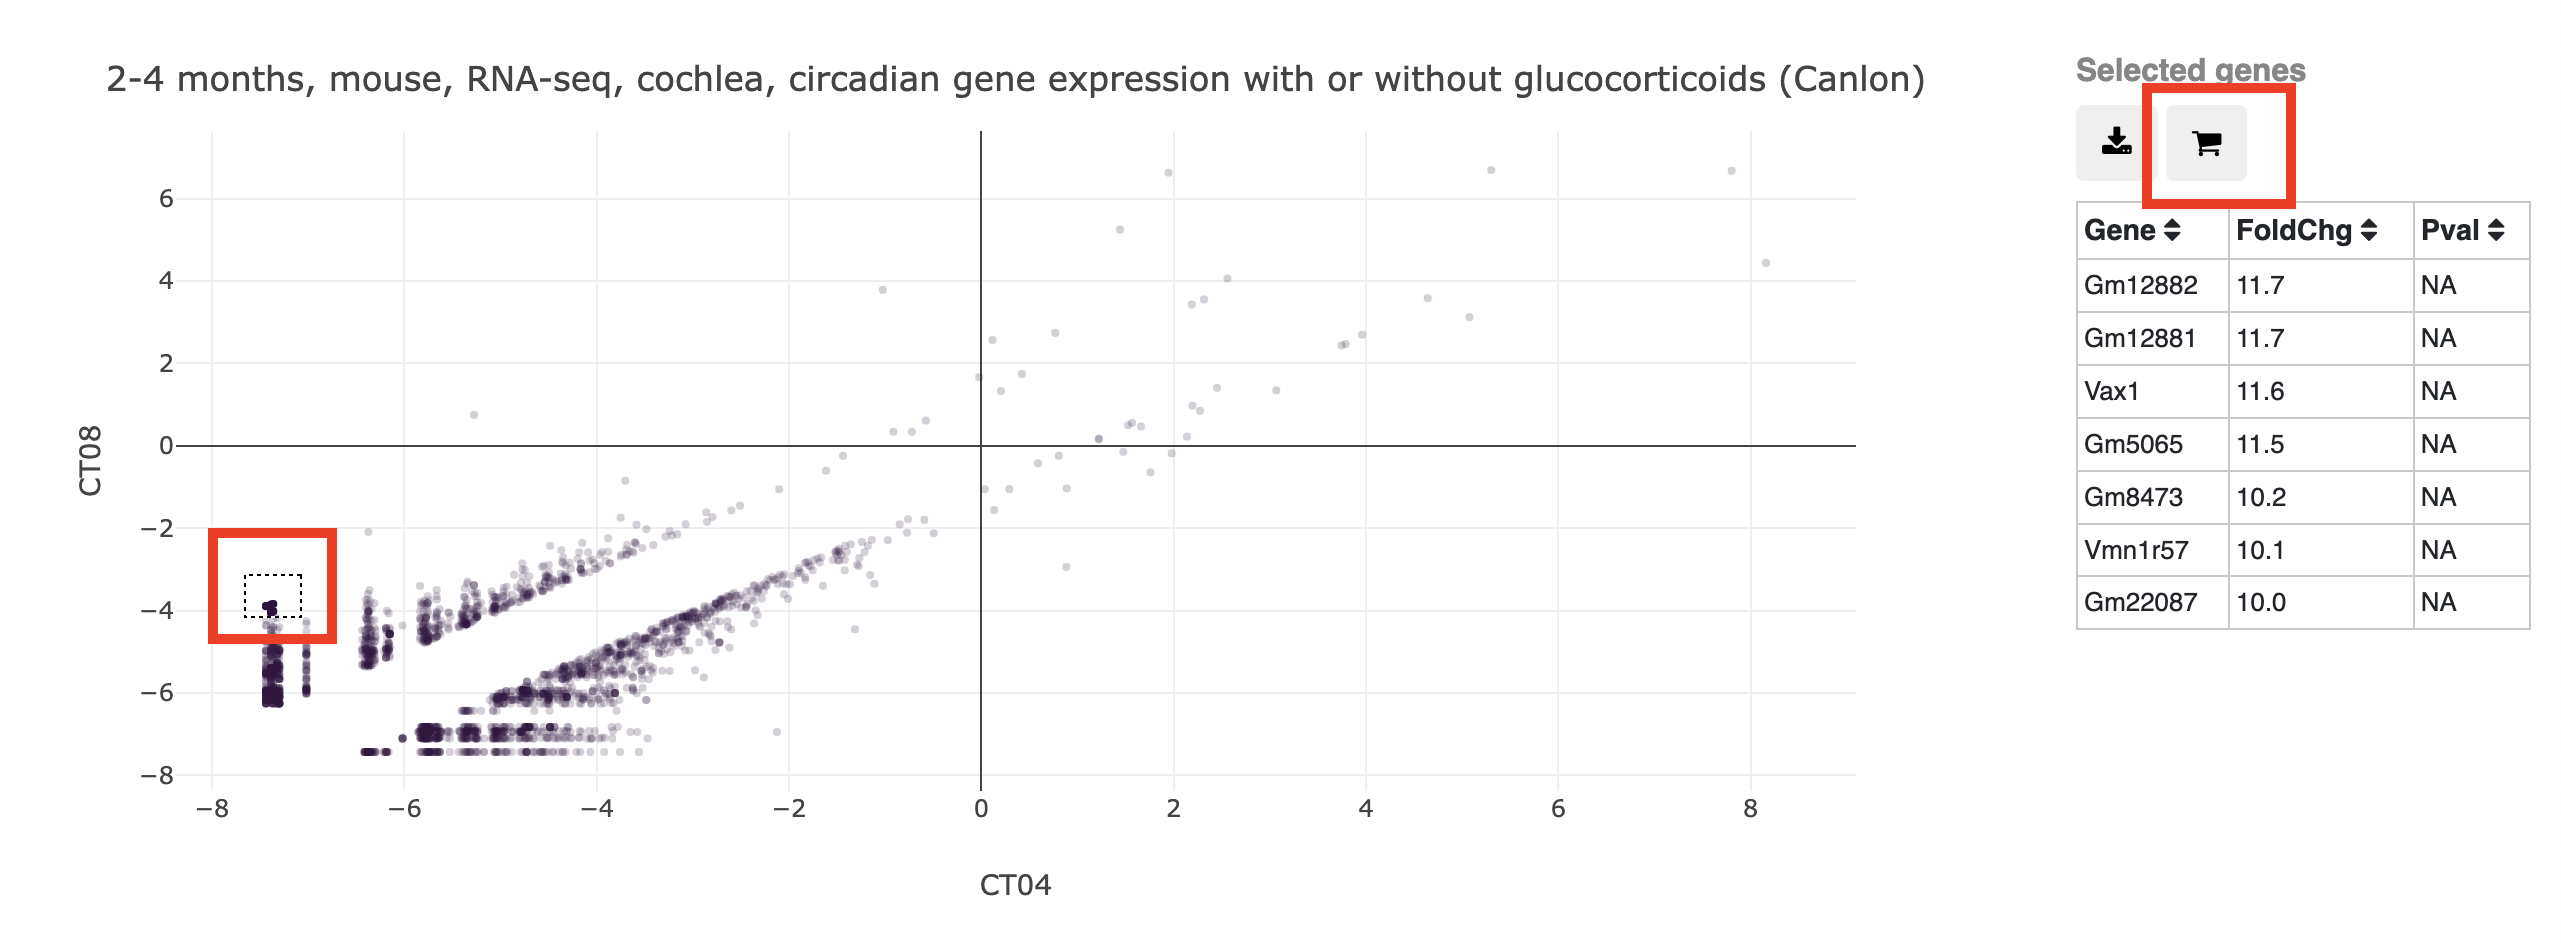
- From the RNAseq comparison tool:
In the RNAseq comparison tool, you can create a new gene cart containing your genes of interest directly from the plotting or statistical results. After making a plot, click and drag to select genes of interest (genes selected will show on the right side of the page). To download a text file listing all the genes use the download icon while the cart icon adds all the selected genes to a new gene cart which can be used elsewhere.
- Using created or public gene carts
Gene carts can be used in the multigene display and gene expression tools. To use in the multigene viewer (and create your own visualiations), choose the dataset you wish to view and then under step 3, use the dropdown menu next to 'load from gene cart' to add your genes.
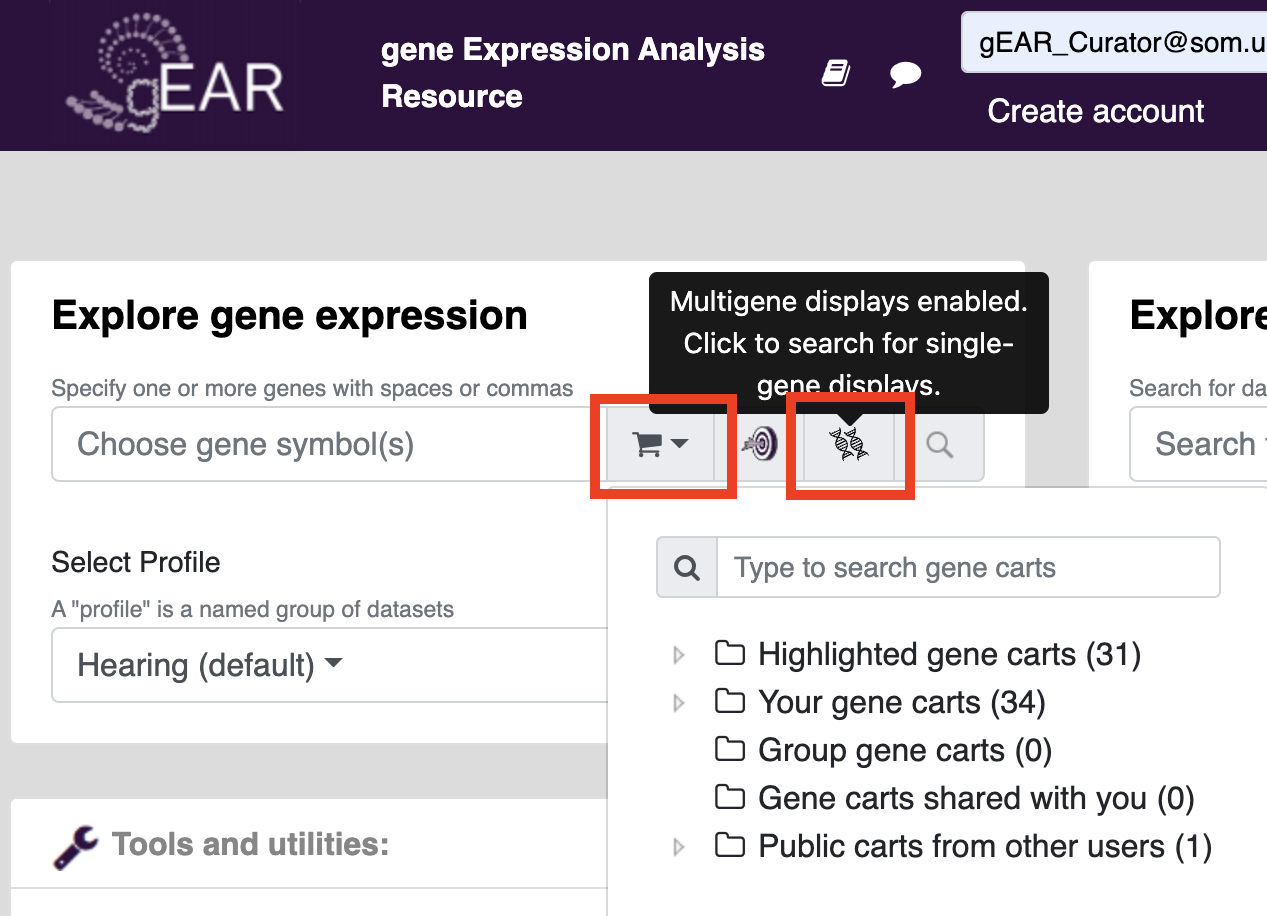
Gene carts can be used on already created visualizations using the gene expression tool on the homepage. First, click the strand of DNA to change the search type from single to multigene (icon is two DNA strands). The click on the cart to select what gene cart you would like to add. Press search to search for gene cart visualizations of your genes of interest (Note: not all profiles have multigene visualizations, the multigene viewer tool can be used to create new visualizations).
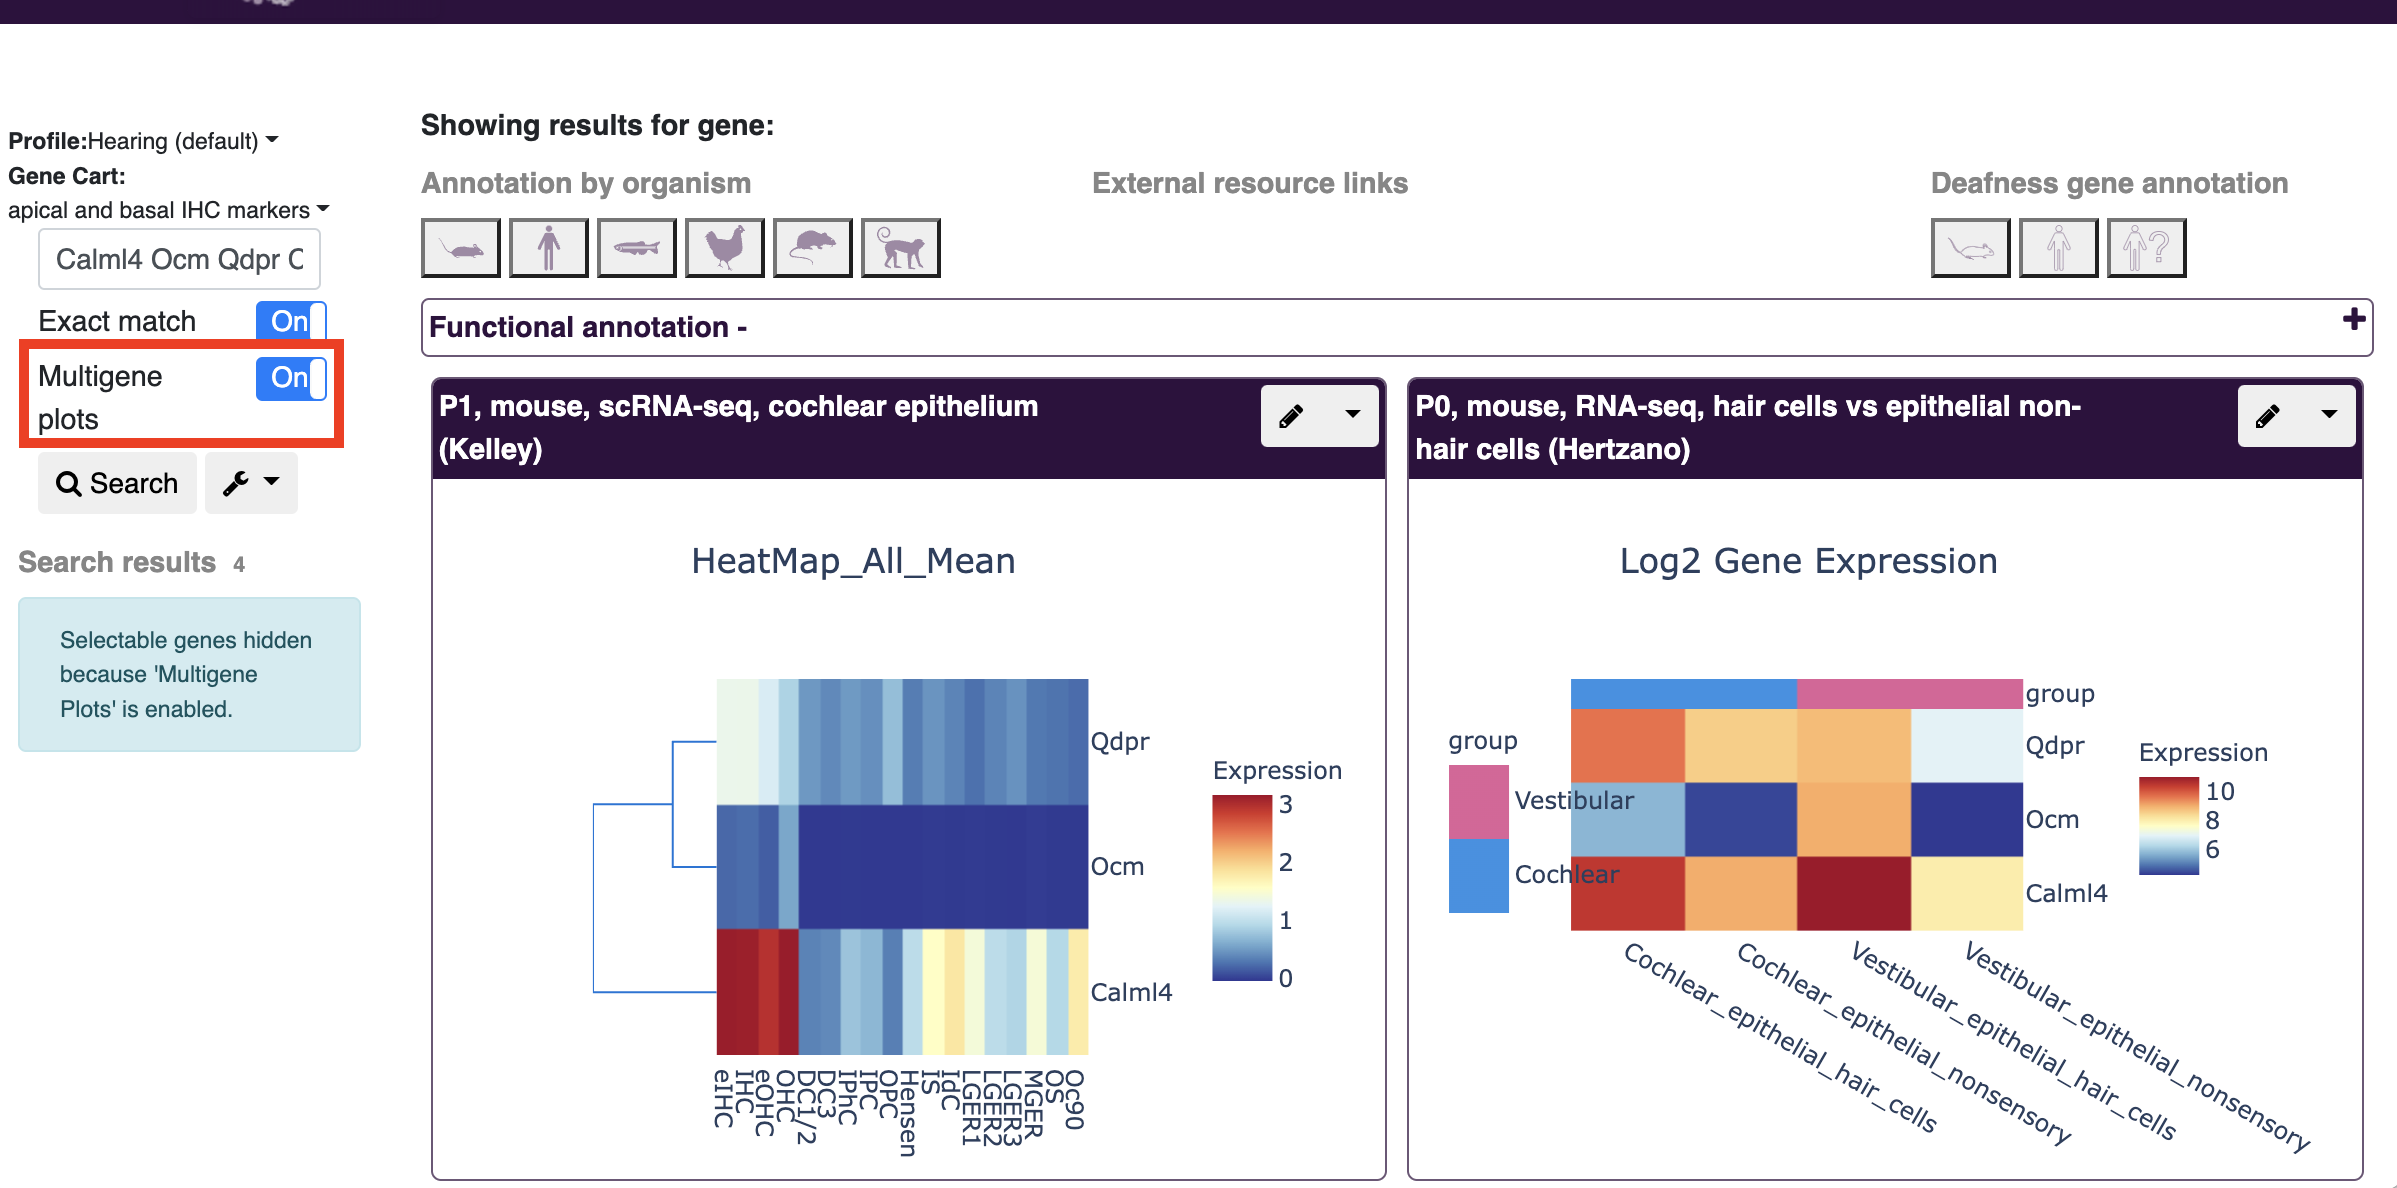
Multigene displays can also be toggled on the results page:
For more information on how to upload different types of data into gEAR, see our upload documentation. Currently gEAR supports the upload of:
- Bulk RNAseq data
- Single Cell sequencing data
- Microarray data
- Epigenetic data (Through integration with EpiViz)
The ability to create a variety of visualizations for the same dataset is one of the major strengths of the gEAR platform. In addition to the displays created by the initial uploader, if there are visualizations that are better suited to your question about a dataset you can quickly create new custom displays based on either your own analysis or primary analysis done by the uploader.
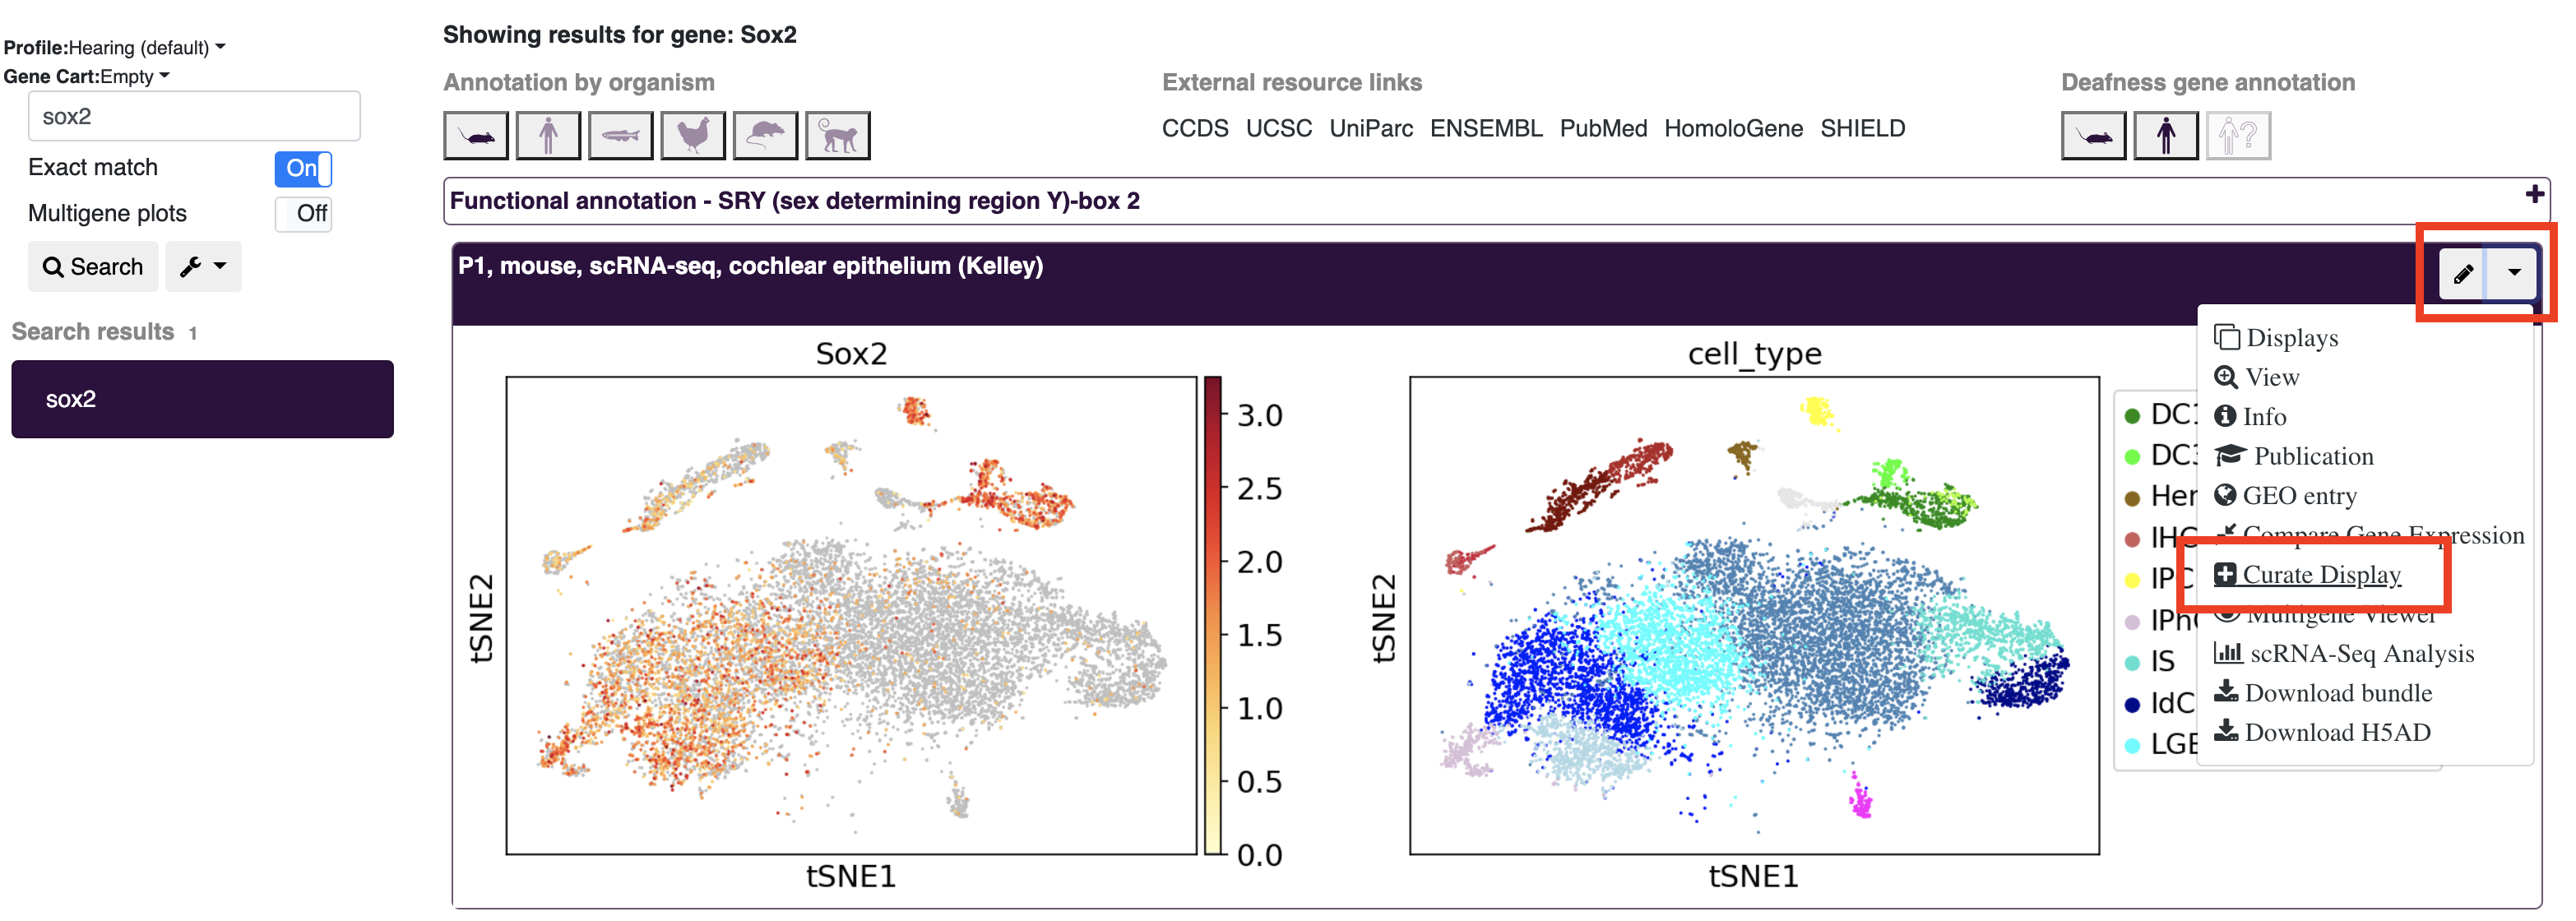
Besides for visualizations created in the multigene curator or analysis tools (see above), custom displays can be added to profiles. To open a dataset in the curation tool (the same tool you see following initial dataset upload), click the dropdown menu for the dataset you wish to make a new display for and choose the curate display option (If you are searching in the dataset explorer, you will need to select the particular dataset you wish to use with the eye icon first).
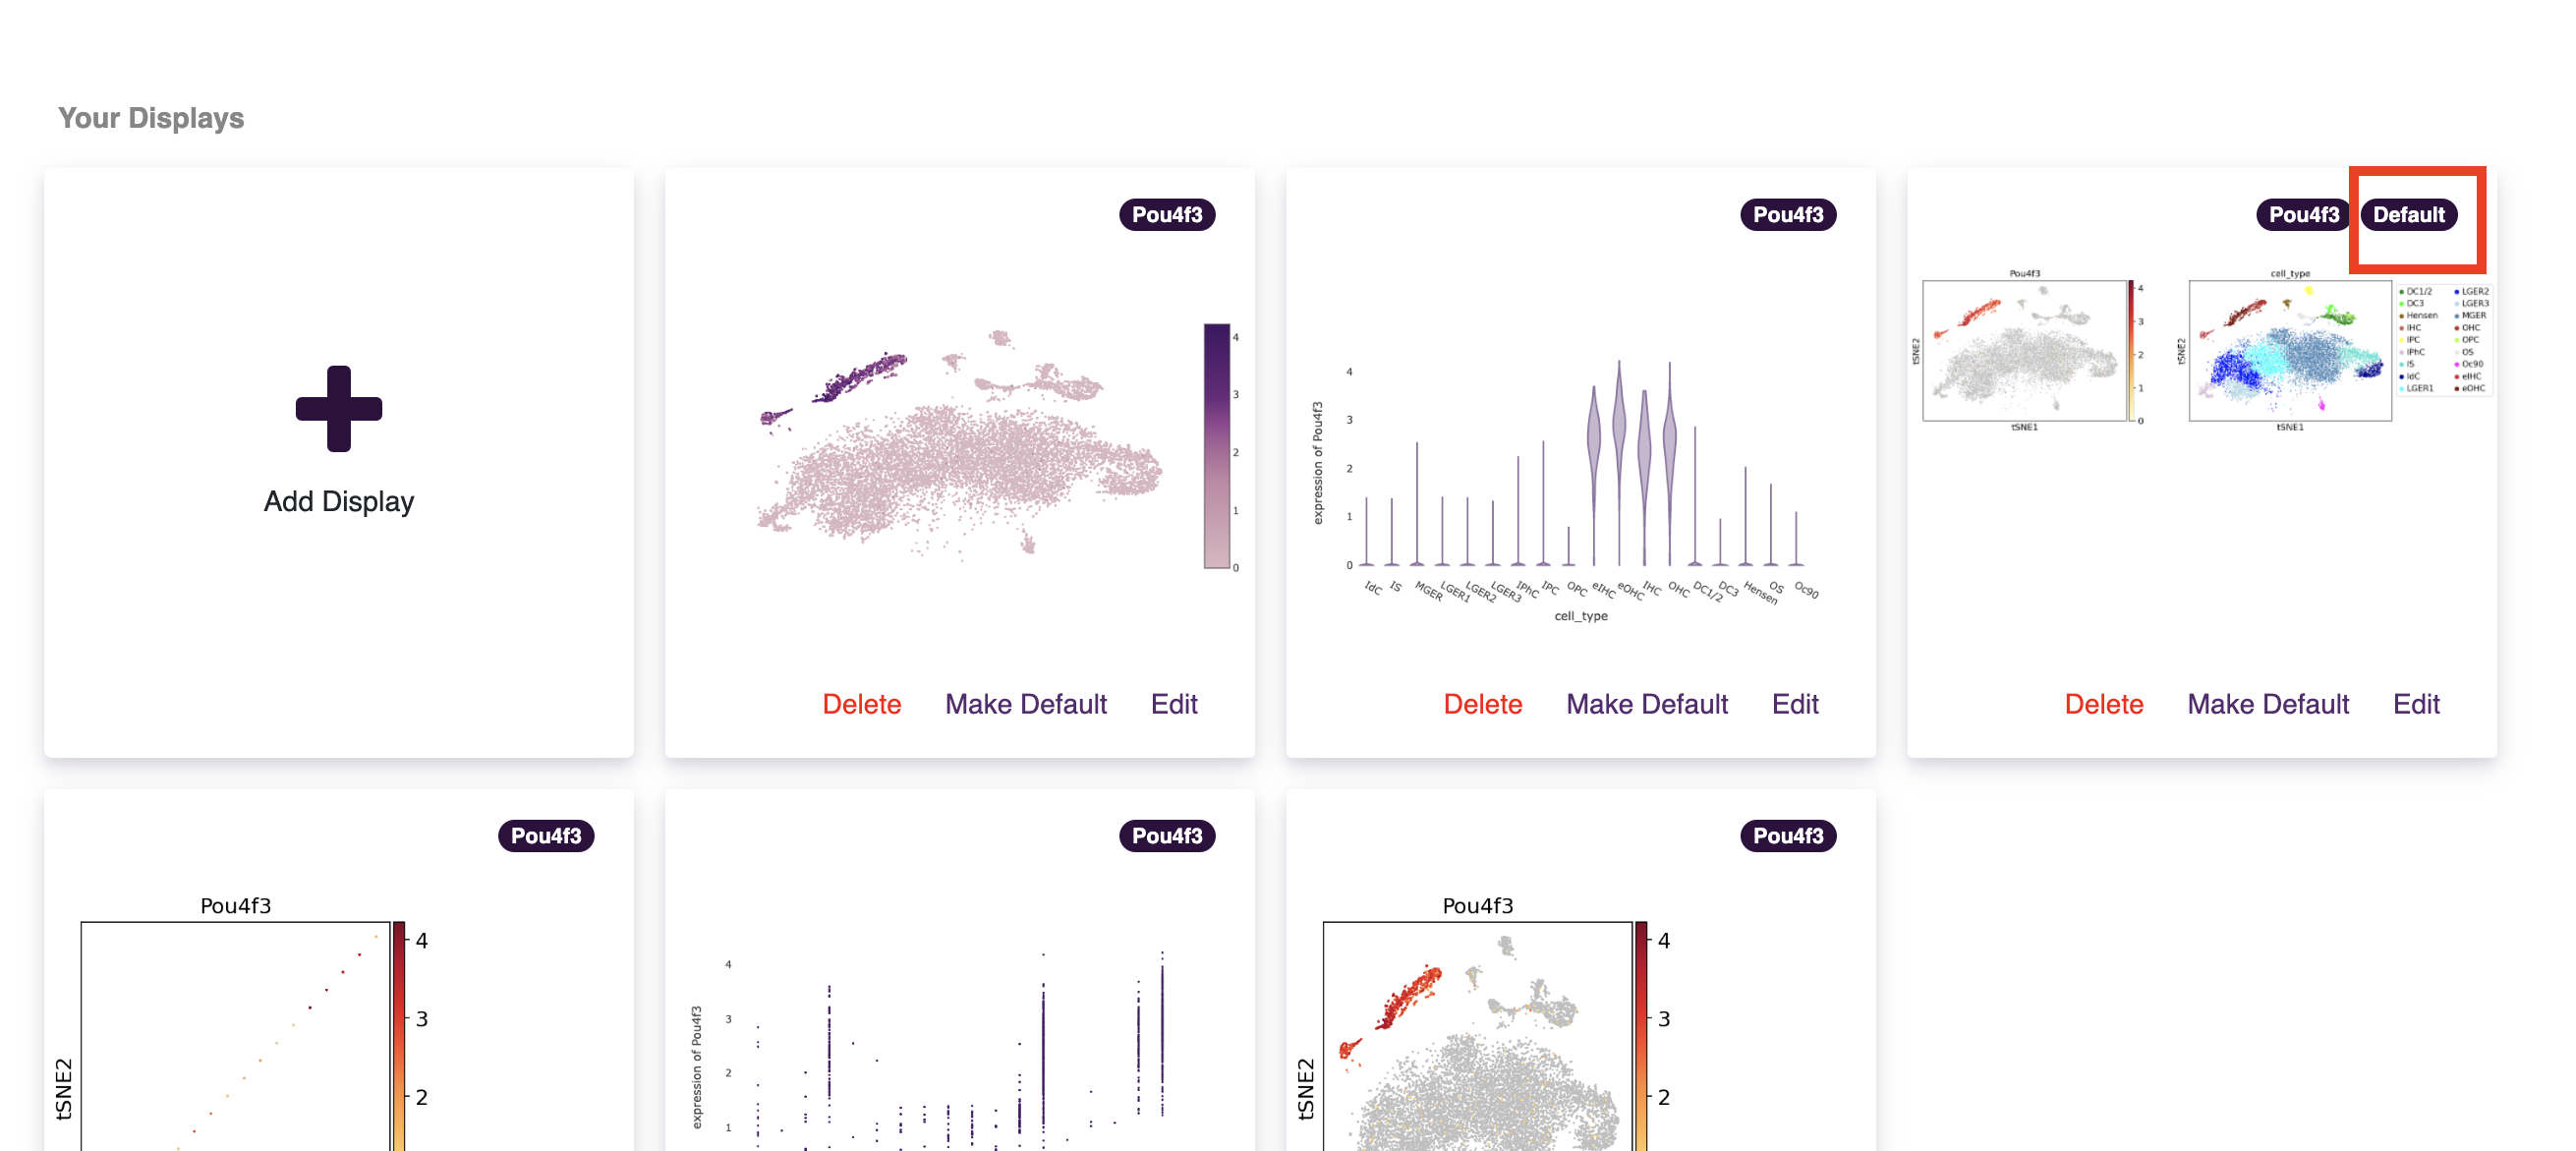
In the curation display window, you will see all the displays that are public or owned/shared with you. The current default view will be denoted by a default tag in the corner of the plot image. To create a new display click the add display box.
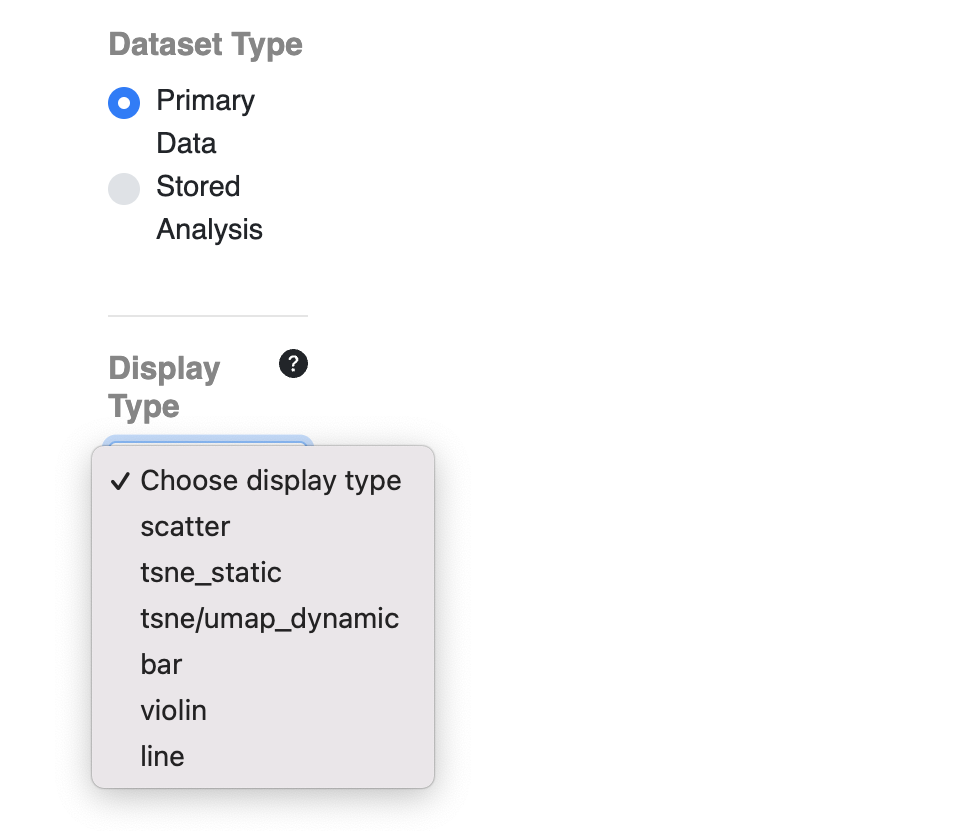
Choosing add display will open a new window which will have two choices for Dataset Type (Primary Data and Stored Analysis). Primary Data allows for plotting of data directly from the information uploaded (i.e. UMAP/tSNE coordinates or counts provided by the uploading individual). Choosing stored analysis allows for plotting from data that has been processed from the raw data in some way. Depending on the dataset, this could be an analysis uploaded by the dataset authors or a saved analysis you have conducted in one of the analysis tools (e.g. single cell workbench). Note: not all datasets will have a stored analysis (but you can create one).
After selecting the data source, the next step is to select the type of display you wish to create. Some choices may not be available depending on observations in the particular dataset you are interested in.
After adding the plot option you wish and a name for the plot, selecting create plot will bring you back to the display selection screen where you can choose what plot to make as the default for that dataset.
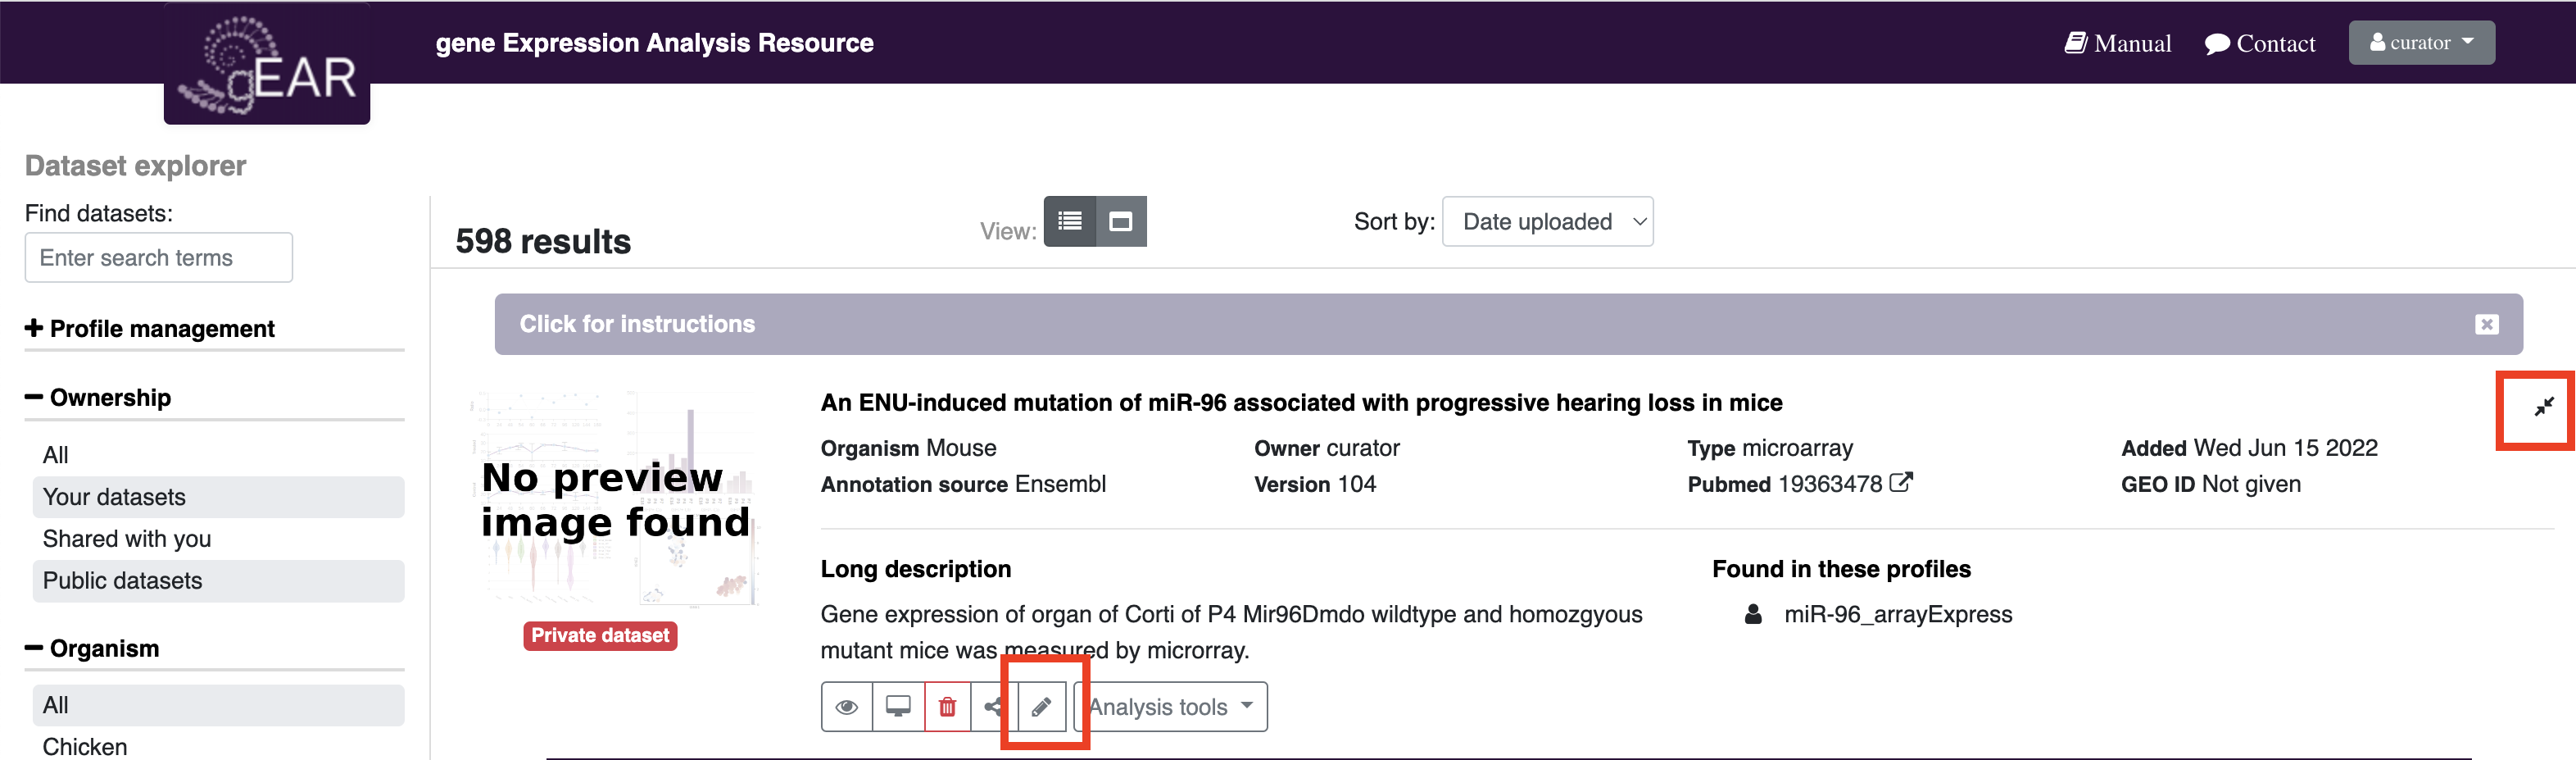
The dataset information shown in the dataset explore can be edited by the dataset's owner following upload. To edit, click the expand button in the dataset explore then the pencil icon. On this page you can edit the dataset title, description, as well as add a Pubmed or GEO id. Note: Special characters cannot be used in the dataset title or descriptions.
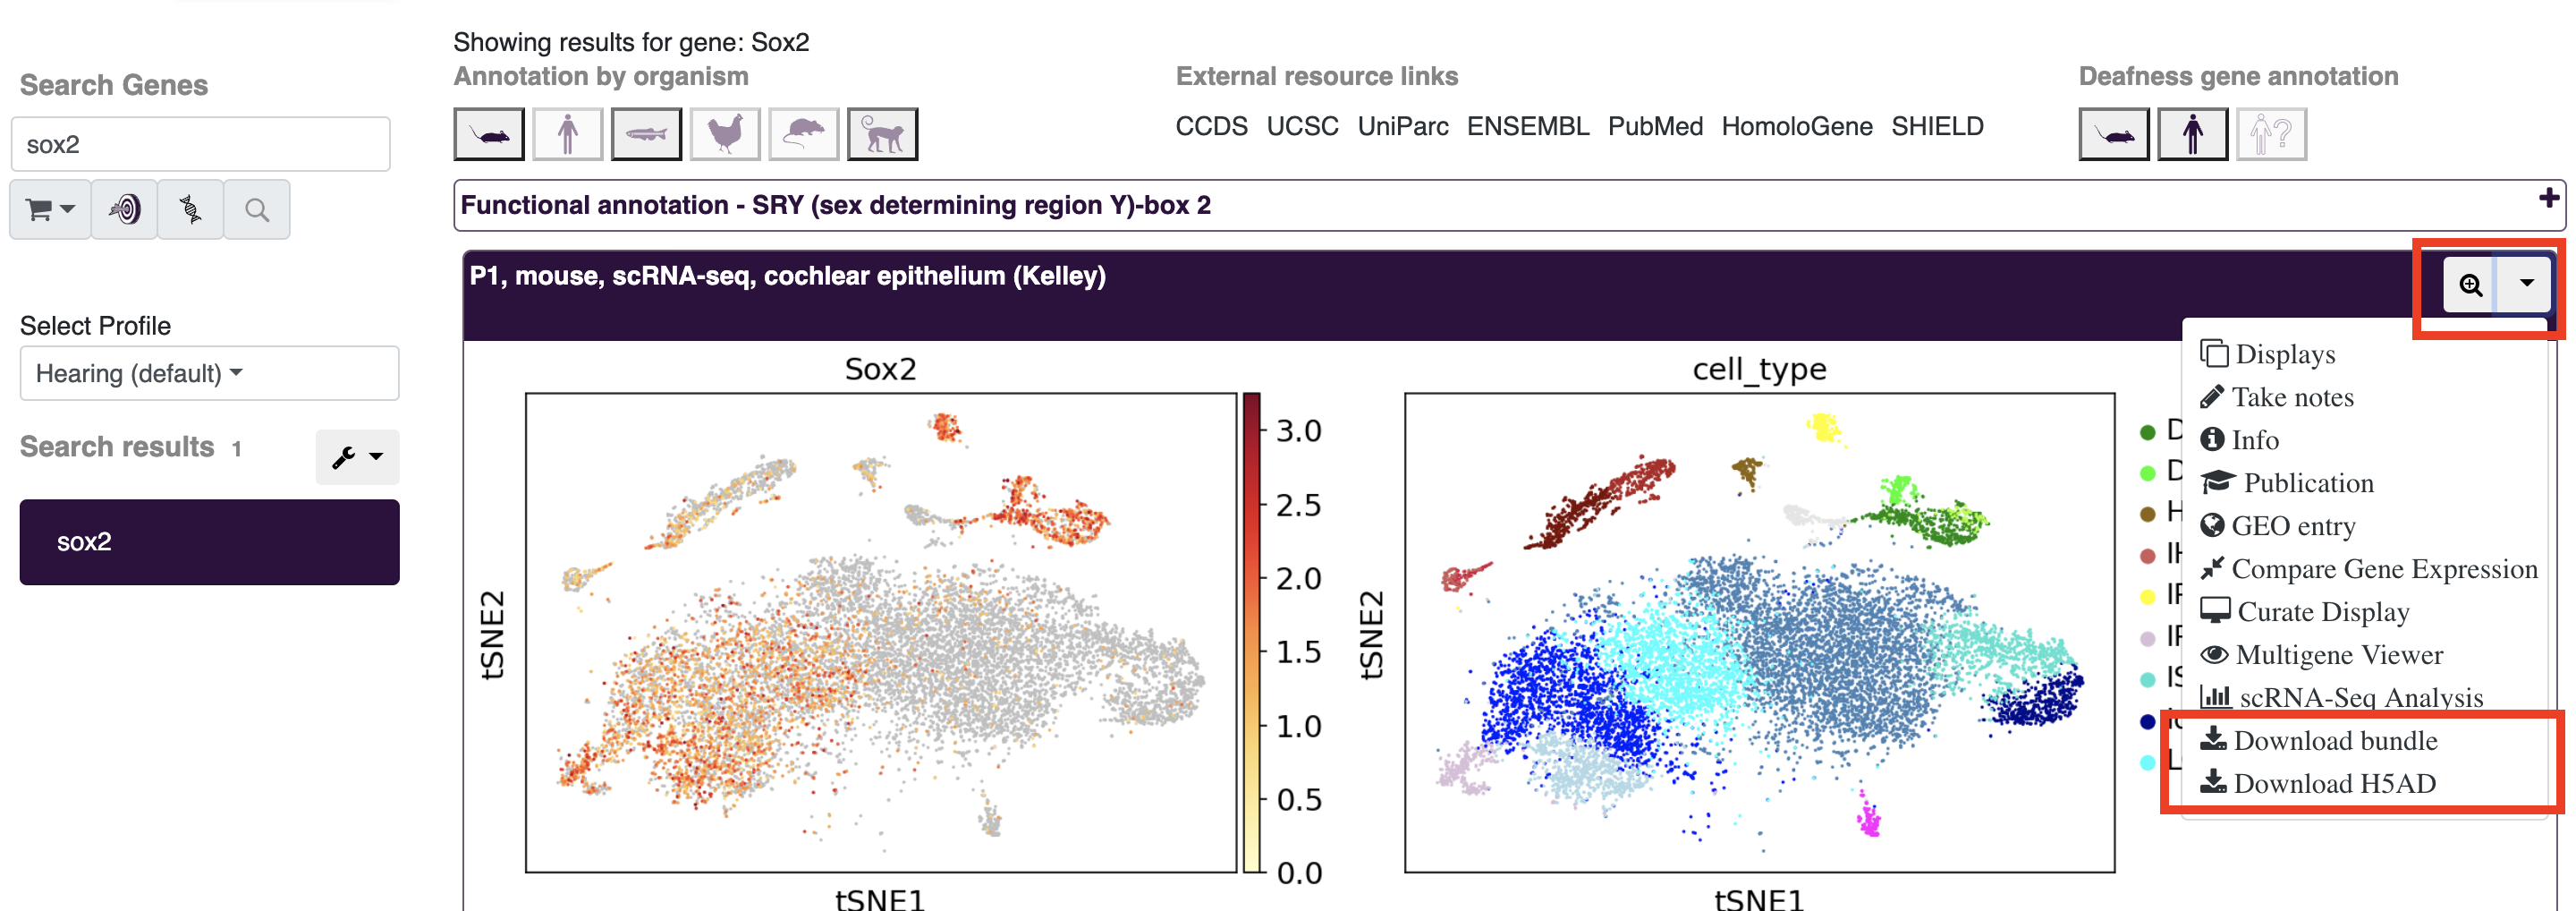
Public data in the gEAR platform can be downloaded in two ways:
- As a bundled file, containing the data files exactly as they were uploaded by the dataset owner. For more information on data formats used during upload, see our upload documentation (Link)
- Via a formatted h5AD file, where each dataset upload is converted into an identical format. For more information on the h5AD file format see (Link)
To download a dataset, search a gene in the public profile of interest then use the dropdown menu to select which download option you prefer.