Plot a Block Graph
IBEX provides a quick, easy way to plot a graph of a block or PV as a function of time (i.e. a "strip-chart").
To plot a graph of a block:
- Enable Log Plotter perspective in Preferences -> Select visible perspectives
- Select
Log Plotterfrom theView Selector(see Views). - If you have not previously plotted a block, IBEX displays an empty view, prompting you to select a block. If you have already plotted a block, IBEX restores the graph.
- To plot a block, simply right-click on a block displayed in the Blocks & Groups view at the top of the IBEX window.
- Right-clicking displays a pop-up menu and choose
Display block historyfrom the menu. Here you can either add the trace for this block to an existing plot, or create a new, separate plot. - IBEX displays a graph of the selected block as a function of time.
The graph axes will automatically adjust to the range of values that the selected block has experienced. The graph axes are labelled with the name of the underlying PV (remember, blocks are aliases to PVs).
You can choose a PV to be plotted from any OPI, in the same way as choosing a block. Simply right-click on the PV and select Process Variable > Log Plotter from the menu.
Currently the runstate is not easily plottable from a context menu but you can add it manually to a plot. You can do this by right clicking on a plot and selecting Add PV then enter under name IN:%INST%:DAE:RUNSTATE.VAL, replacing %INST% with the name of your instrument (e.g. IN:IMAT:DAE:RUNSTATE.VAL. This will then show the runstate on the graph with the following values:
- SETUP
- RUNNING
- PAUSED
- WAITING
Higher numbers are transitional states, beginning etc.
Along the top of the graph are a series of buttons which allow you to adjust the appearance of the graph.
Right clicking on the y-axis allows you to quickly toggle settings such as auto-scale and grid lines, or to edit the axis name and range.
For more advanced adjustments, you can right-click and select 'Open Properties Panel' which will open a panel to the right of the graph (by default), which give you more granular control of the appearance of your graph or plot.
The 'When archived data arrives, perform stagger' option under 'Value Axis', when selected, will re-scale and stagger the graph whenever it fetches archived data, for example when adding another block to the graph or increasing the time window.
The log plotter allows you to display multiple traces on the same value axis so they scale together. The way to do this is as follows:
- Right click on the graph and select
Open Properties Panel - In the
Tracestab, find the column titledAxis - In the row of any trace, click the axis entry, then select the axis of the trace you want to add it to from the drop-down list.
- They will now be displayed along the same value axis.
As of Release Version 5.5, you can right click on the block you want to add and select the option to add to an existing axis.
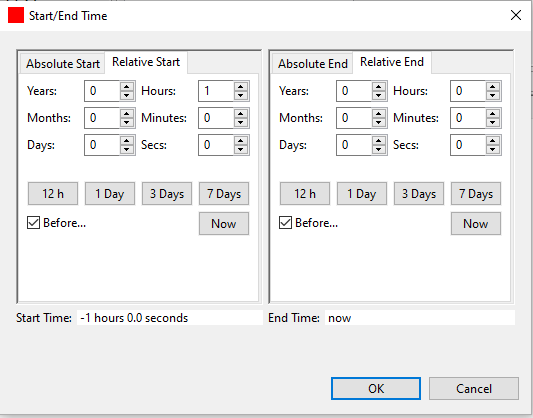
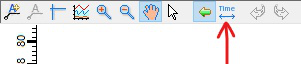
The time axis can be manipulated to adjust its start and end time using the Time option. This option could be found under the plotted PVs tab.
The following pop-up window will show up once the Time option is chosen.