- What is this?
- Setup
- Supported environment
- Supported mode
- Added / improved features
- Qemu-system cooperation - General
- Qemu-system cooperation - Arch specific
- Qemu-system cooperation - Linux specific - Basic
- Qemu-system cooperation - Linux specific - Symbol
- Qemu-system cooperation - Linux specific - Allocator
- Qemu-system cooperation - Linux specific - Advanced
- Qemu-system cooperation - Linux specific - Other
- Qemu-user cooperation
- Heap dump features
- Improved features
- Added features
- Other
- FAQ
This is a fork of GEF. However, there are two major improvements.
- Added many heuristic commands for kernel debugging WITHOUT symboled vmlinux (for qemu-system; linux kernel 3.x ~ 6.7.x).
- Added support for many architectures (for qemu-user).
Many other commands have been added and improved. Enjoy!
# Run with root user (sudo is NOT recommended, since considering debian)
wget -q https://raw.githubusercontent.com/bata24/gef/dev/install.sh -O- | sh
GEF (.gdbinit-gef.py) is installed under /root to simplify the installation script.
If you want to change the location, please modify accordingly.
# Ubuntu 23.04 restricts global installation with pip3, so you need --break-system-packages option.
wget -q https://raw.githubusercontent.com/bata24/gef/dev/install.sh -O- | sed -e 's/\(pip3 install\)/\1 --break-system-packages/g' | shpython3 /root/.gdbinit-gef.py --upgraderm -f /root/.gdbinit-gef.py /root/.gef.rc
sed -i -e '/source \/root\/.gdbinit-gef.py/d' /root/.gdbinitSee install.sh or install-minimal.sh.
- Tested on ubuntu 23.10.
- It may work under ubuntu 20.04, 22.04, 23.04, debian 10.x or after.
- Normal debugging (start under
gdb) - Attach to the process
- Attach to the process in another pid namespace (e.g., attaching from outside
docker) - Connect to
gdbserver - Connect to the gdb stub of
qemu-system(via localhost:1234 etc.) - Connect to the gdb stub of
qemu-user(via localhost:1234 etc.) - Connect to the gdb stub of
Intel Pin(via localhost:1234 etc.) - Connect to the gdb stub of
Intel SDE(via localhost:1234 etc.) - Connect to the gdb stub of
qiling framework(via localhost:1234 etc.) - Connect to the gdb stub of
KGDB(over the serial; currently, only gdb 12.x~ is supported) - Connect to the gdb stub of
VMWare(via ipaddr:port) - Record and replay debugging (start under
rr replay)
See docs/SUPPORTED-MODE.md for detail.
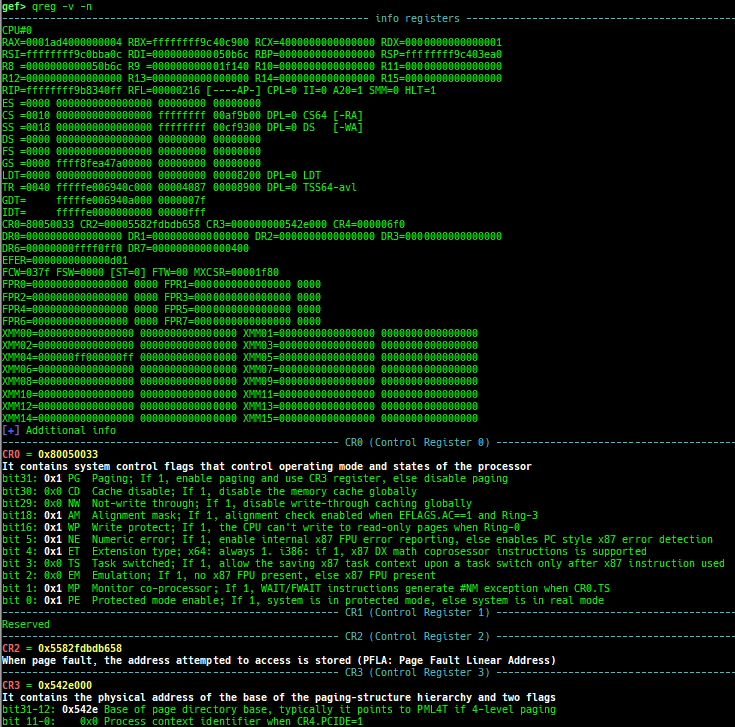
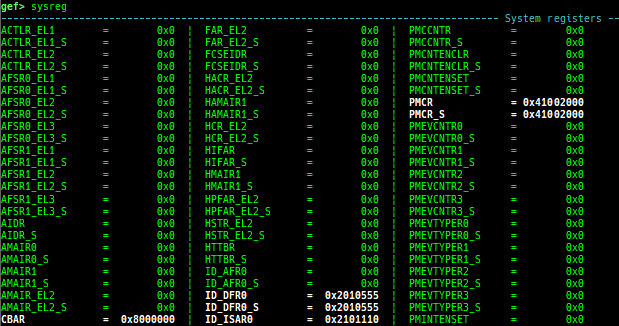
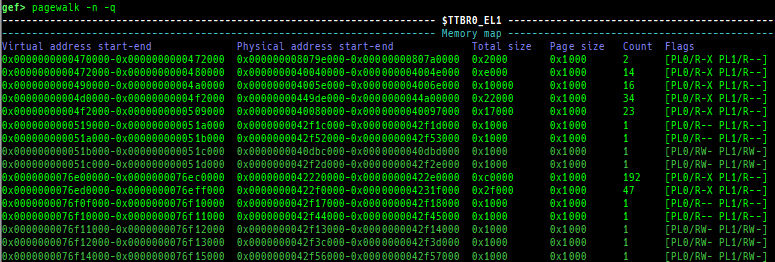
qreg: displays the register values from qemu-monitor (allows to get like$cseven under qemu 2.x).sysreg: pretty prints system registers.pagewalk: displays the page table from scanning physical memory.- x64 (Supported: 4-Level/5-Level Paging)
- x86 (Supported: PAE/Non-PAE)
- ARM64 (Supported: EL1&0-stage1/EL1&0-stage2/EL2&0-stage1/EL2-stage1/EL3-stage1)
- ARM v8.7 base. 32bit mode is NOT supported.
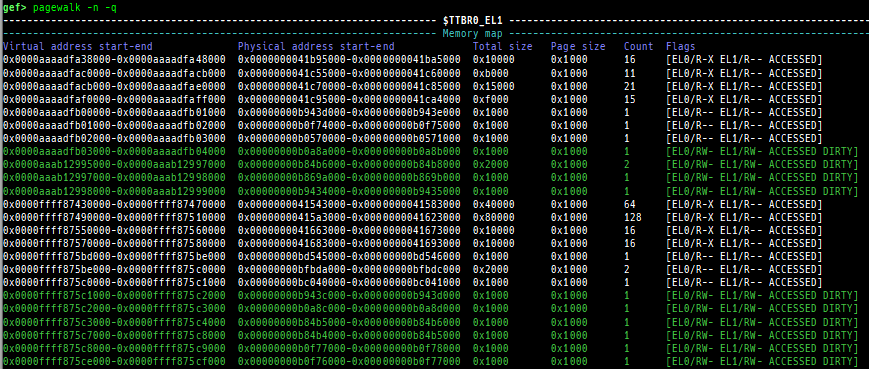
- Each level pagewalk sample from HITCON CTF 2018
super_hexagon. Parsing of stage2 translation table (VTTBR_EL2) is also supported. 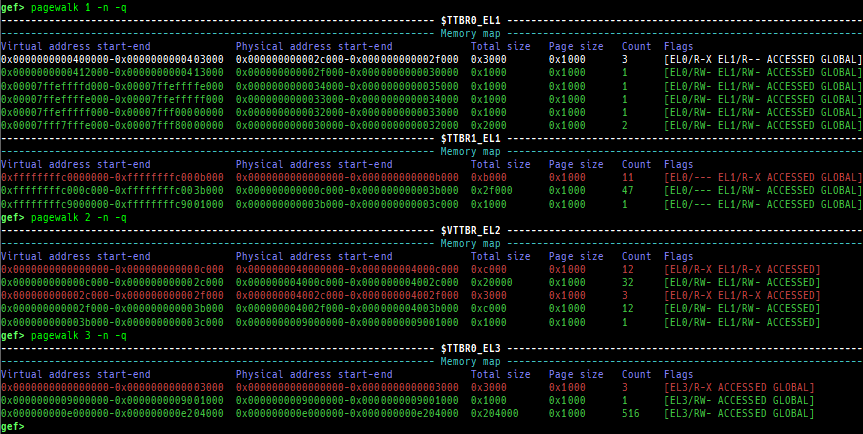
- Secure memory scanning is supported, but you have to break in the secure world.

- Pseudo page tables without detailed flags and permission can be output even in the normal world (when uses OP-TEE).

- ARM (only Cortex-A, LPAE/Non-LPAE, PL0/PL1)
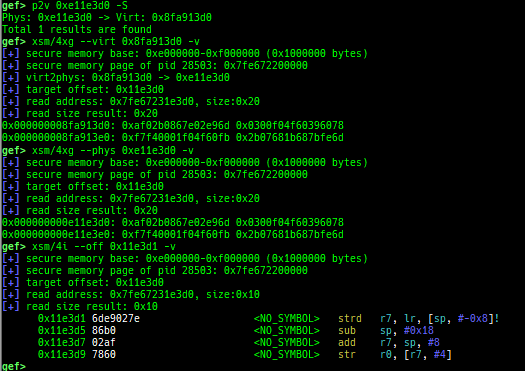
v2p/p2v: displays transformation virtual address <-> physical address.xp: is a shortcut for physical memory dump.qemu-device-info: dumps device information for qemu-escape (WIP).
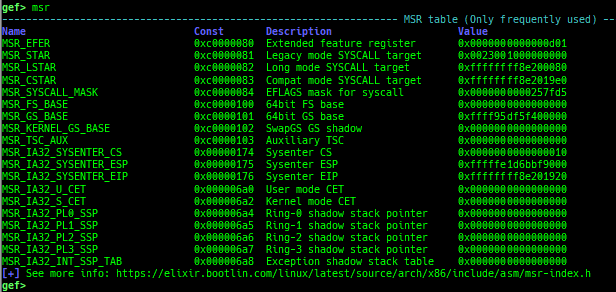
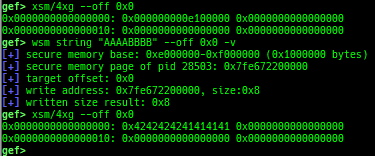
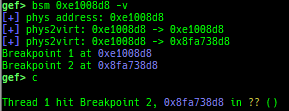
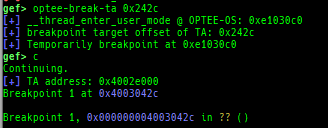
msr: displays MSR (Model Specific Registers) values by embedding/executing dynamic assembly.uefi-ovmf-info: dumps addresses of some important structures in each boot phase of UEFI when OVMF is used.xsm: dumps secure memory when gdb is in normal world.wsm: writes the value to secure memory when gdb is in normal world.bsm: sets the breakpoint to secure memory when gdb is in normal world.optee-break-ta: sets the breakpoint to the offset of OPTEE-Trusted-App when gdb is in normal world.pac-keys: pretty prints ARM64 PAC keys.
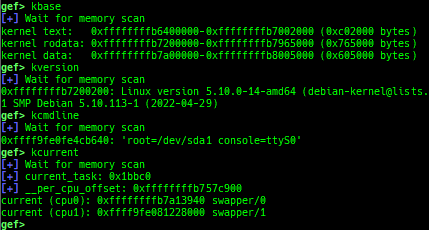
kbase: displays the kernel base address.kversion: displays the debugged kernel version.kcmdline: displays the debugged kernel startup cmdline.kcurrent: displays current task address.
ksymaddr-remote: displays kallsyms information from scanning kernel memory.ksymaddr-remote-apply/vmlinux-to-elf-apply: applies kallsyms information obtained byksymaddr-remoteorvmlinux-to-elfto gdb.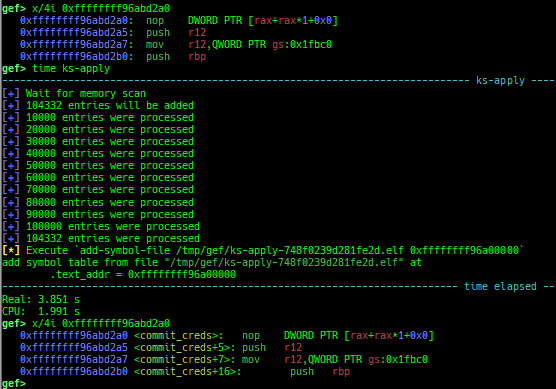
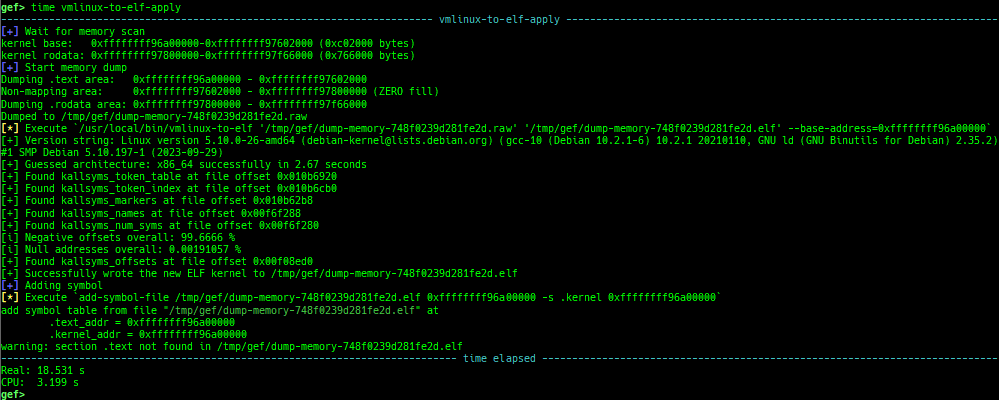
- Once you get symboled pseudo ELF file, you can reuse and apply it automatically even after rebooting qemu-system.
vmlinux-to-elf-applyandksymaddr-remote-applyprovide almost the same functionality.vmlinux-to-elf-apply: Requires installation of external tools. Createvmlinuxwith symbols.ksymaddr-remote-apply: Requires no external tools. Create an blank ELF with only embedded symbols.
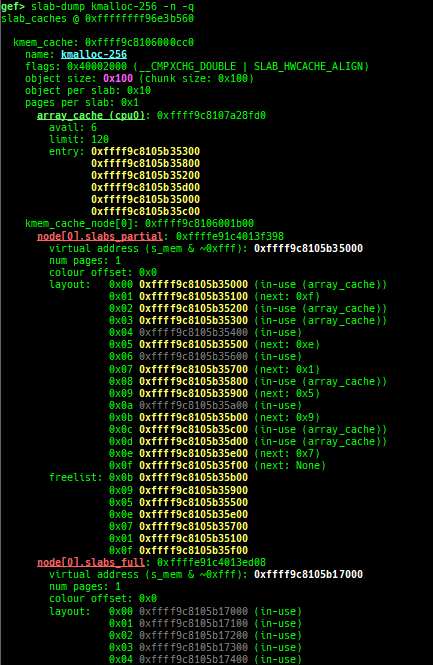
slub-dump: dumps slub free-list.- Supported on x64/x86/ARM64/ARM + SLUB + no-symbol + kASLR.
- Supported on both
CONFIG_SLAB_FREELIST_HARDENEDisyorn. - It supports to dump partial pages (
-v) and NUMA node pages (-vv). - Since
page_to_virtis difficult to implement, it will heuristically determine the virtual address from the freelist. 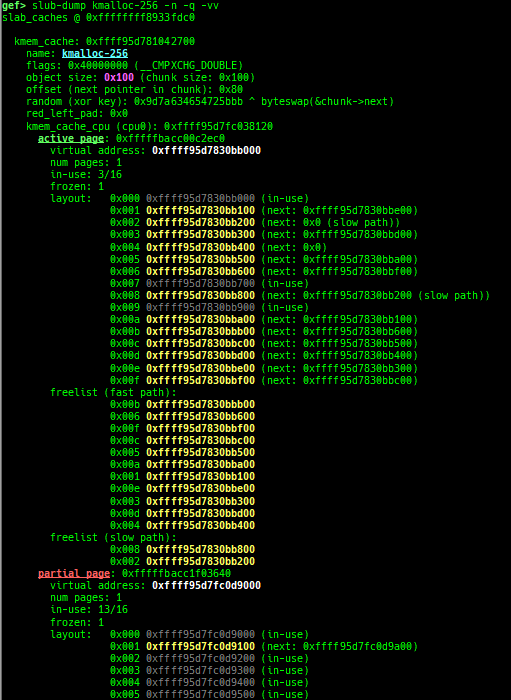
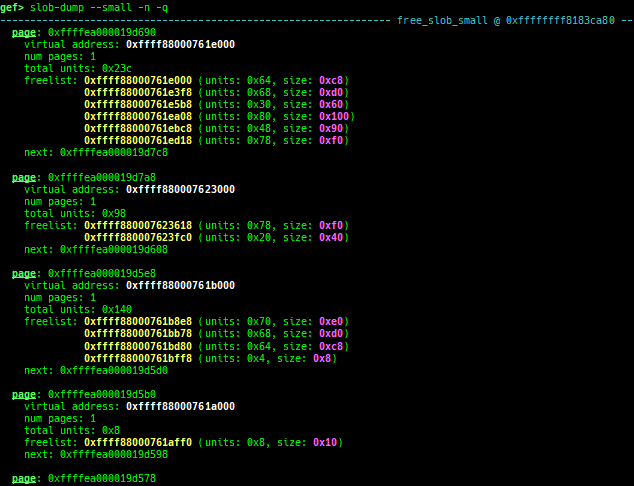
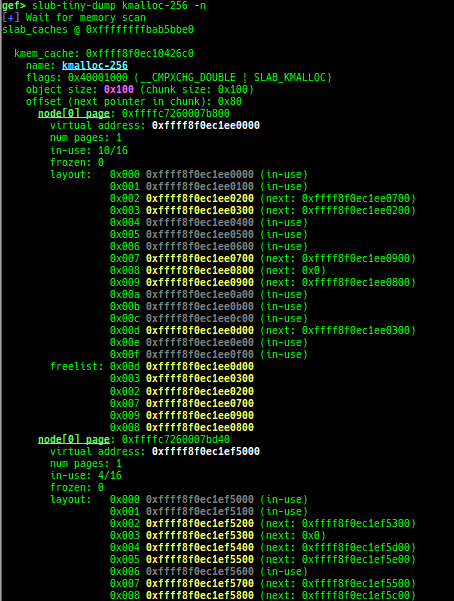
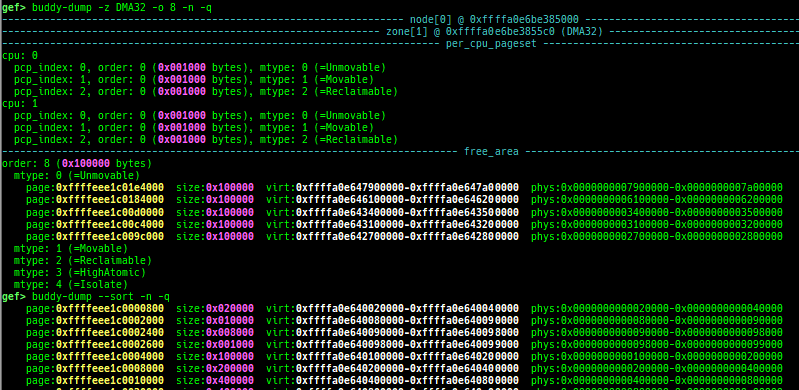
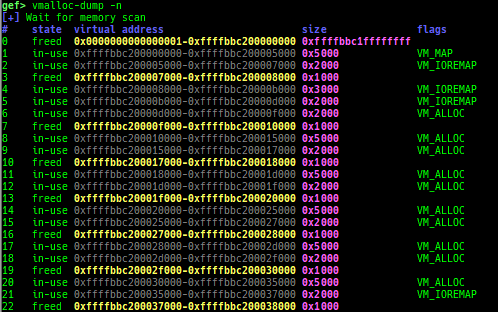
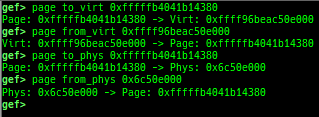
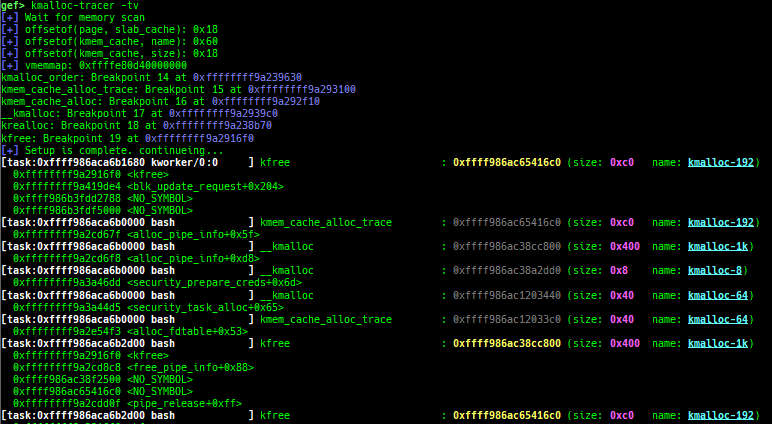
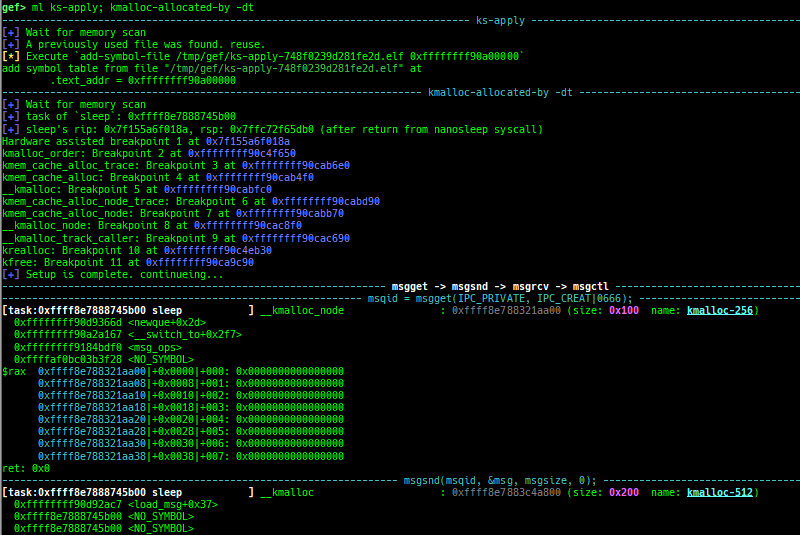
slab-dump: dumps slab free-list.slob-dump: dumps slob free-list.slub-tiny-dump: dumps slub-tiny free-list.slab-contains: resolves whichkmem_cachecertain address (object) belongs to (for SLUB/SLUB-TINY/SLAB).buddy-dump: dumps zone of page allocator (buddy allocator) freelist.vmalloc-dump: dumps vmalloc used list and freed list.page: displays transformation struct page <-> virtual/physical address.kmalloc-tracer: collects and displays information when kmalloc/kfree.kmalloc-allocated-by: calls a predefined set of system calls and prints structures allocated by kmalloc or freed by kfree.
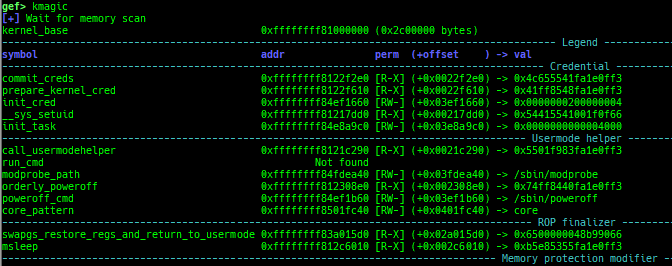
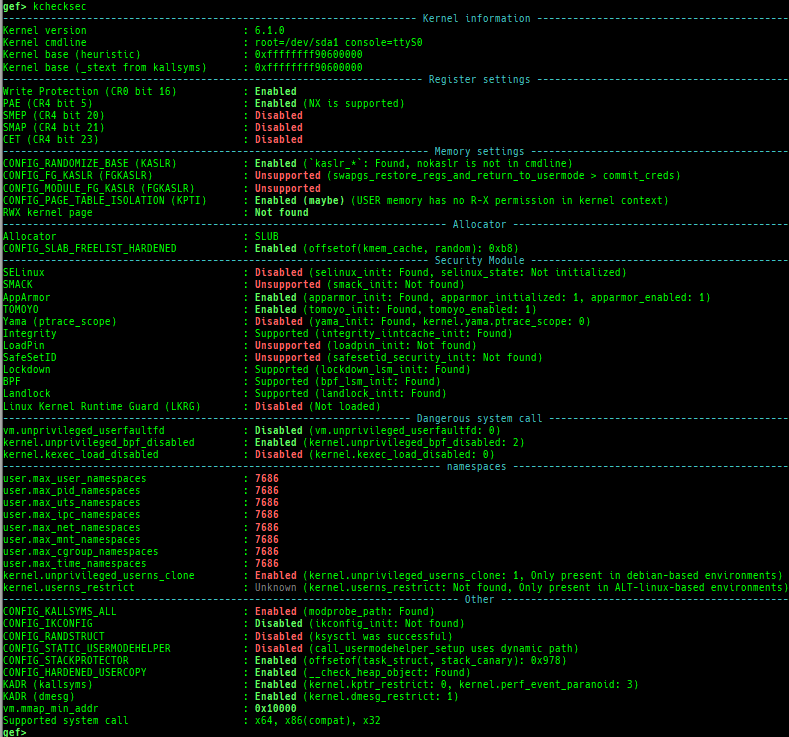
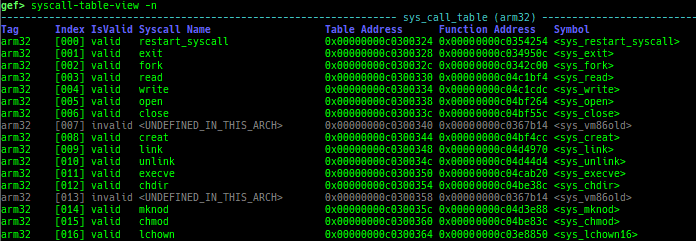
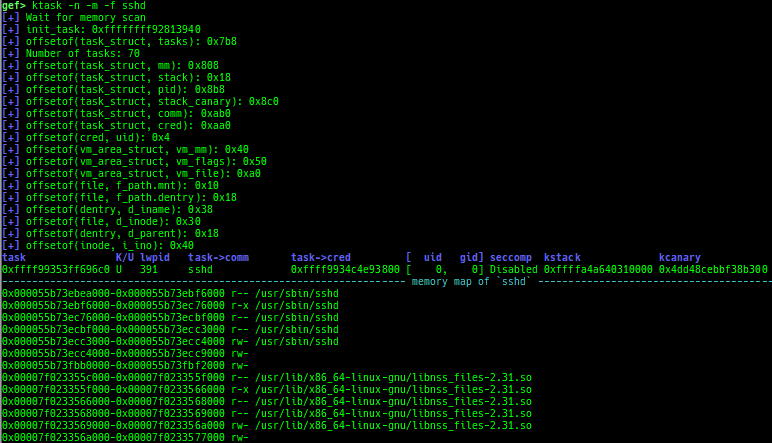
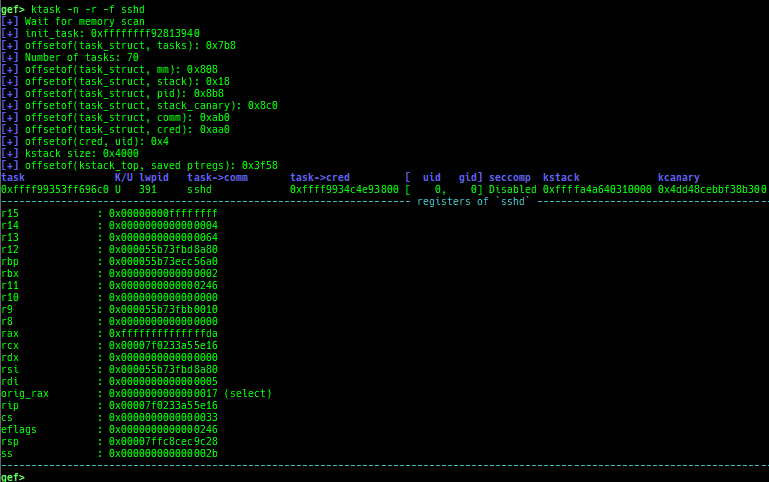
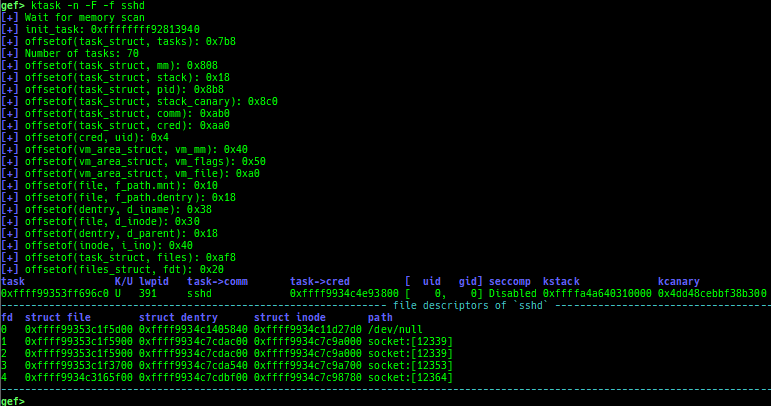
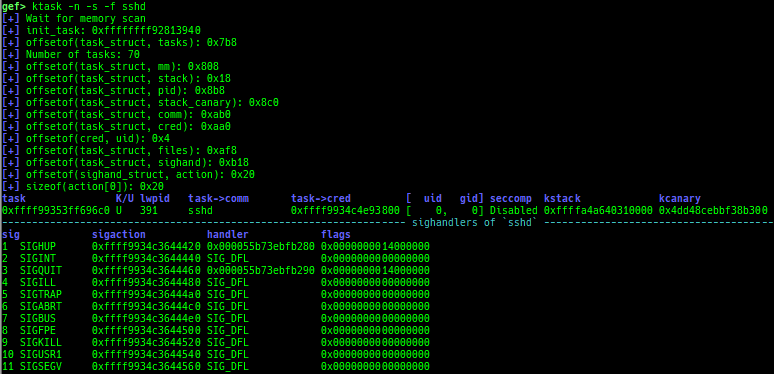
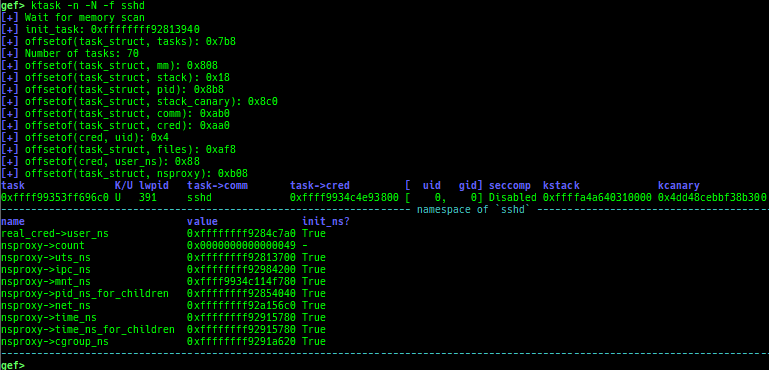
kmagic: displays useful addresses in kernel.kchecksec: checks kernel security.kconfig: dumps kernel config if available.syscall-table-view: displays system call table.ksysctl: dumps sysctl parameters.ktask: displays each task address.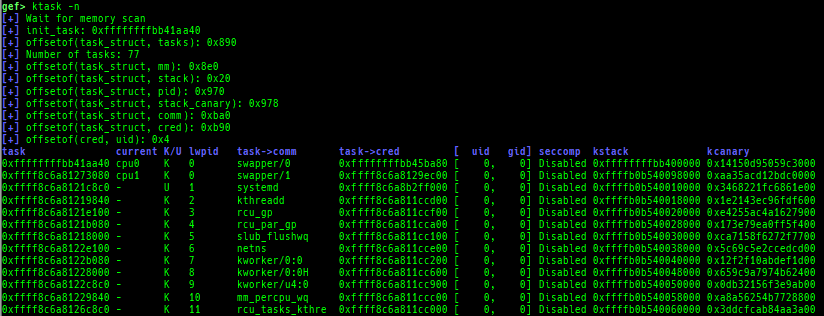
- It also displays the memory map of the userland process.
- It also displays the register values saved on kstack of the userland process.
- It also displays the file descriptors of the userland process.
- It also displays the signal handlers of the userland process.
- It also displays the namespaces of the userland process.
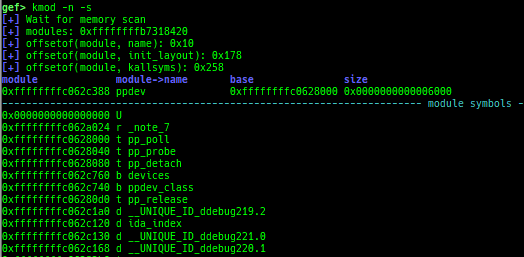
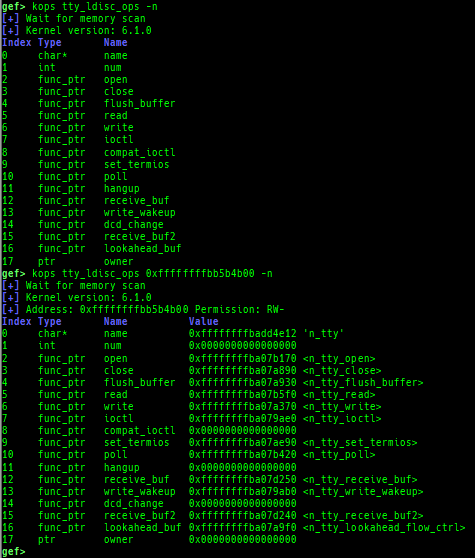
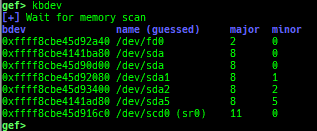
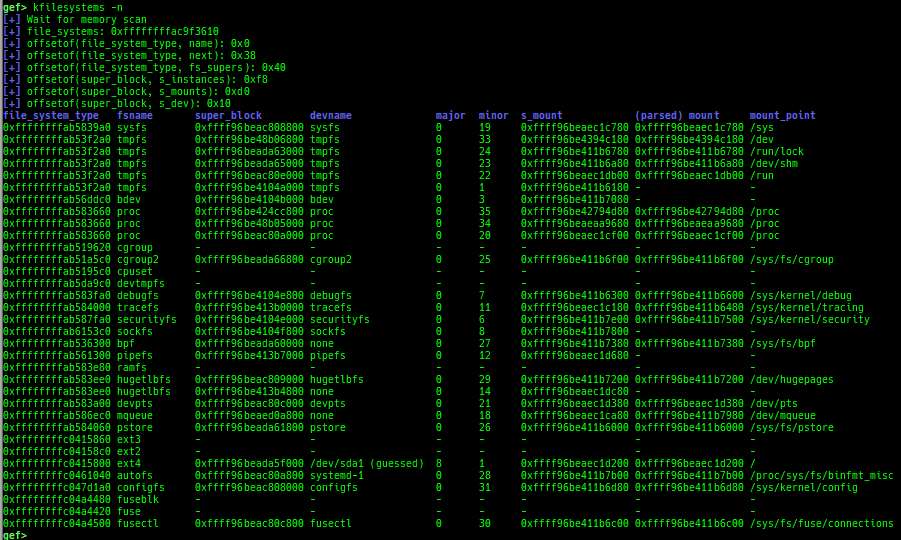
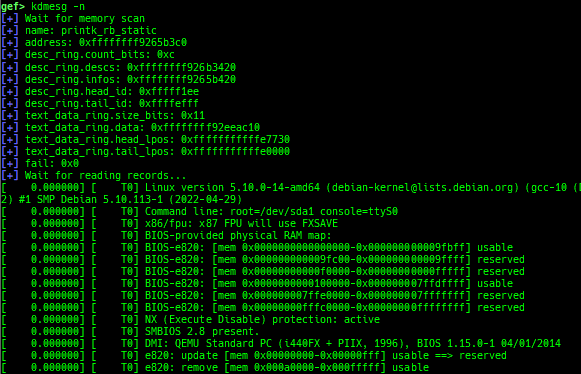
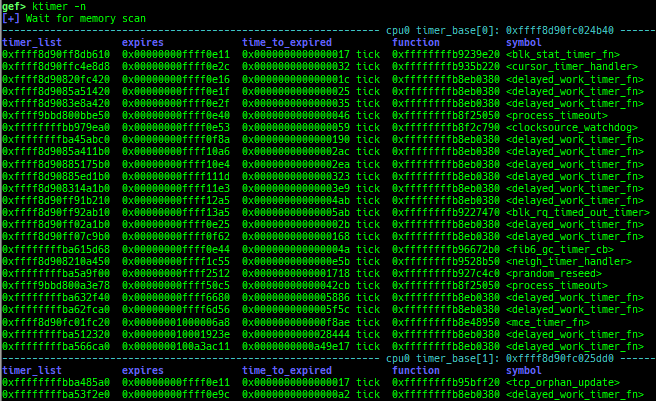
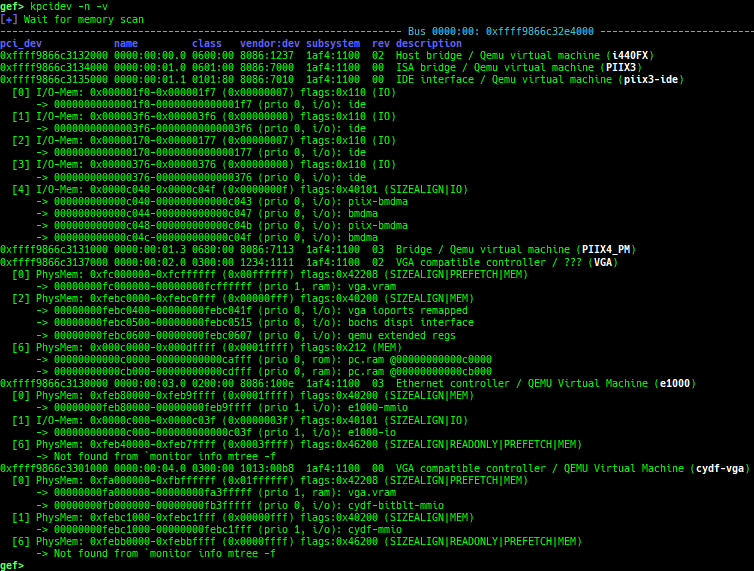
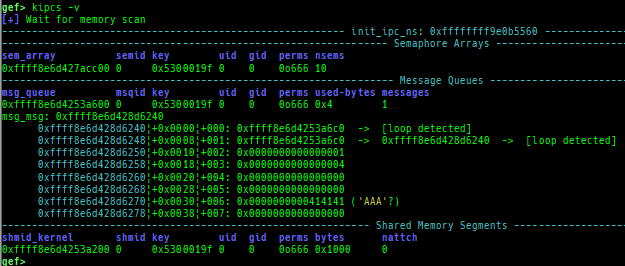
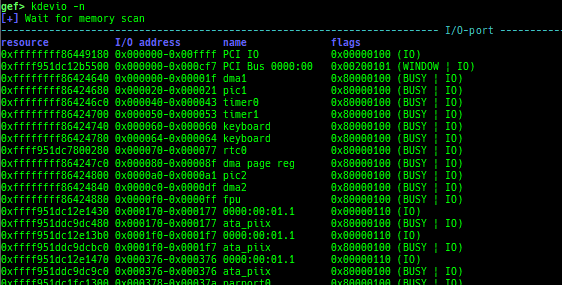
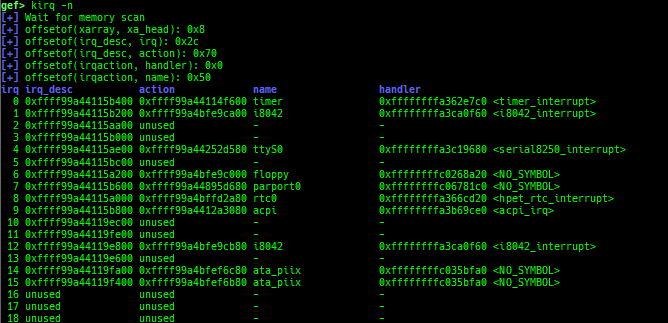
kmod: displays each module address.kops: displays each operations member.kcdev: displays each character device information.kbdev: displays each block device information.kfilesystems: dumps supported file systems.kclock-source: dumps clocksource list.kdmesg: dumps the ring buffer of dmesg area.kpipe: displays each pipe information.kbpf: dumps bpf information.ktimer: dumps timer.kpcidev: dumps PCI devices.kipcs: dumps IPCs information (System V semaphore, message queue and shared memory).kdevio: dumps I/O-port and I/O-memory informations.kdmabuf: dumps DMA-BUF information.kirq: dumps irq information.
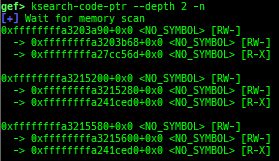
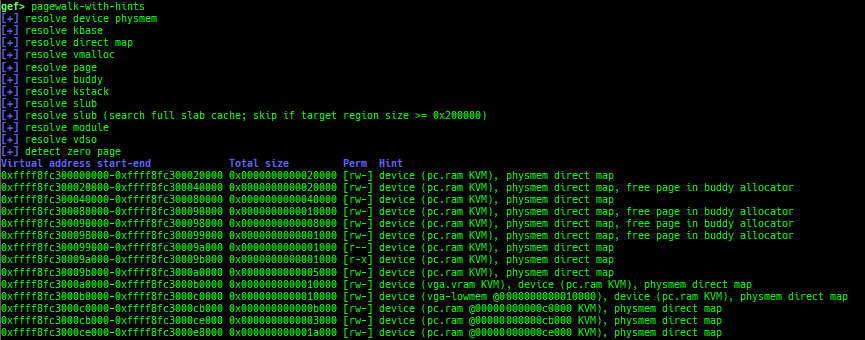
ksearch-code-ptr: searches the code pointer in kernel data area.pagewalk-with-hints: prints pagetables with description.thunk-tracer: collects and displays the thunk function addresses that are called automatically (only x64/x86).usermodehelper-tracer: collects and displays the information that is executed bycall_usermodehelper_setup.
si/ni: are the wrapper for nativesi/ni.- On OpenRISC architecture, branch operations don't work well, so use breakpoints to simulate.
- On Cris architecture,
stepi/nexticommands don't work well, so use breakpoints to simulate. - If you want to use native
si/ni, use the full formstepi/nexti.
c: is the wrapper for nativec.- When connecting to gdb stub of qemu-user or Intel Pin, gdb does not trap SIGINT during
continue. - If you want to trap, you need to issue SIGINT on the qemu-user or pin side, but switching screens is troublesome.
- This command realizes a pseudo SIGINT trap by trapping SIGINT on the python side and throwing SIGINT back to qemu-user or Intel Pin.
- It works only local qemu-user or Intel Pin.
- If you want to use native
c, use the full formcontinue.
- When connecting to gdb stub of qemu-user or Intel Pin, gdb does not trap SIGINT during
partition-alloc-dump: dumps partition-alloc free-list.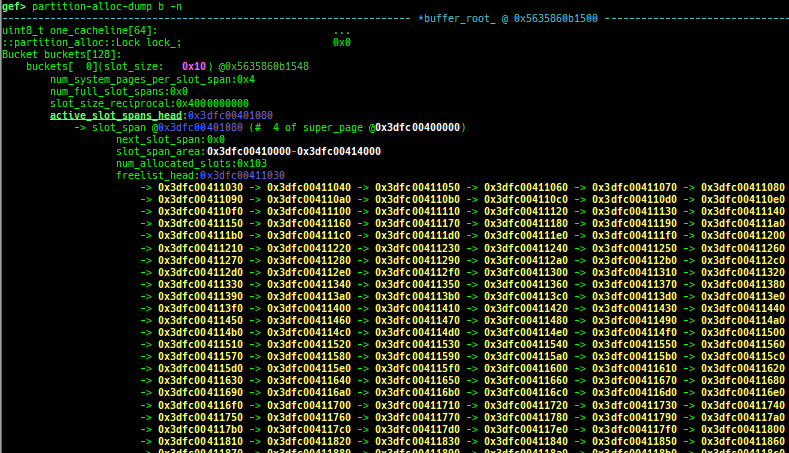
- This command is reserved for the implementation of latest version of chromium.
- Currently tested: v121.x / 1225457 / dce8d804887f7f941b8bb78ae6ad6419a04038f2
- https://commondatastorage.googleapis.com/chromium-browser-snapshots/index.html?prefix=Linux_x64/1225457/
- Supported on only x64 (maybe it works on x86/ARM/ARM64, but not tested).
- It will try heuristic search if binary has no symbol.
- How to test:
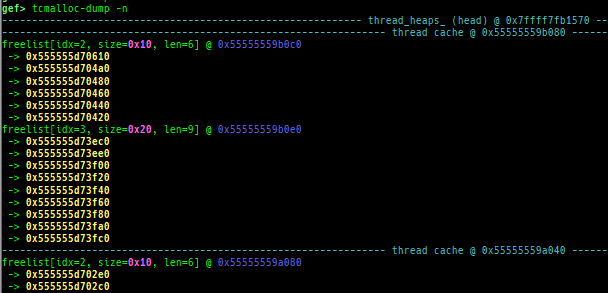
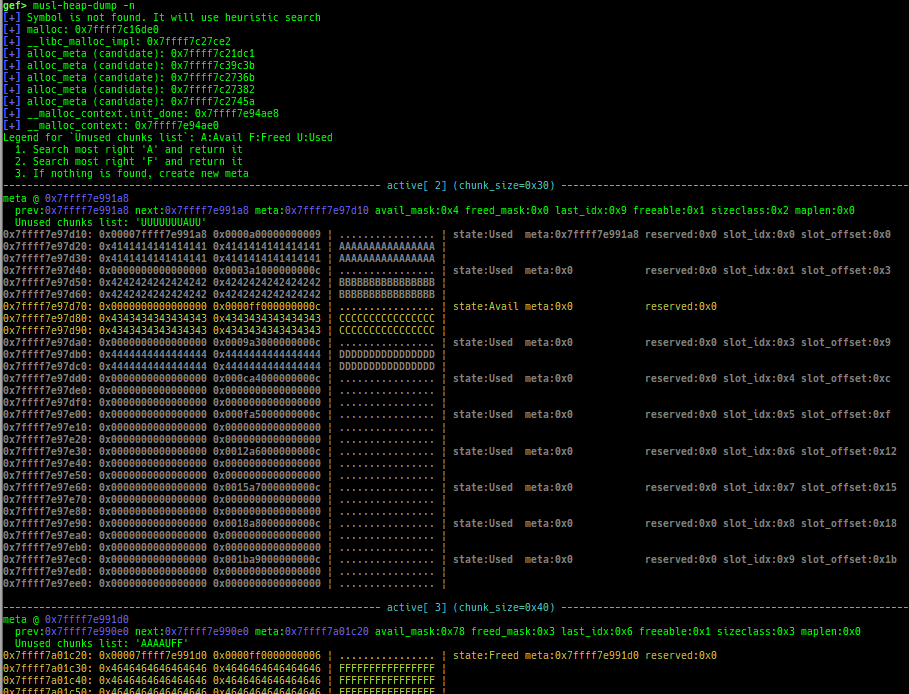
tcmalloc-dump: dumps tcmalloc free-list.musl-heap-dump: dumps musl-libc heap chunks.uclibc-ng-heap-dump: dumps uClibc-ng heap chunks.- Supported on x64/x86, based on uClibc-ng v1.0.42 malloc-standard.
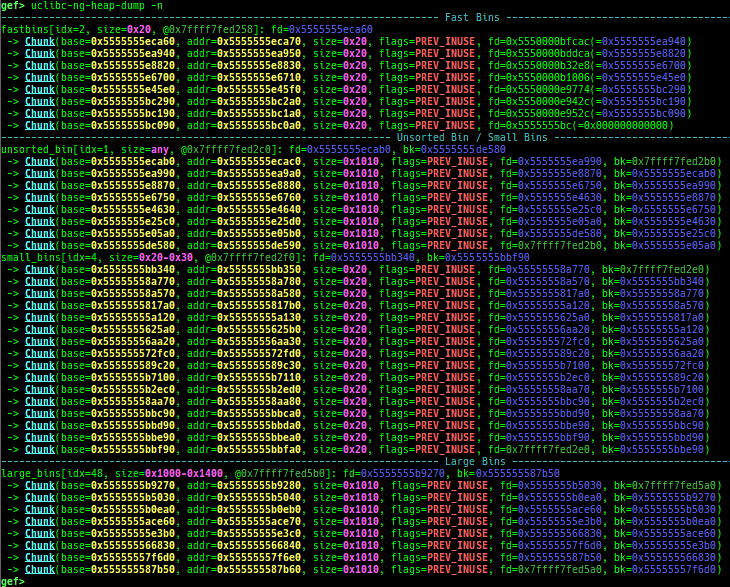
- How to test (x64):
- Download and extract
x86-64--uclibc--stable-2022.08-1.tar.bz2from https://toolchains.bootlin.com/ - Add
/PATH/TO/x86_64-buildroot-linux-uclibc/binto$PATH, thenx86_64-linux-gcc test.c. - Fix interpreter by
patchelf --set-interpreter /PATH/TO/x86_64-buildroot-linux-uclibc/sysroot/lib/ld64-uClibc.so.0 a.out.
- Download and extract
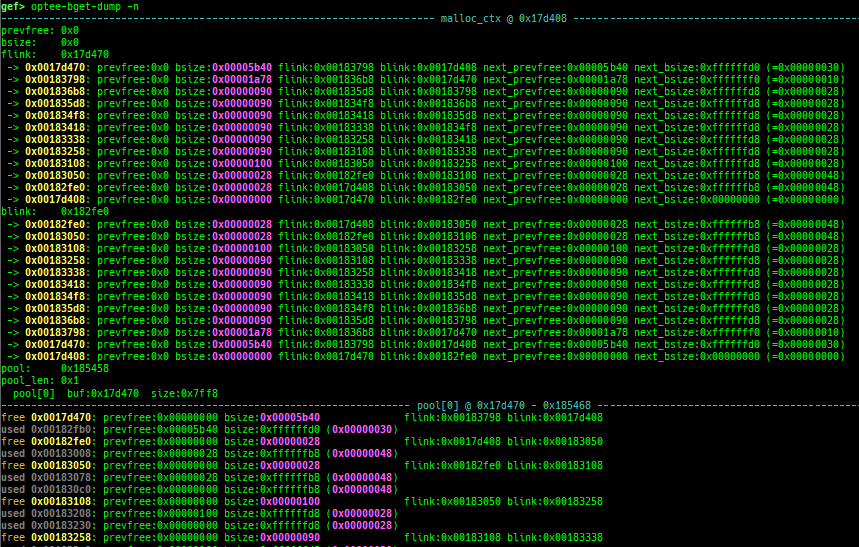
uclibc-ng-visual-heap: is colorized heap viewer for uClibc-ng.optee-bget-dump: dumps bget allocator of OPTEE-Trusted-App.
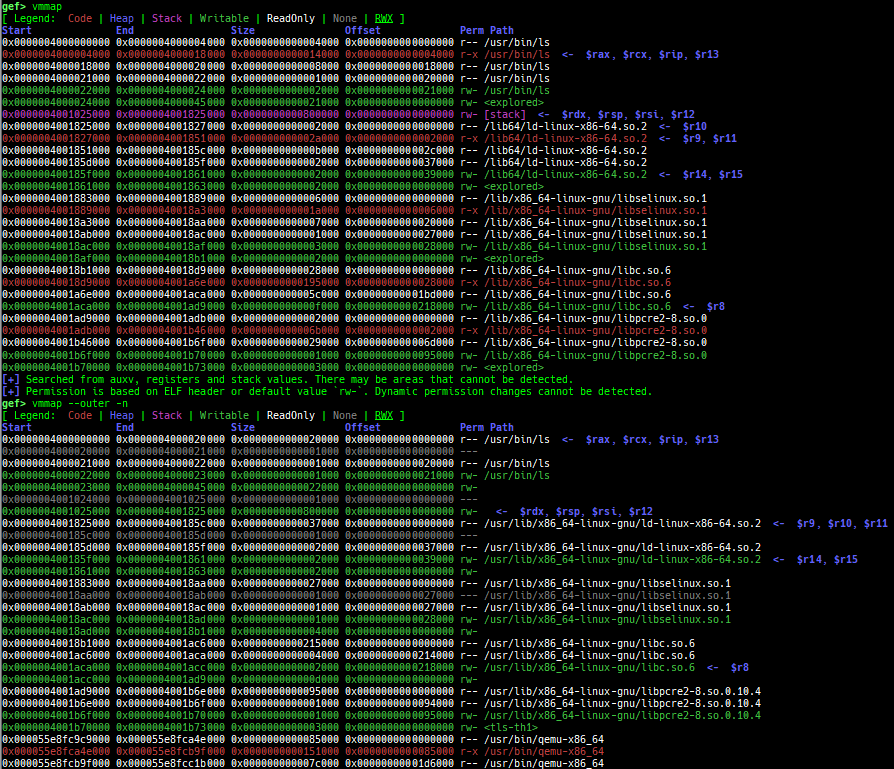
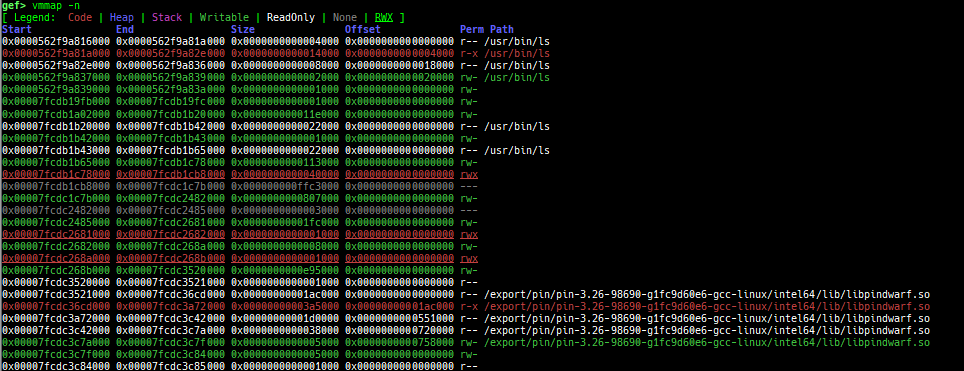
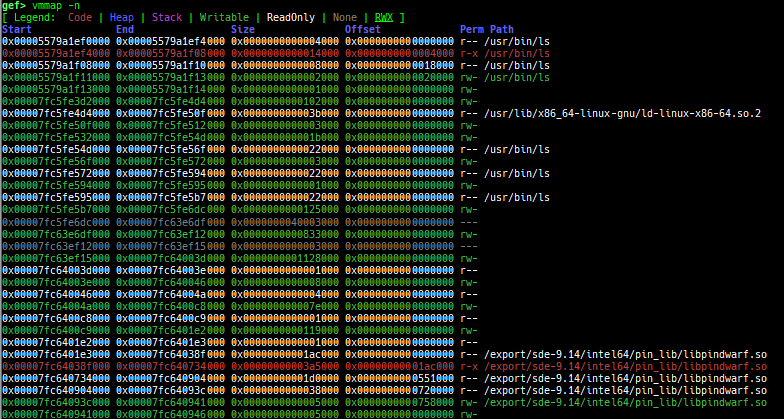
vmmap: is improved.- It displays the memory map information even when connecting to gdb stub like qemu-user.
- Intel Pin is supported.
- Intel SDE is supported.
- It is redirected to
pagewalkwhen connecting to gdb stub of qemu-system. - It supports detection and coloring of
Writable,ReadOnly,NoneandRWXregions. - It shows the area each register points to.
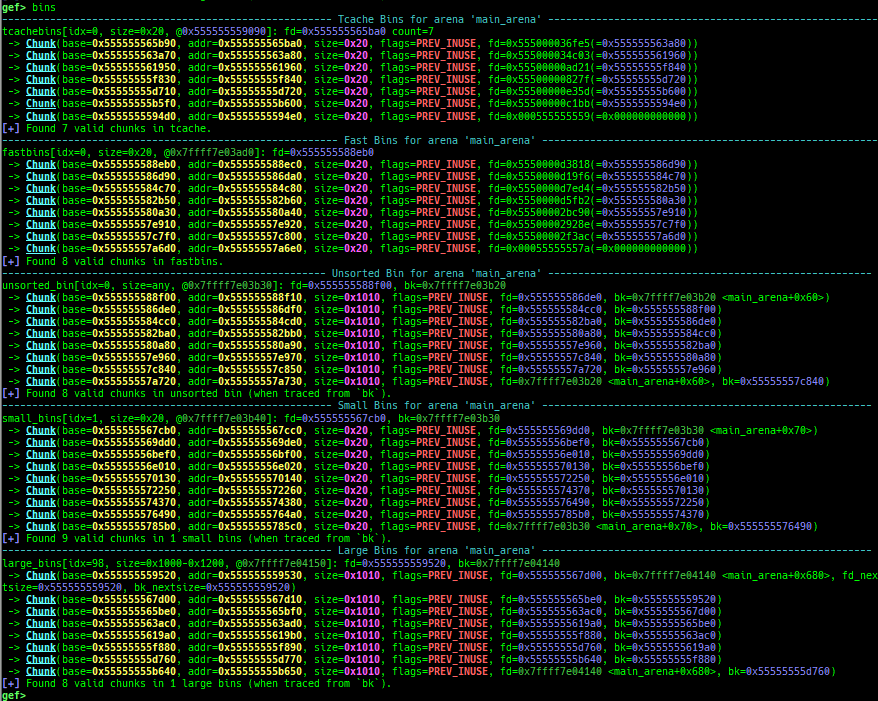
- Glibc heap commands are improved.
- It changes the color.
- They print bins information if the chunk is in free-list.
- Thread arena is supported for all
heapcommands.- Use
-aoption.
- Use
- It supports new modes
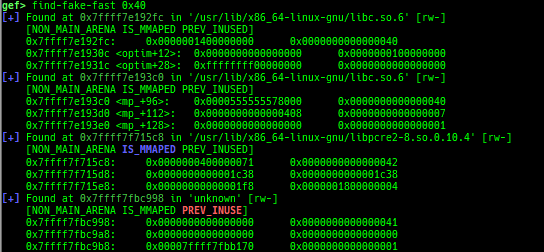
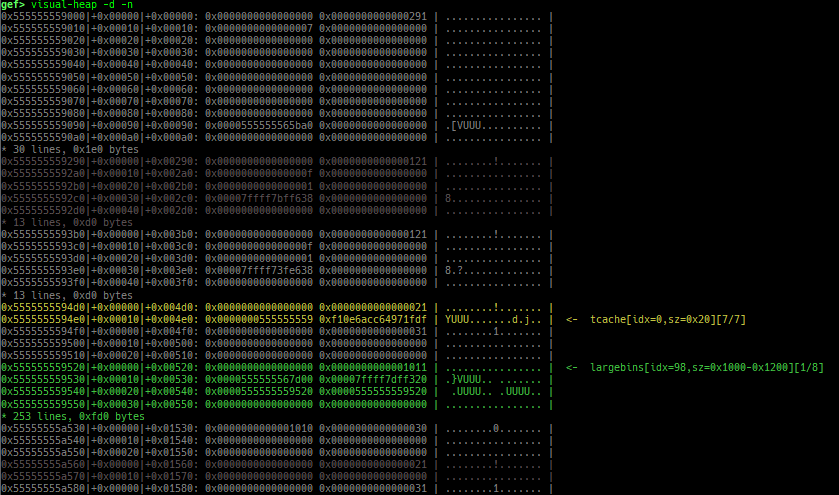
heap arenasandheap top. find-fake-fast: searches for a memory with a size-like value that can be linked to the fastbin free-list.visual-heap: is colorized heap viewer.extract-heap-addr: analyzes tcache-protected-fd introduced from glibc-2.32.
registers: is improved.context: is improved.- It supports automatic display of system call arguments when calling a system call.
- It supports automatic display of address and value when accessing memory.
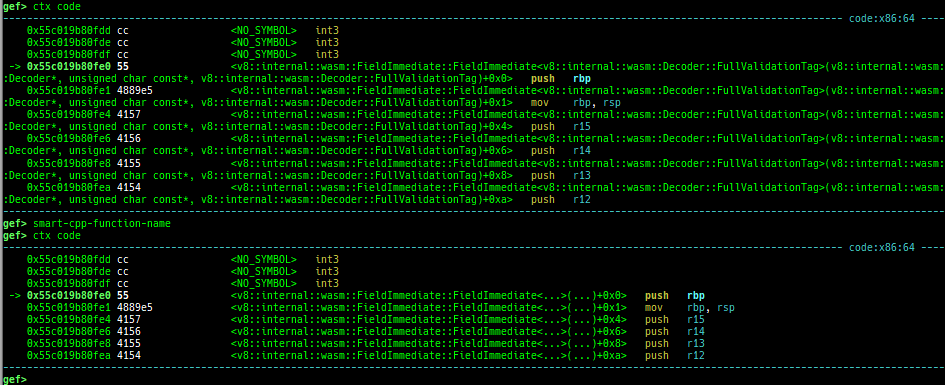
- It supports smart symbol printing for cpp function.
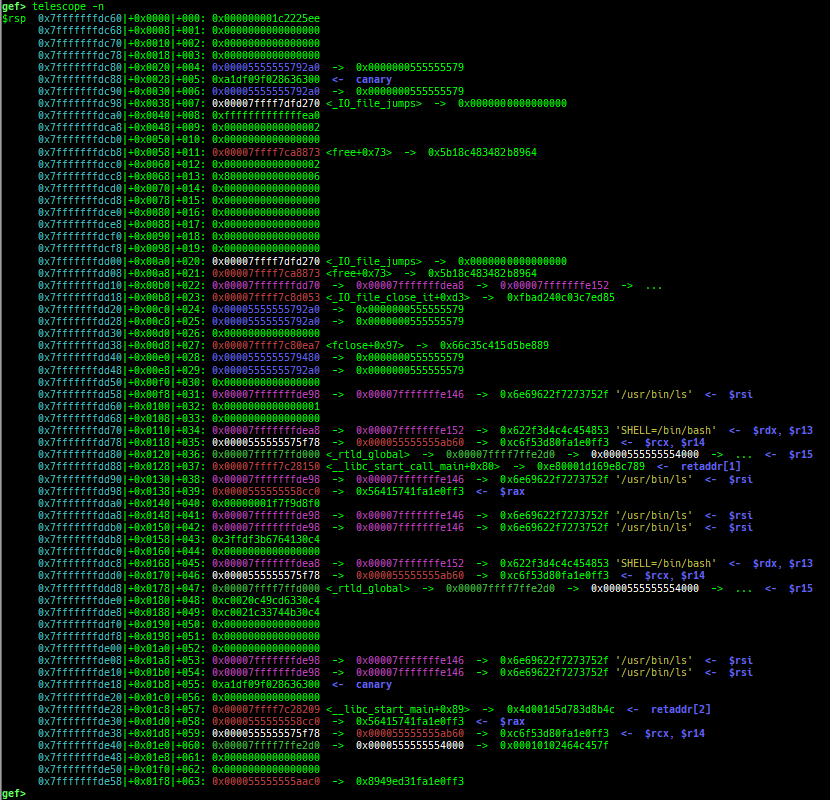
telescope: is improved.- It displays ordinal numbers as well as offsets.
- It displays if there are canary and ret-addr on the target area.
- It supports blacklist address features (to avoid dying when touching the address mapped to the serial device).
- It also shows the symbol if available.
- It supports some new options:
--is-addr,--is-not-addr,--uniq,--depth,--slab-contains,--slab-contains-unaligned,--physand--tag.
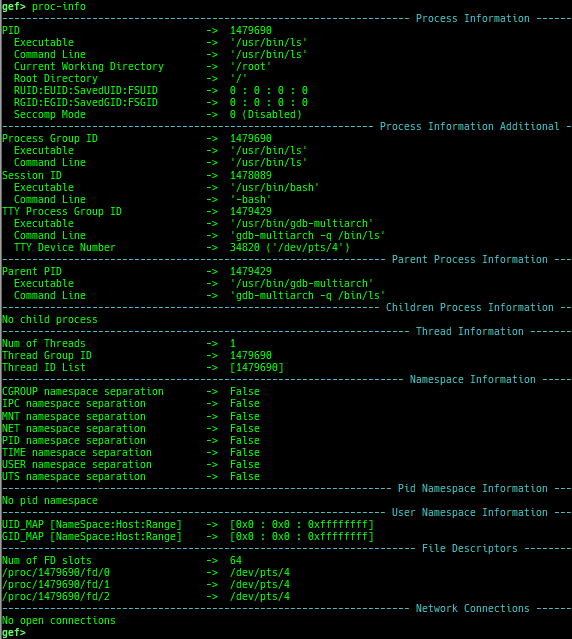
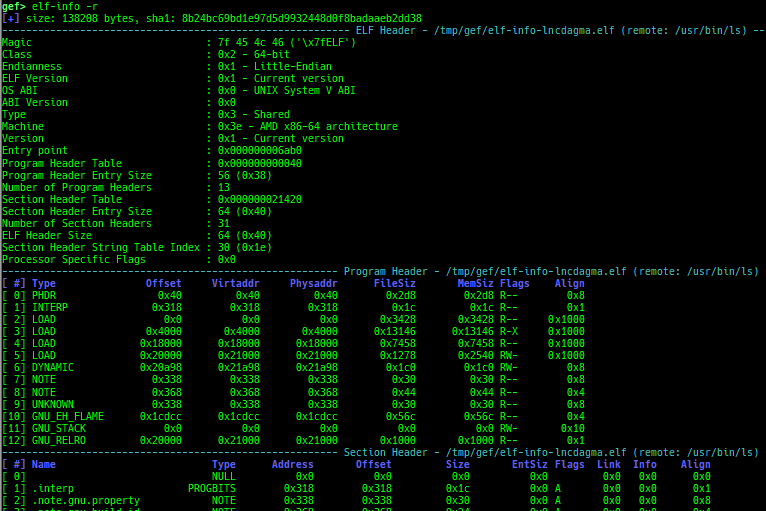
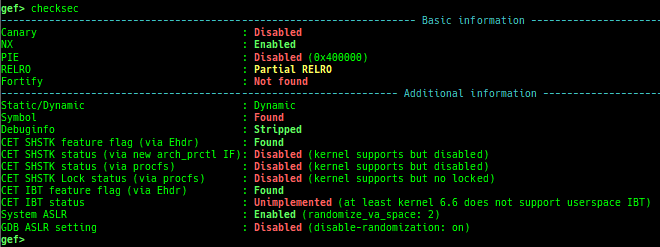
proc-info: is improved.elf-info: is improved.xinfo: is improved.checksec: is improved.- It shows whether Static or Dynamic.
- It shows whether Stripped or not.
- It detects canary against static stripped binary.
- It shows whether Intel CET instructions (
endbr64/endbr32) is found or not. - It shows whether Intel CET IBT/SHSTK is enabled or not.
- It shows whether ARMv8 PAC / MTE is enabled or not.
- It shows whether RPATH/RUNPATH is set or not.
- It shows if Clang CFI/SafeStack is used or not.
- It shows whether System-ASLR is enabled or not.
- It shows whether GDB ASLR setting is enabled or not.
- It supports parsing remote binary (if download feature is available).
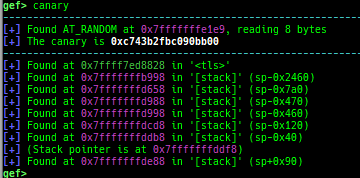
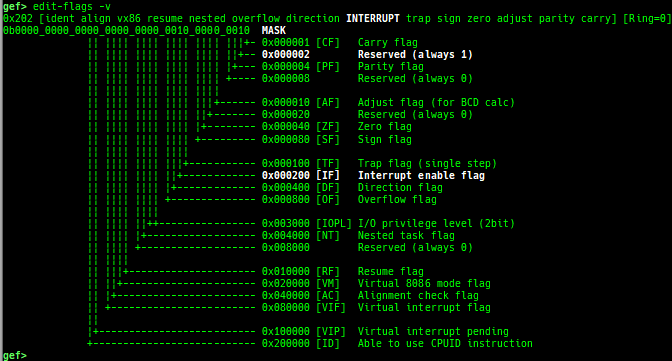
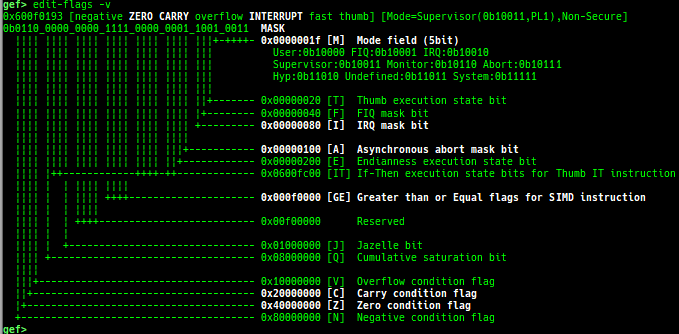
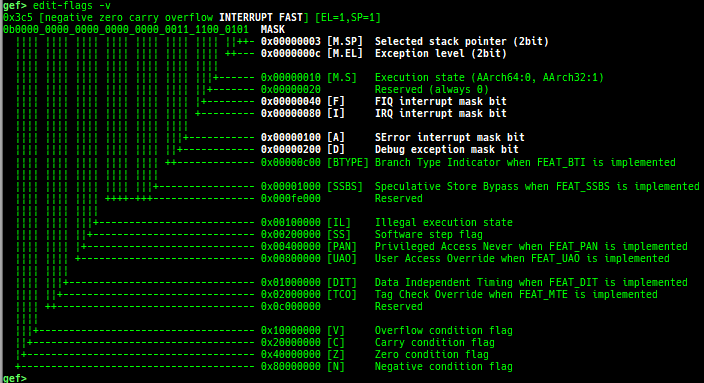
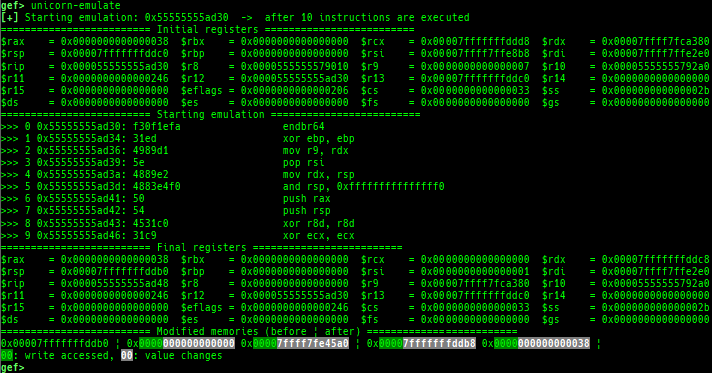
got: is improved.canary: is improved.edit-flags: is improved.unicorn-emulate: is improved.ropper: is improved.- It does not reset autocomplete settings after calling imported ropper.
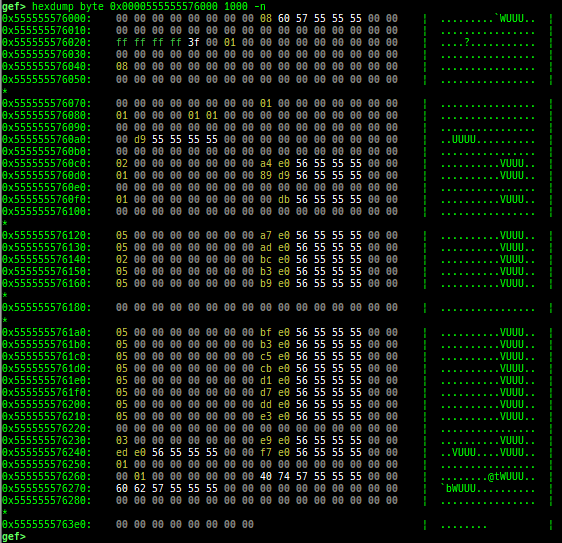
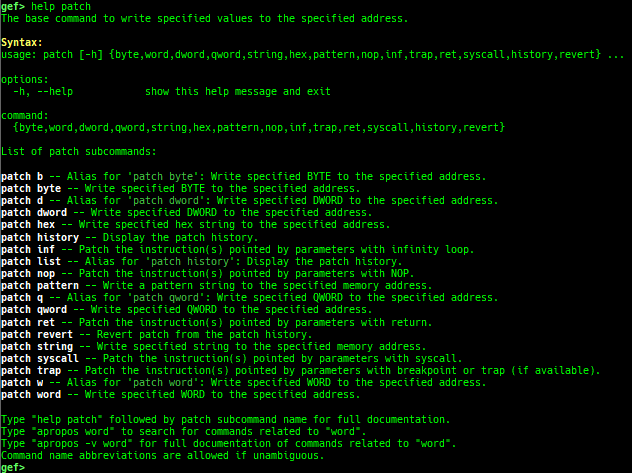
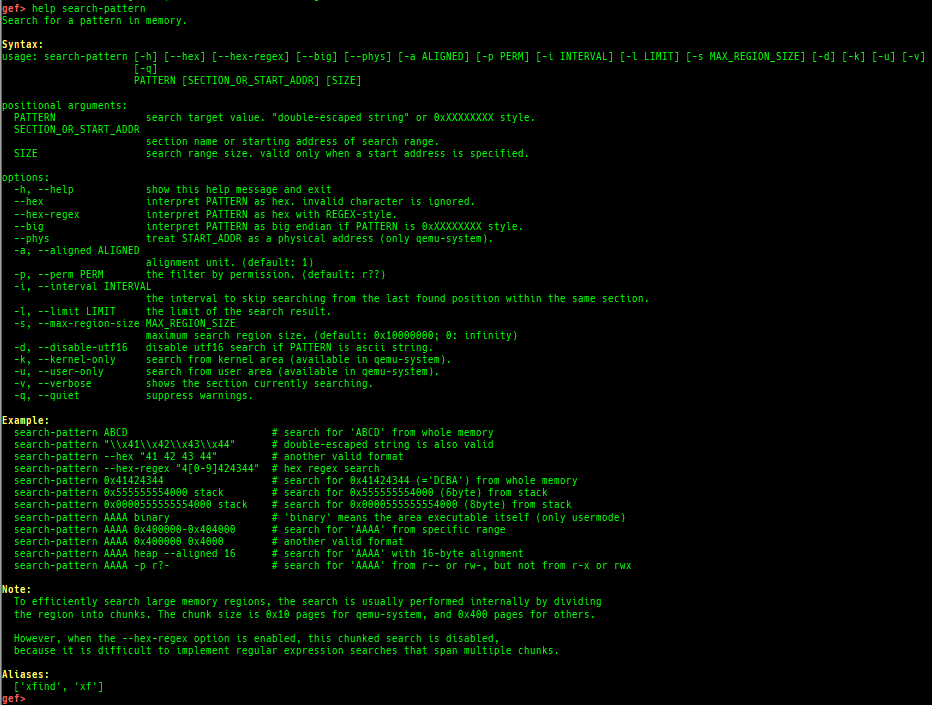
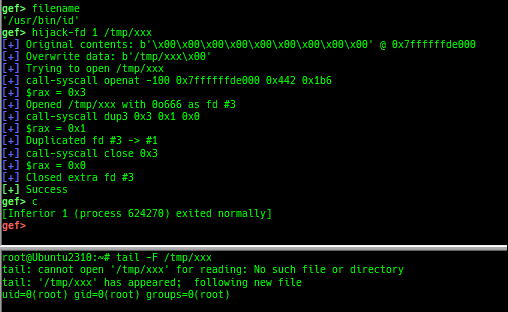
hexdump: is improved.patch: is improved.search-pattern: is improved.mprotect: is improved.hijack-fd: is improved.format-string-helperis improved.- It supports more printf-like functions.
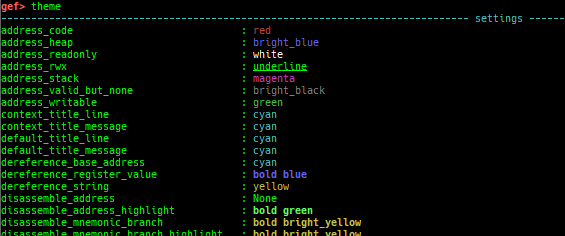
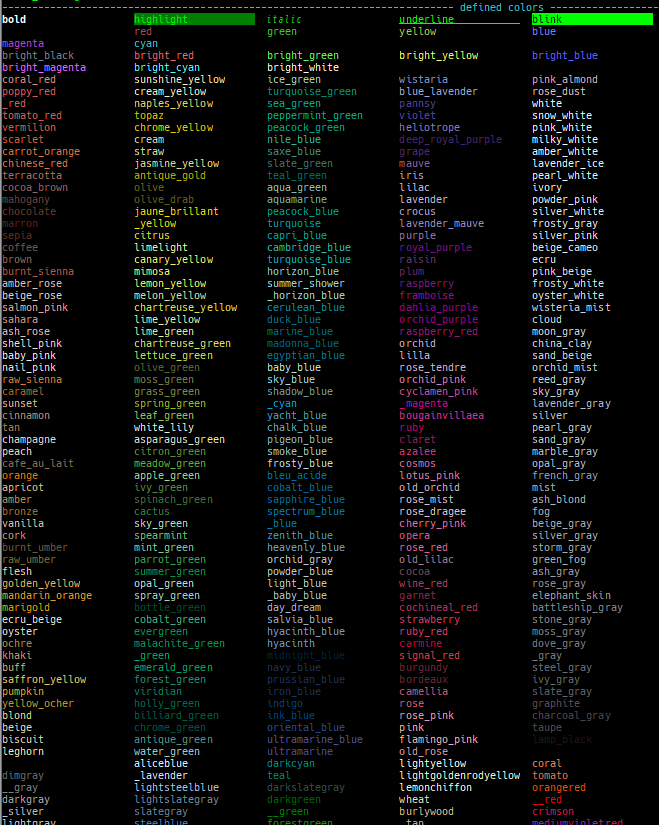
themeis improved.up/down: are the wrapper for nativeup/down.- It shows also backtrace.
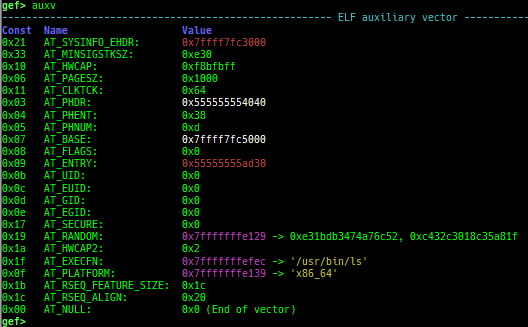
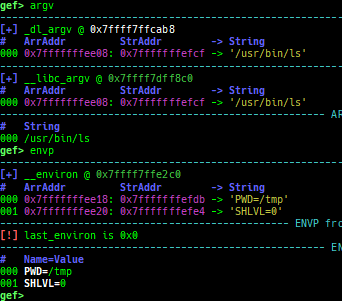
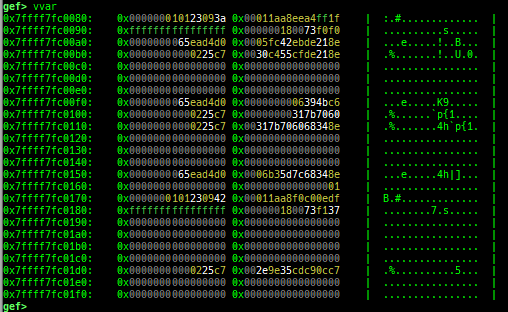
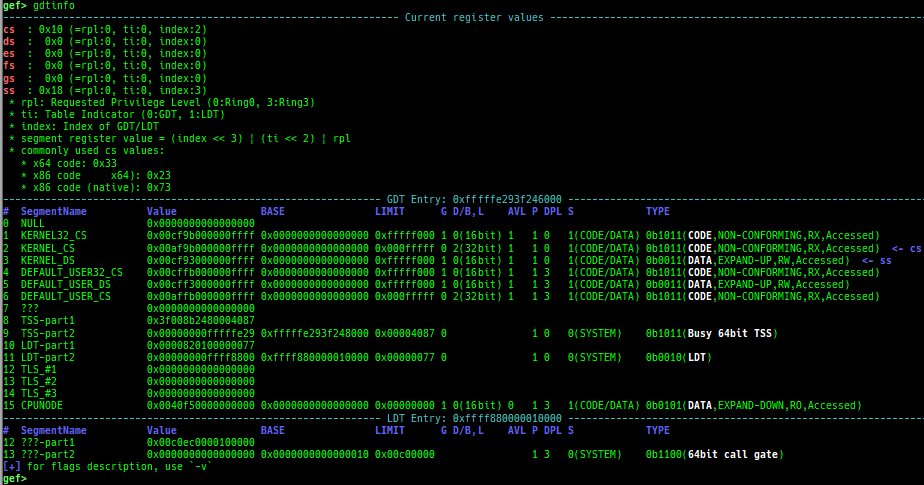
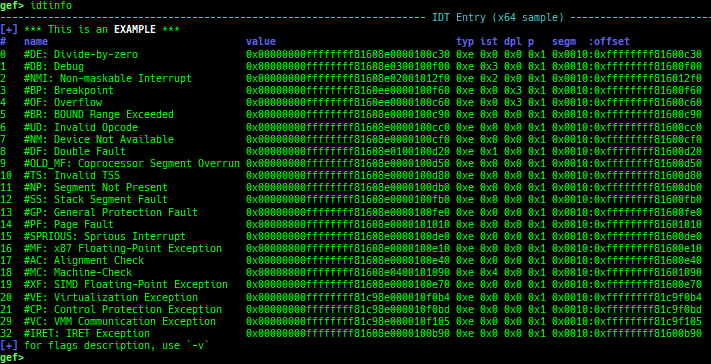
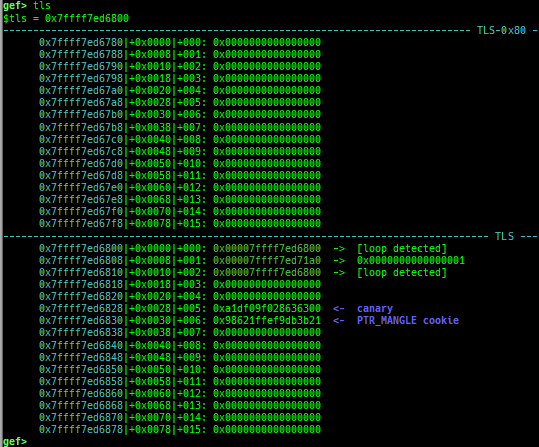
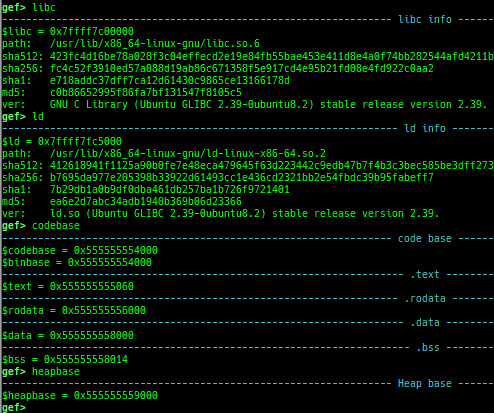
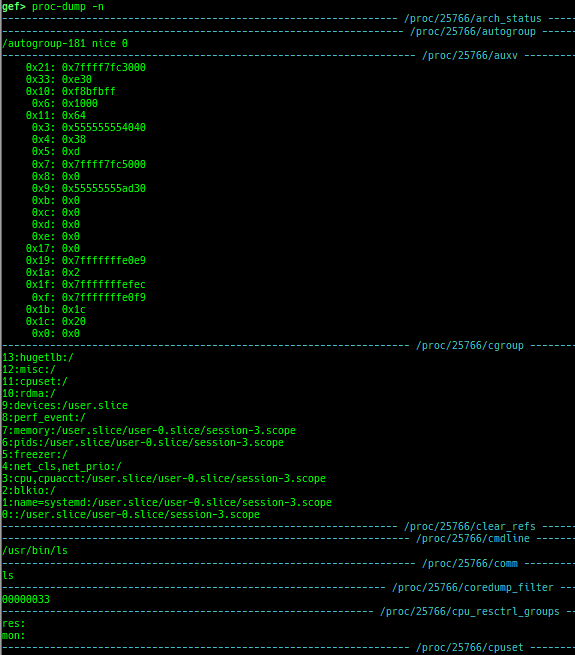
pid/tid: prints pid and tid.filename: prints filename.auxv: pretty prints ELF auxiliary vector.argv/envp: pretty prints argv and envp.dumpargs: dumps arguments of current function.vdso: disassembles the text area of vdso smartly.vvar: dumps the area of vvar.gdtinfo: pretty prints GDT entries. If userland, show sample entries.idtinfo: pretty prints IDT entries. If userland, show sample entries.tls: pretty prints TLS area. Some architectures only support glibc.fsbase/gsbase: pretty prints$fs_base,$gs_base.libc/ld/heapbase/codebase: displays each of the base address.break-rva: sets a breakpoint at relative offset from codebase.command-break: sets a breakpoint which executes user defined command if hit.main-break: sets a breakpoint atmainwith or without symbols, then continue.- This is useful when you just want to run to
mainunder using qemu-user or pin, or debugging no-symbol ELF.
- This is useful when you just want to run to
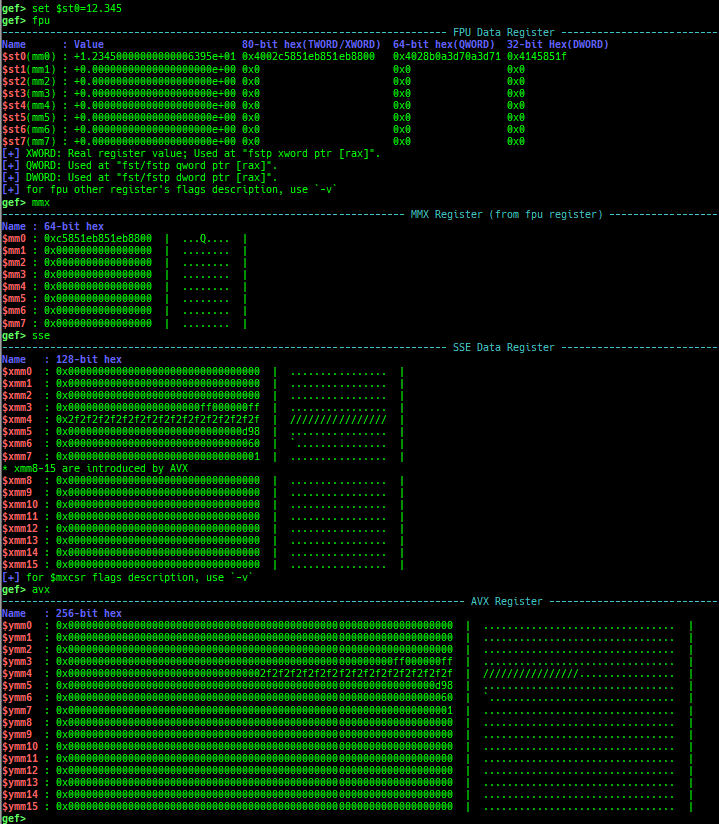
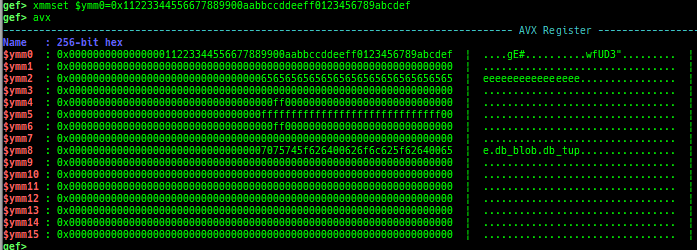
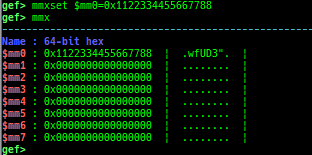
break-only-if-taken/break-only-if-not-taken: sets a breakpoint which breaks only branch is taken (or not taken).distance: calculates the offset from its base address.fpu/mmx/sse/avx: pretty prints FPU/MMX/SSE/AVX registers.xmmset: sets the value to xmm/ymm register simply.mmxset: sets the value to mm register simply.exec-until: executes until specified operation.xuntil: executes until specified address.- It is slightly easier to use than the original until command.
until-next: executes until next address.- This is useful for the operation with
repprefix.
- This is useful for the operation with
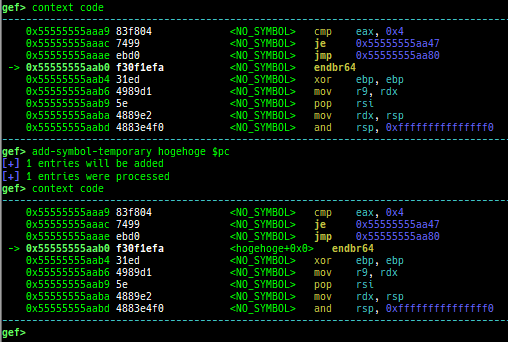
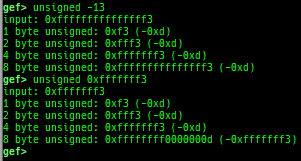
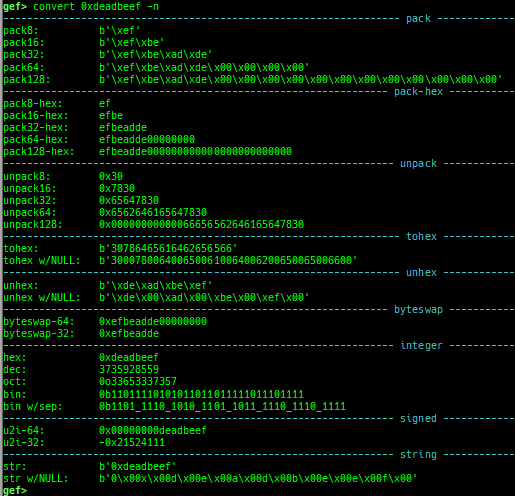
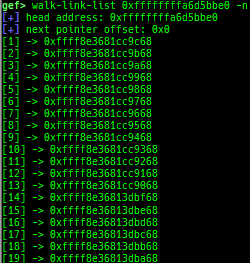
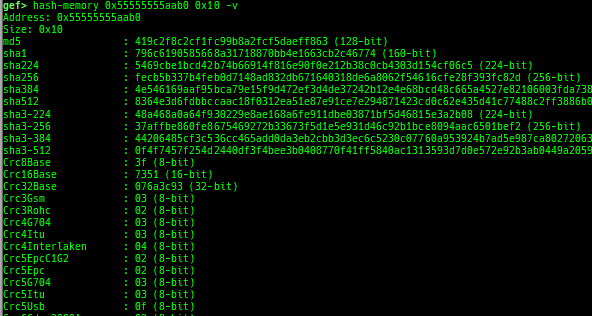
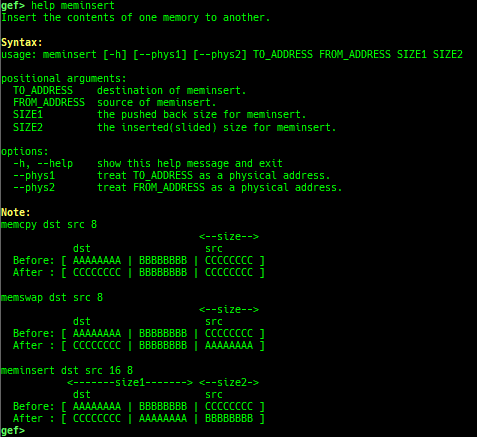
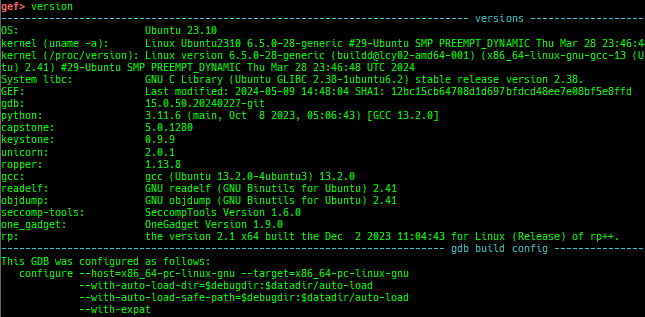
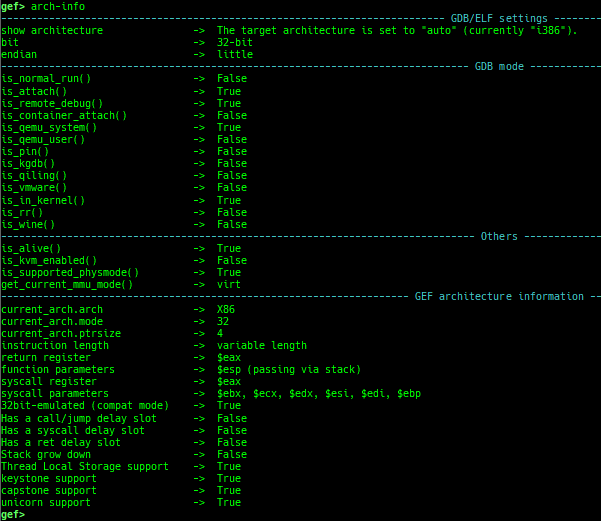
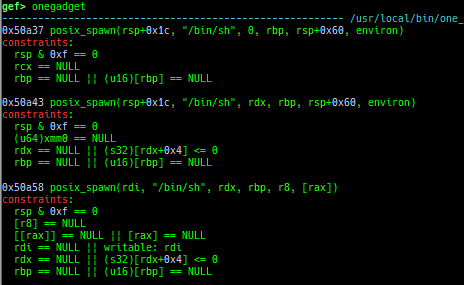
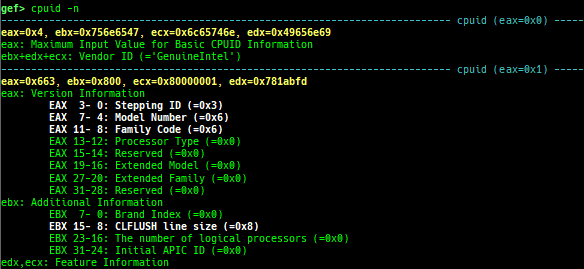
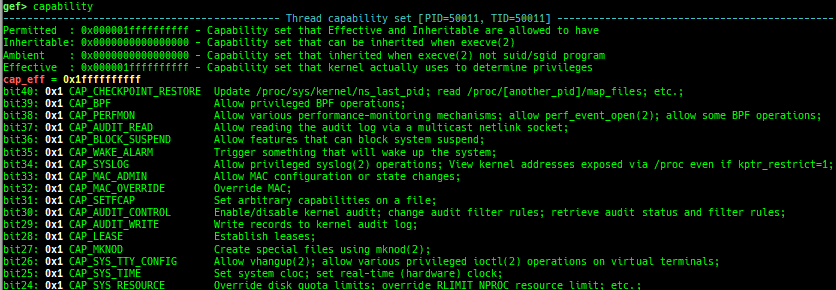
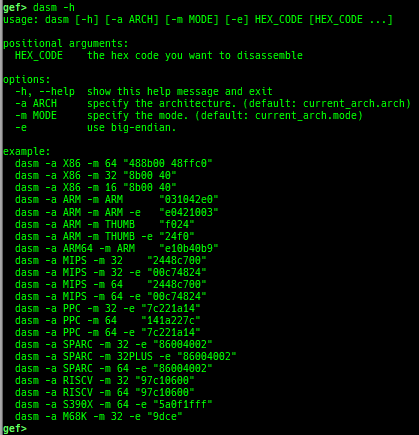
add-symbol-temporary: adds symbol information from command-line.errno: displays errno list or specified errno.u2d: shows cast/convert u64 <-> double/float.unsigned: shows unsigned value.convert: shows various conversion.walk-link-list: walks the link list.hexdump-flexible: displays the hexdump with user defined format.hash-memory: calculates various hashes/CRCs.memcmp: compares the contents of the address A and B, whether virtual or physical.memset: sets the value to the memory range, whether virtual or physical.memcpy: copies the contents from the address A to B, whether virtual or physical.memswap: swaps the contents of the address A and B, whether virtual or physical.meminsert: inserts the contents of the address A to B, whether virtual or physical.is-mem-zero: checks the contents of address range is all 0x00 or 0xff or not.ii: is a shortcut forx/50i $pcwith opcode bytes.version: shows software versions that gef used.arch-info: shows architecture information used in gef.context-extra: manages user specified command to execute when each step.comment: manages user specified temporary comment.seccomp: invokesseccomp-tools.onegadget: invokesone_gadget.rp: invokesrp++with commonly used options.call-syscall: calls system call with specified values.mmap: allocates a new memory bycall-syscall.killthreads: kill specific or all pthread.constgrep: invokesgrepunder/usr/include.proc-dump: dumps each file under/proc/PID/.time: measures the time of the GDB command.multi-line: executes multiple GDB commands in sequence.cpuid: shows the result of cpuid(eax=0,1,2...).capability: shows the capabilities of the debugging process.dasm: disassembles the code by capstone.asm-list: lists up instructions. (only x64/x86)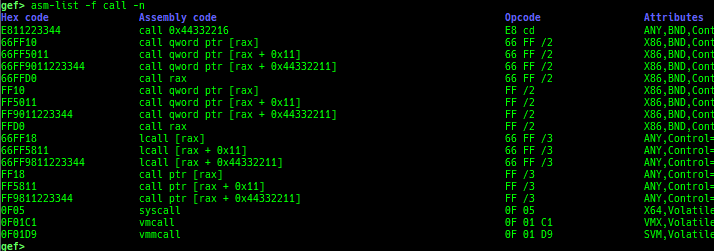
- This command uses x86data.js from https://github.com/asmjit/asmdb
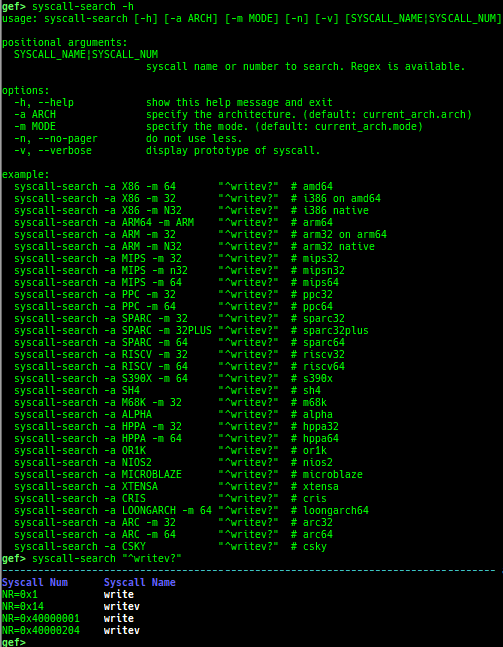
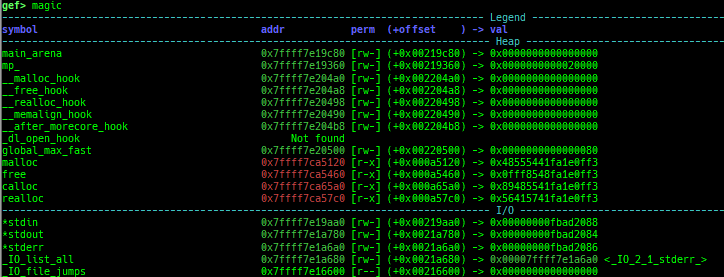
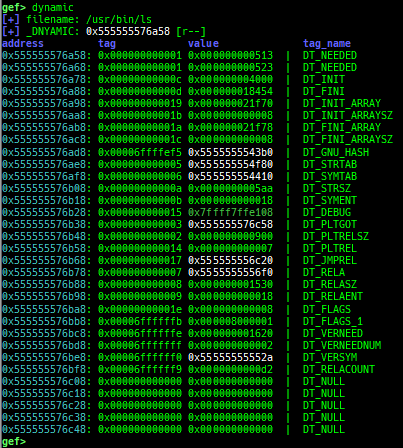
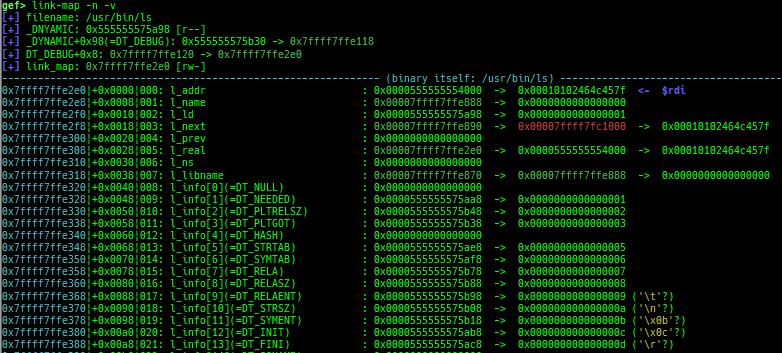
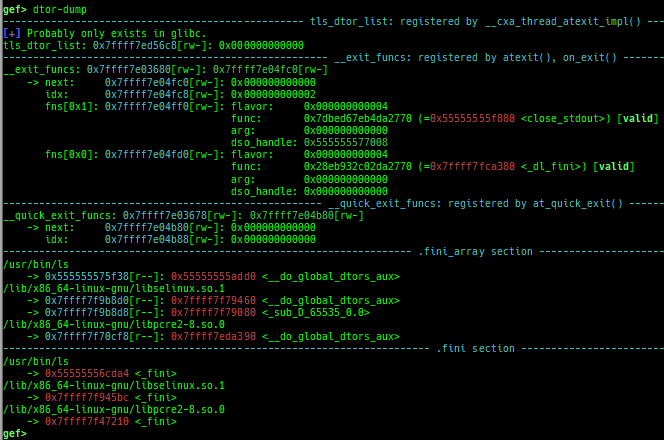
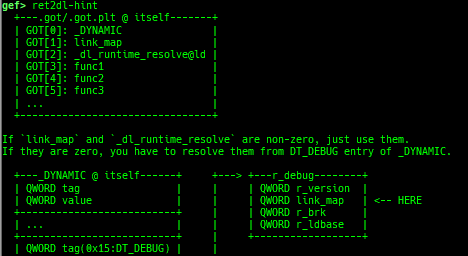
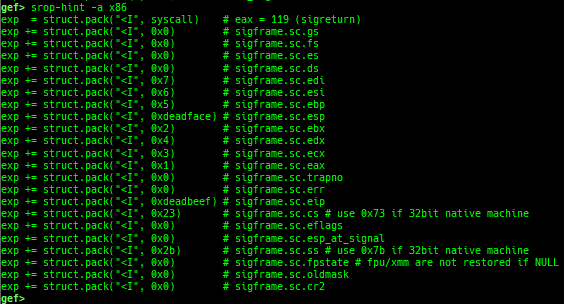
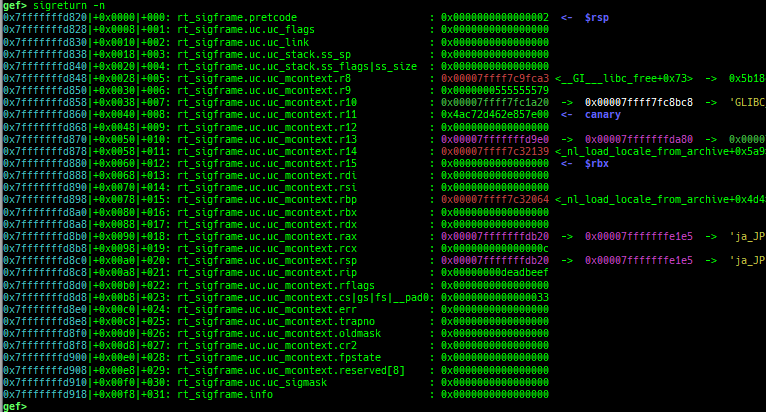
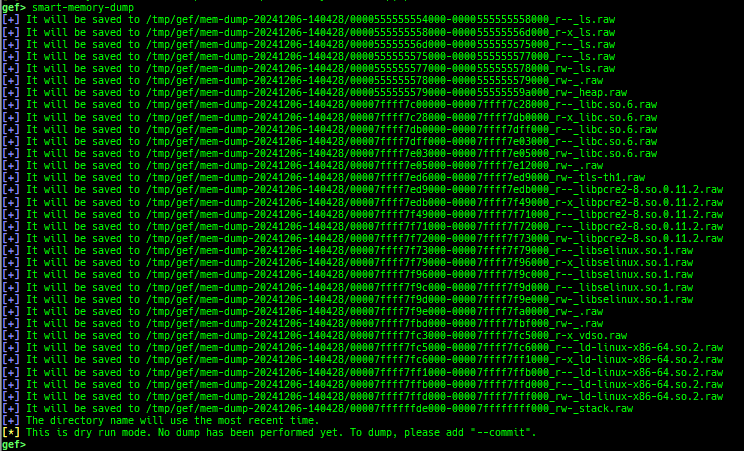
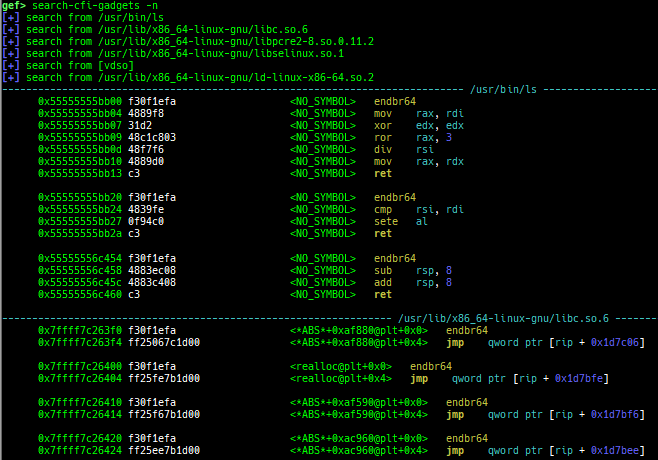
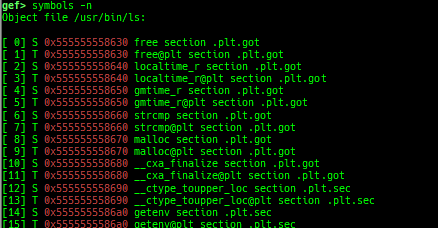
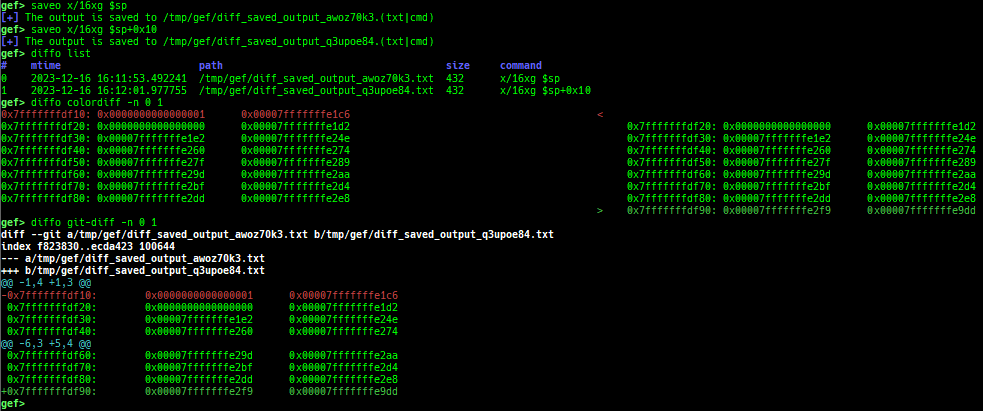
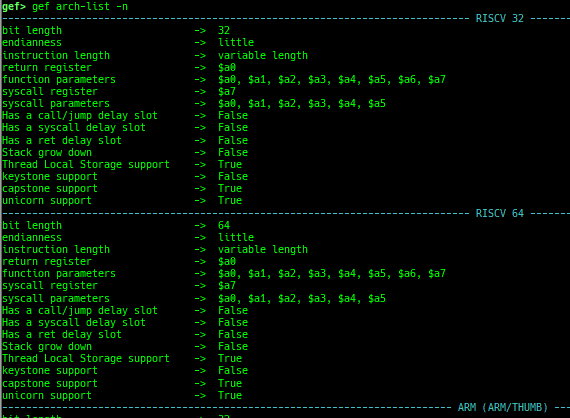
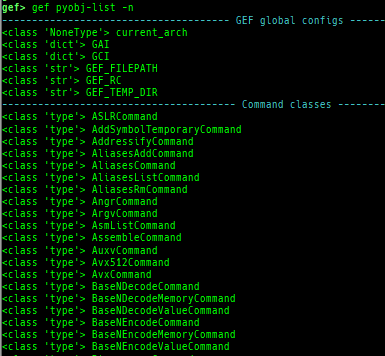
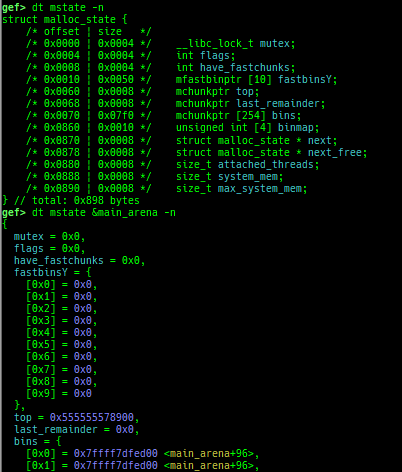
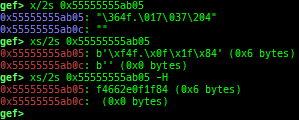
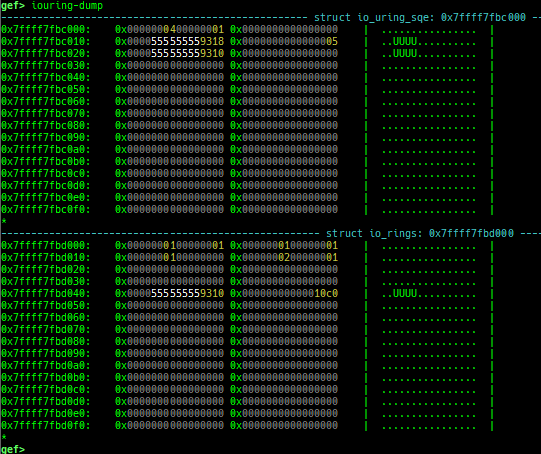
syscall-search: searches system call by regex.dwarf-exception-handler: dumps the DWARF exception handler informations.magic: displays useful addresses in glibc etc.dynamic: dumps the_DYNAMICarea.link-map: dumps useful members oflink_mapwith iterating.dtor-dump: dumps some destructor functions list.ptr-mangle: shows the mangled value will be mangled byPTR_MANGLE.ptr-demangle: shows the demangled value of the value mangled byPTR_MANGLE.search-mangled-ptr: searches the mangled value from RW memory.strings: searches ASCII string from specific location.read-system-register: reads system register for old qemu (only ARM32).v8: displays v8 tagged object.follow: changesfollow-fork-modesetting.smart-cpp-function-name: togglescontext.smart_cpp_function_namesetting.ret2dl-hint: shows the structure used by return-to-dl-resolve as hint.srop-hint: shows the code for sigreturn-oriented-programming as hint.sigreturn: displays stack values for sigreturn syscall.smart-memory-dump: dumps all regions of the memory to each file.search-cfi-gadgets: searches CFI-valid (for CET IBT) and controllable generally gadgets from executable area.symbols: lists up all symbols with coloring.saveo/diffo: saves and diffs the command outputs.seq-length: detects consecutive length of the same sequence.gef arch-list: displays defined architecture information.gef pyobj-list: displays defined global python object.dt: is wrapper forptype /ox TYPEandp ((TYPE*) ADDRESS)[0].mte-tags: displays the MTE tags for the specified address.xs: dumps string likex/scommand, but with hex-string style.syscall-sample: shows the syscall calling sample for specified architecture.iouring-dump: dumps the area of iouring (only x64).
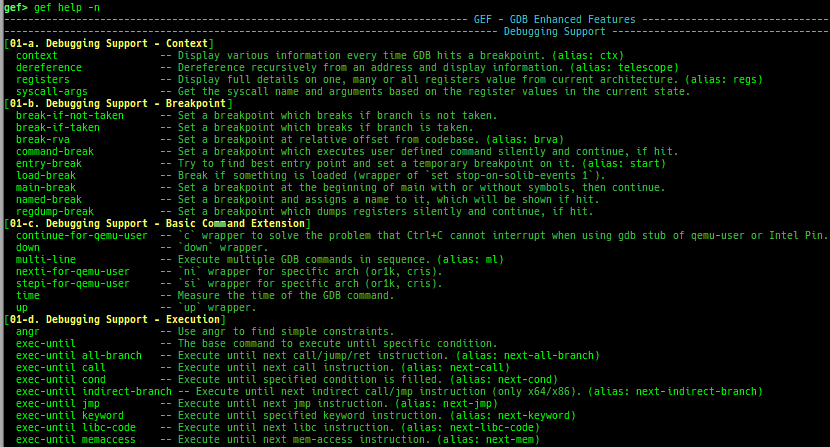
- The category is introduced in
gef help. - Combined into one file (from gef-extra). The followings are moved from gef-extras.
peek-pointers,current-stack-frame,xref-telescope,bytearray, andbincompare.- This is because a single file is more attractive than ease of maintenance.
- The system-call table used by
syscall-argsis moved from gef-extras.- It was updated up to linux kernel 6.7.4 for each architecture.
- Removed some features I don't use.
$,ida-interact,gef-remote,pie,pcustom,ksymaddr,trace-run,bufferize,output redirectandshellcode.
- Many bugs fix / formatting / made it easy for me to use.
- See docs/FAQ.md.
