为了识别 Myc 转录因子结合区域,我们可以使用 peak caller。
尽管 R 及更高版本中提供了许多峰值调用程序,但最受欢迎和使用最广泛的峰值调用程序仍然是 MACS2。
MACS2 通过几个简单的步骤调用峰值。
- 预测片段长度。
- 将读数移动到预测片段的中心。
- 使用基于计数的统计扫描整个基因组并识别与对照样本相比富集的区域。
MACS2 没有 R 包(它刚刚发布,但我们还没有测试过)。可以使用 Anaconda 包存储库在 Mac 和 Linux 上安装它(不幸的是没有 Windows 实现)。 Anaconda 是一个巨大的版本控制包集合,可以通过 conda 包管理系统安装。使用 conda,可以轻松创建和管理其中包含各种不同包的环境。
虽然没有 MACS2 R 包,但我们可以使用 R 包 Herper 与 anaconda 包系统进行交互。这是我们在 BRC 创建的,是 Bioconductor 的一部分。
BiocManager::install("Herper")
library(Herper)
首先,我们将使用 Herper 通过 install_CondaTools 函数安装 MACS2。我们只需要告诉 install_CondaTools 你想要什么工具和你想要构建的环境的名称。
salmon_paths <- install_CondaTools(tools = "macs2", env = "ChIPseq_analysis")
salmon_paths要运行 MACS2,我们只需要提供。
- 用于查找富集区域的 BAM 文件。(在 -t 之后指定)
- 峰值呼叫的名称(在 –name 之后指定)。
- 将峰值写入的输出文件夹(在 –outdir 之后指定)。
- 可选,但强烈建议,我们可以确定要比较的控件(在 –c 之后指定)。
macs2 callpeak -t Sorted_Myc_MEL_1.bam
               –name Mel_Rep1
               –-outdir PeakDirectory
-c Sorted_Input_MEL.bam Herper 允许我们从 R 中运行 conda 包。MACS2 已安装到 ChIPseq_analysis 中。所以我们可以使用 with_CondaEnv() 从 R 中使用这个环境。
myChIP <- "Sorted_Myc_MEL_1.bam"
myControl <- "Sorted_Input_MEL.bam"

with_CondaEnv("ChIPseq_analysis",
                      system2(command="macs2",args =c("callpeak",
                      "-t", myChIP,
                      "-n", "Mel_Rep1",
                      "–-outdir","PeakDirectory",
                      "-c", myControl)),

stdout = TRUE))可以在我们指定的输出目录中找到 MACS 峰值调用,后缀和扩展名为“_peaks.xls”。
MACS 峰值以制表符分隔的文件形式出现,伪装成“.xls”。除了峰的基因组坐标外,这些文件还包含有关用于顶部峰调用的样本、参数和版本的有用信息。
macsPeaks <- "data/Mel1_peaks.xls"

macsPeaks_DF <- read.delim(macsPeaks)
macsPeaks_DF[1:8, ]
## [1] "# Command line: callpeak -t Sorted_Myc_MEL_1.bam -n Mel1 -c Sorted_Input_MEL.bam"
## [2] "# ARGUMENTS LIST:"
## [3] "# name = Mel1" ## [4] "# format = AUTO" ## [5] "# ChIP-seq file = ['Sorted_Myc_MEL_1.bam']" ## [6] "# control file = ['Sorted_Input_MEL.bam']" ## [7] "# effective genome size = 2.70e+09" ## [8] "# band width = 300"因此,我们可以使用 read.delim 函数导入峰值文件。请注意,我们已将 comment.char 参数设置为 # 以排除有关存储在 MACS 峰值文件中的峰值调用参数的附加信息。
macsPeaks <- "data/Mel1_peaks.xls"

macsPeaks_DF <- read.delim(macsPeaks, comment.char = "#")
macsPeaks_DF[1:2, ]
##    chr   start     end length abs_summit pileup X.log10.pvalue. fold_enrichment
## 1 chr1 4785371 4785642    272    4785563  20.89        10.66553         5.33590
## 2 chr1 5082993 5083247    255    5083123  33.42        12.68072         4.30257
##   X.log10.qvalue.        name
## 1         7.37727 Mel1_peak_1
## 2         9.27344 Mel1_peak_2
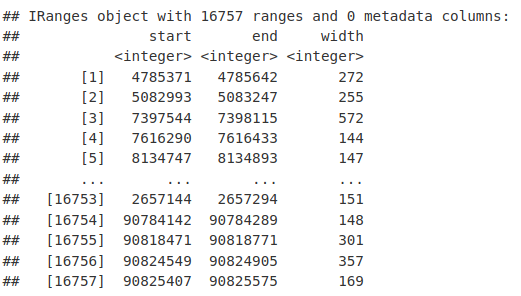
现在我们在表中有了信息,我们可以创建一个 GRanges 对象。GRanges 对象由存储为 IRanges 的染色体名称和间隔组成。
library(GenomicRanges)
macsPeaks_GR <- GRanges(seqnames = macsPeaks_DF[, "chr"], IRanges(macsPeaks_DF[,
    "start"], macsPeaks_DF[, "end"]))
macsPeaks_GR
## GRanges object with 16757 ranges and 0 metadata columns:
##           seqnames            ranges strand
##              <Rle>         <IRanges>  <Rle>
##       [1]     chr1   4785371-4785642      *
##       [2]     chr1   5082993-5083247      *
##       [3]     chr1   7397544-7398115      *
##       [4]     chr1   7616290-7616433      *
##       [5]     chr1   8134747-8134893      *
##       ...      ...               ...    ...
##   [16753]     chrY   2657144-2657294      *
##   [16754]     chrY 90784142-90784289      *
##   [16755]     chrY 90818471-90818771      *
##   [16756]     chrY 90824549-90824905      *
##   [16757]     chrY 90825407-90825575      *
##   -------
## seqinfo: 21 sequences from an unspecified genome; no seqlengths正如我们之前所见,可以使用各种 GRanges 函数访问和设置 GRanges 中的元素。在这里,我们可以将我们的对象解构回重叠群名称和区间范围。
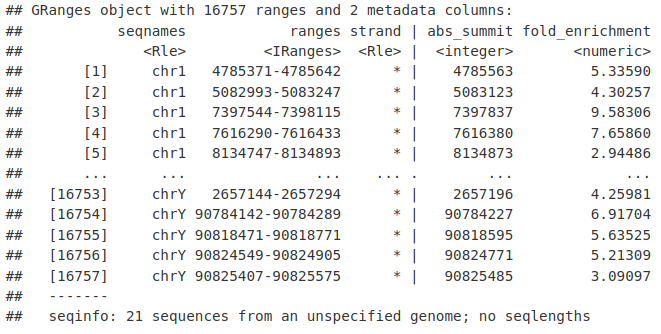
seqnames(macsPeaks_GR)ranges(macsPeaks_GR)GRanges 对象可能附加了元数据。在这里,我们附加了一些关于我们的峰的有用信息,包括峰顶位置和输入的折叠富集。
mcols(macsPeaks_GR) <- macsPeaks_DF[, c("abs_summit", "fold_enrichment")]
macsPeaks_GRMACS2 输出目录中还包含一个“.narrowPeak”文件。这是一种间隔/床文件,正如我们之前所做的那样,我们可以使用 rtracklayer 包导入这些文件。 “格式”参数必须设置为“窄峰”。
library(rtracklayer)
macsPeaks_GR_np <- import("data/Mel1_peaks.narrowPeak", format = "narrowPeak")
macsPeaks_GR_np
## GRanges object with 16757 ranges and 6 metadata columns:
##           seqnames            ranges strand |            name     score
##              <Rle>         <IRanges>  <Rle> |     <character> <numeric>
##       [1]     chr1   4785371-4785642      * |     Mel1_peak_1        73
##       [2]     chr1   5082993-5083247      * |     Mel1_peak_2        92
##       [3]     chr1   7397544-7398115      * |     Mel1_peak_3       222
##       [4]     chr1   7616290-7616433      * |     Mel1_peak_4        73
##       [5]     chr1   8134747-8134893      * |     Mel1_peak_5        29
##       ...      ...               ...    ... .             ...       ...
##   [16753]     chrY   2657144-2657294      * | Mel1_peak_16753        21
##   [16754]     chrY 90784142-90784289      * | Mel1_peak_16754       160
##   [16755]     chrY 90818471-90818771      * | Mel1_peak_16755        74
##   [16756]     chrY 90824549-90824905      * | Mel1_peak_16756        92
##   [16757]     chrY 90825407-90825575      * | Mel1_peak_16757        24
##           signalValue    pValue    qValue      peak
##             <numeric> <numeric> <numeric> <integer>
##       [1]     5.33590  10.66553   7.37727       192
##       [2]     4.30257  12.68072   9.27344       130
##       [3]     9.58306  26.16516  22.20383       293
##       [4]     7.65860  10.68563   7.39636        90
##       [5]     2.94486   5.86828   2.96627       126
##       ...         ...       ...       ...       ...
##   [16753]     4.25981   4.98931   2.19466        52
##   [16754]     6.91704  19.76291  16.02769        85
##   [16755]     5.63525  10.73033   7.44072       124
##   [16756]     5.21309  12.62006   9.21552       222
##   [16757]     3.09097   5.26630   2.43505        78
##   -------
## seqinfo: 21 sequences from an unspecified genome; no seqlengths在任何下游分析之前,我们将希望删除与黑名单区域重叠的任何峰。我们可以使用与 GRanges 对象的简单重叠来做到这一点。
library(rtracklayer)
blkList <- import.bed(toBlkList)
macsPeaks_GR <- macsPeaks_GR[!macsPeaks_GR %over% blkList]

