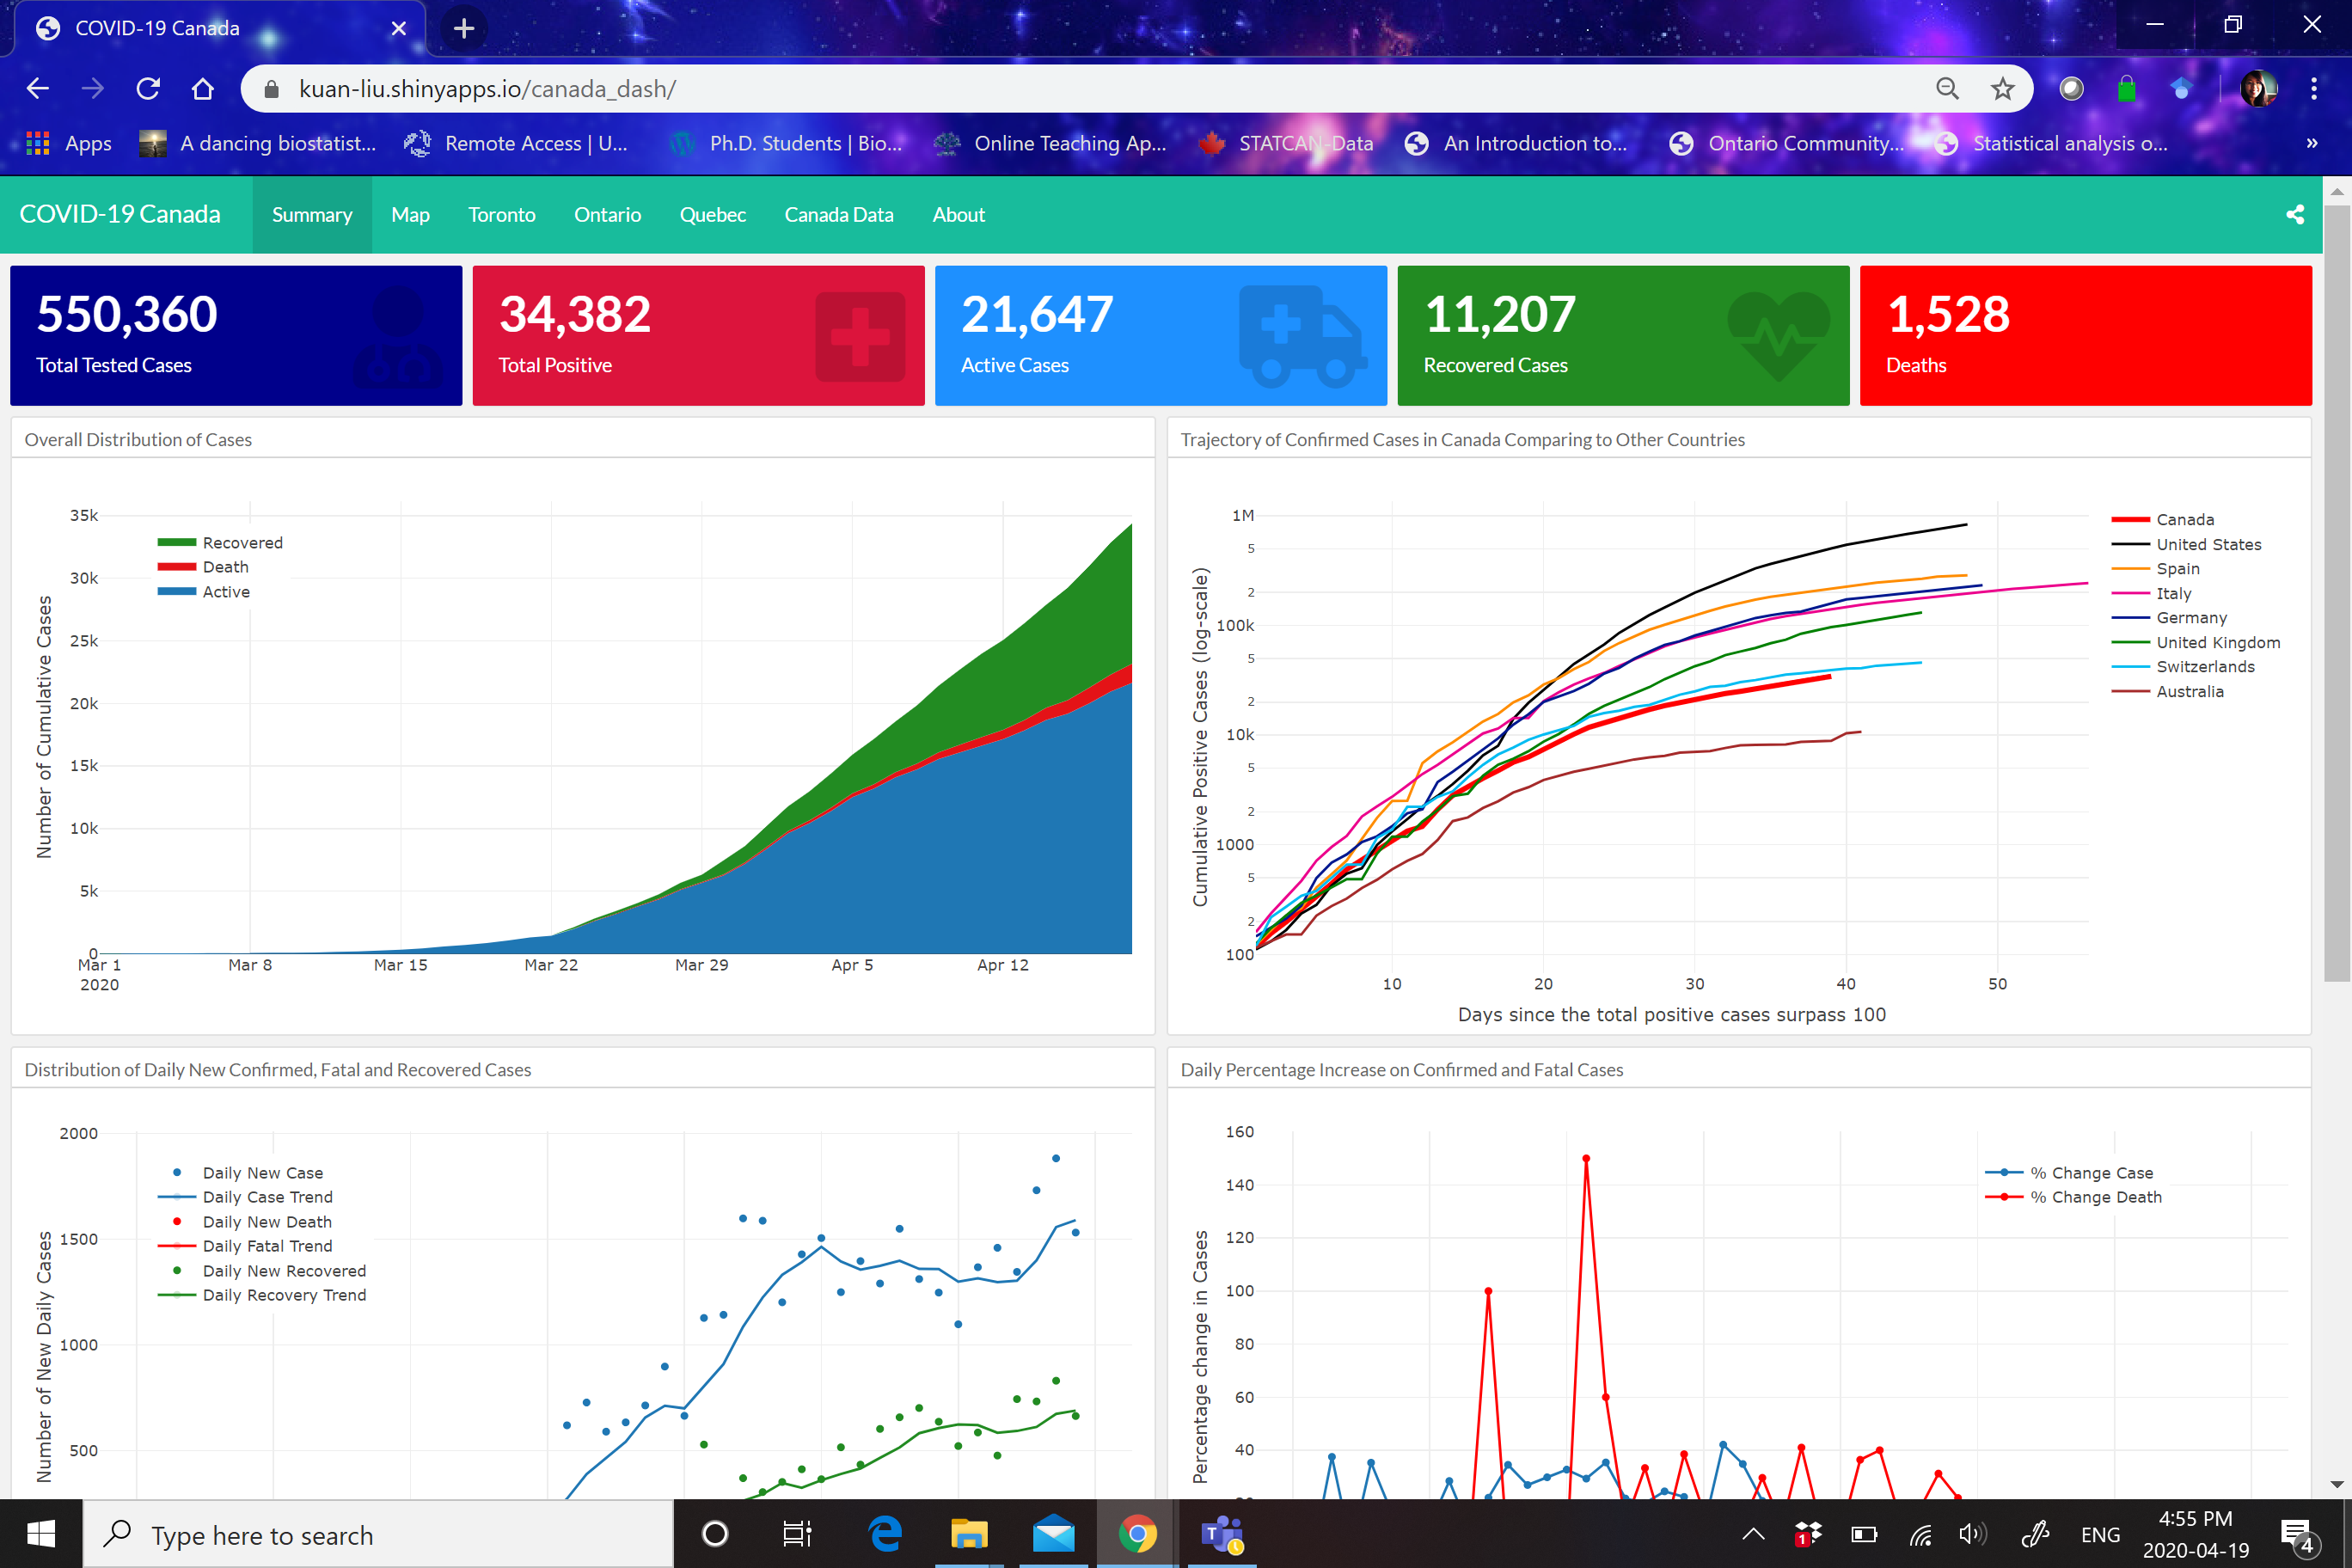
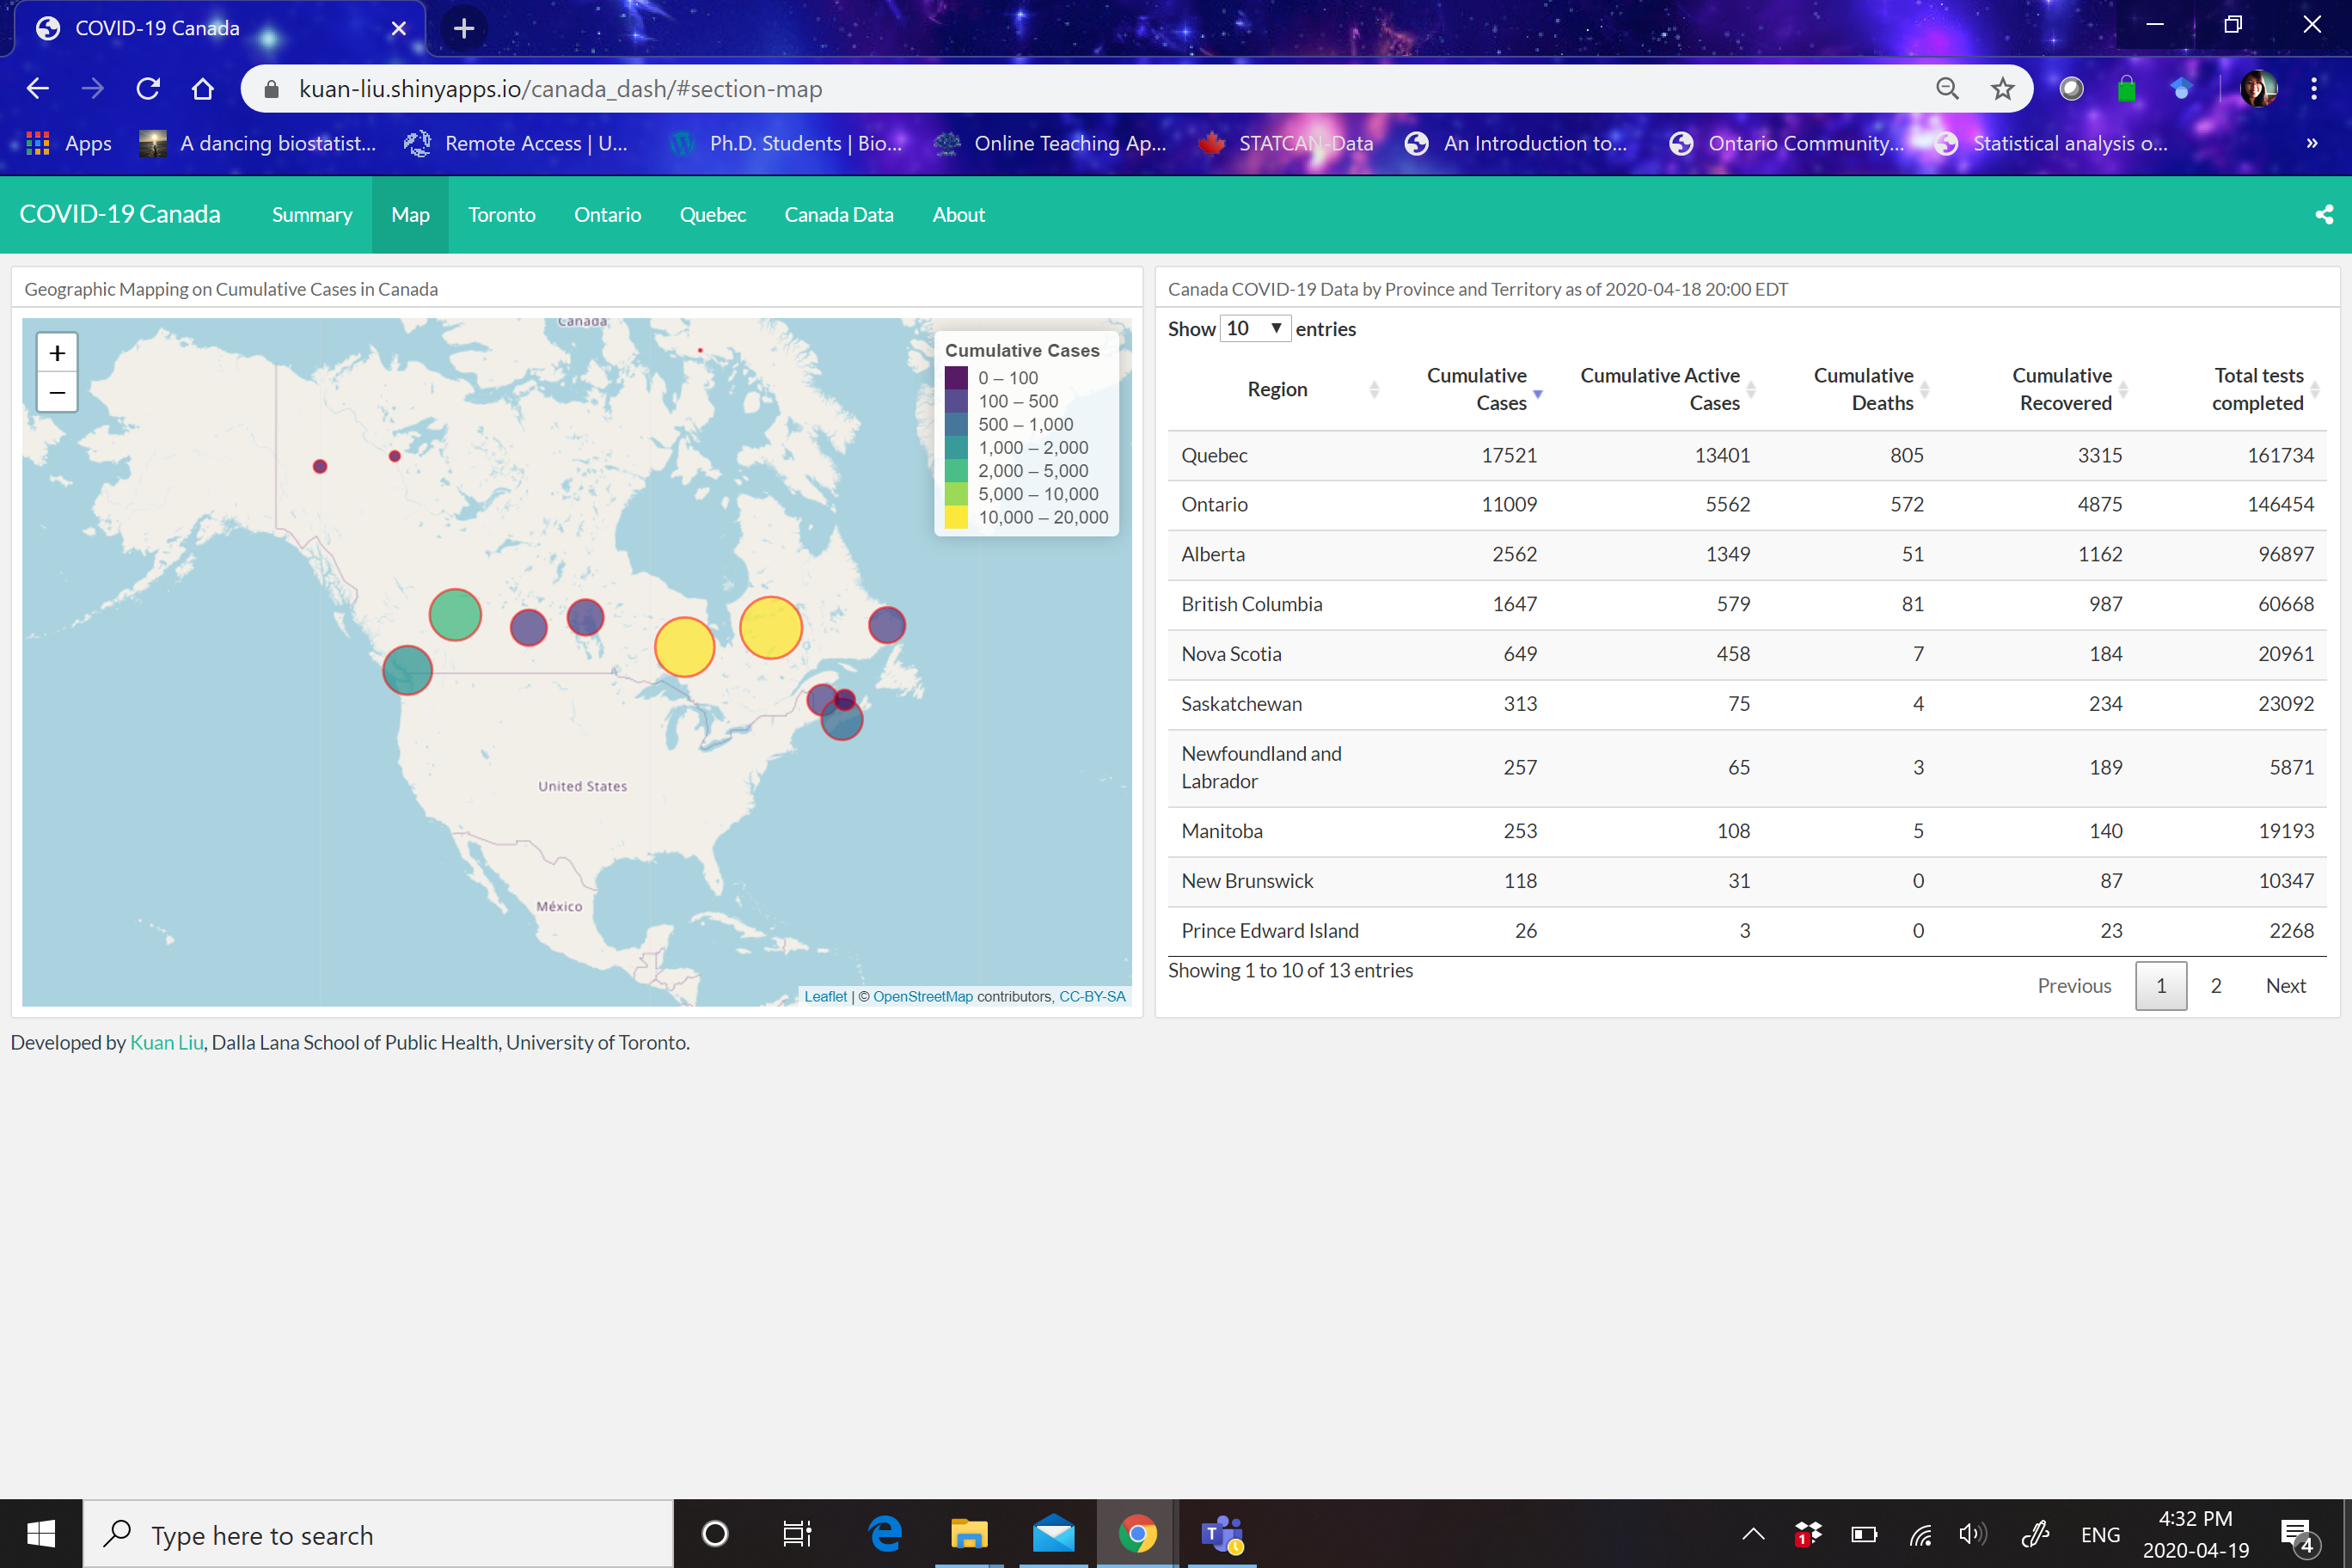
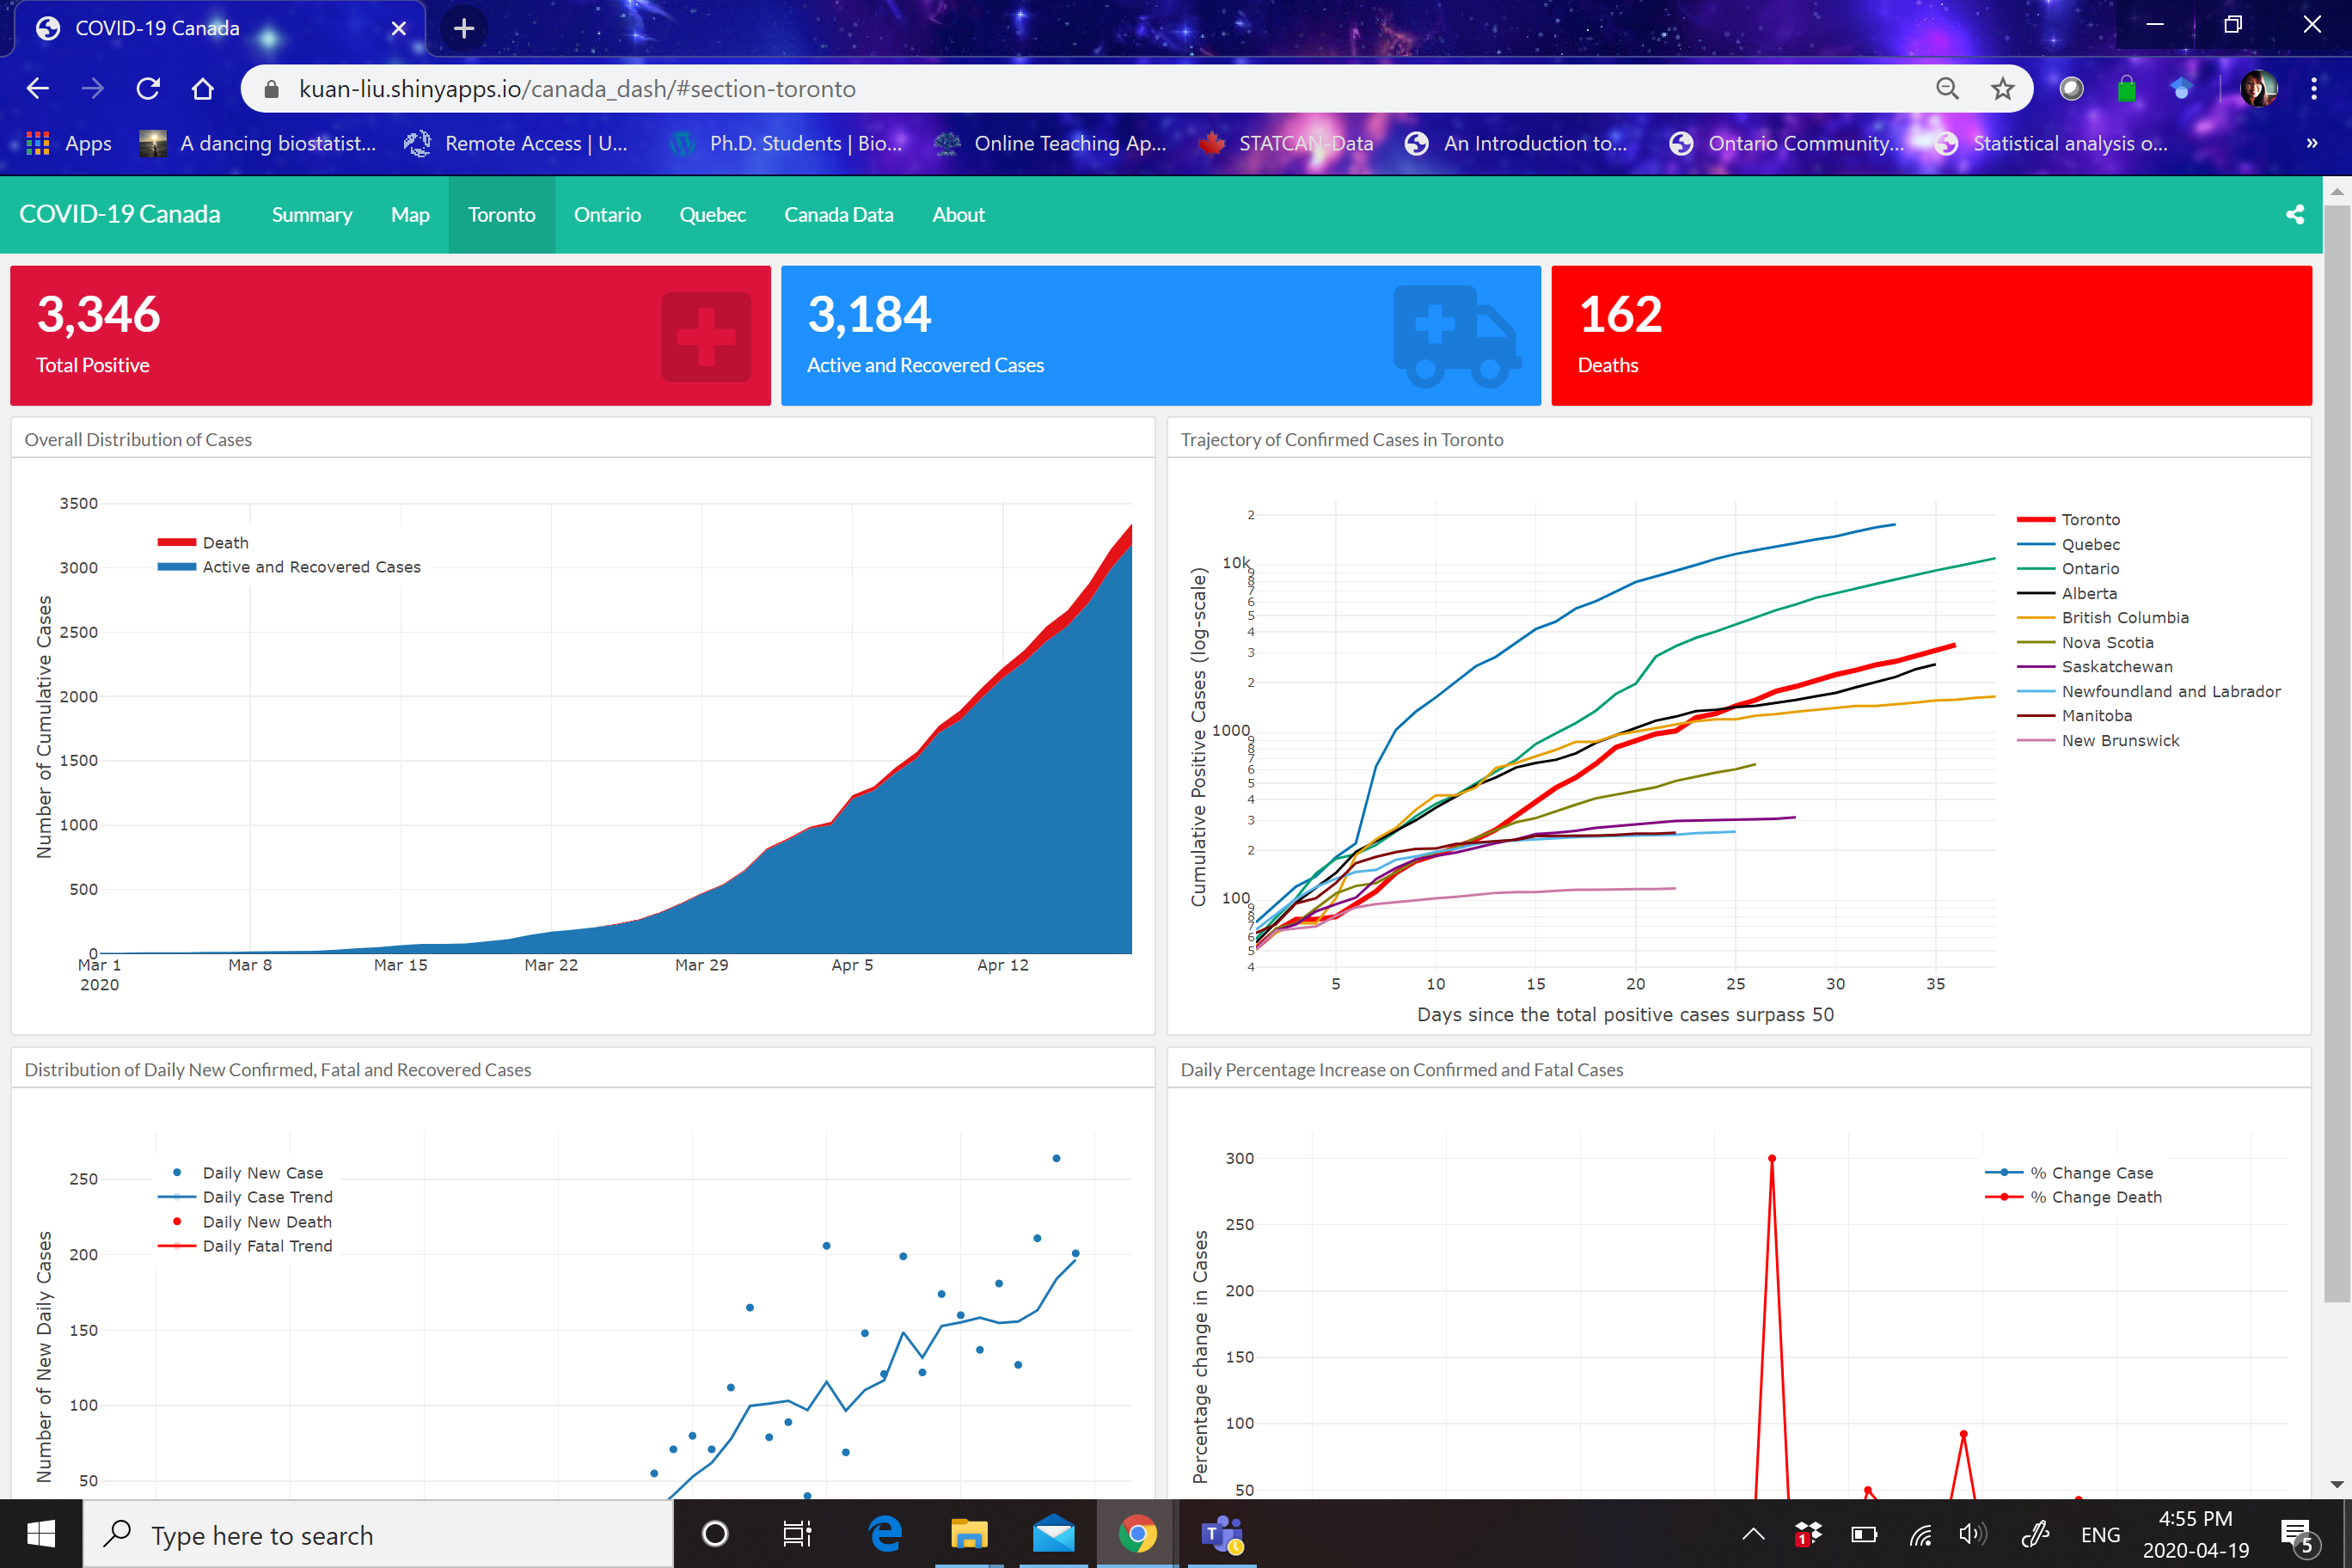
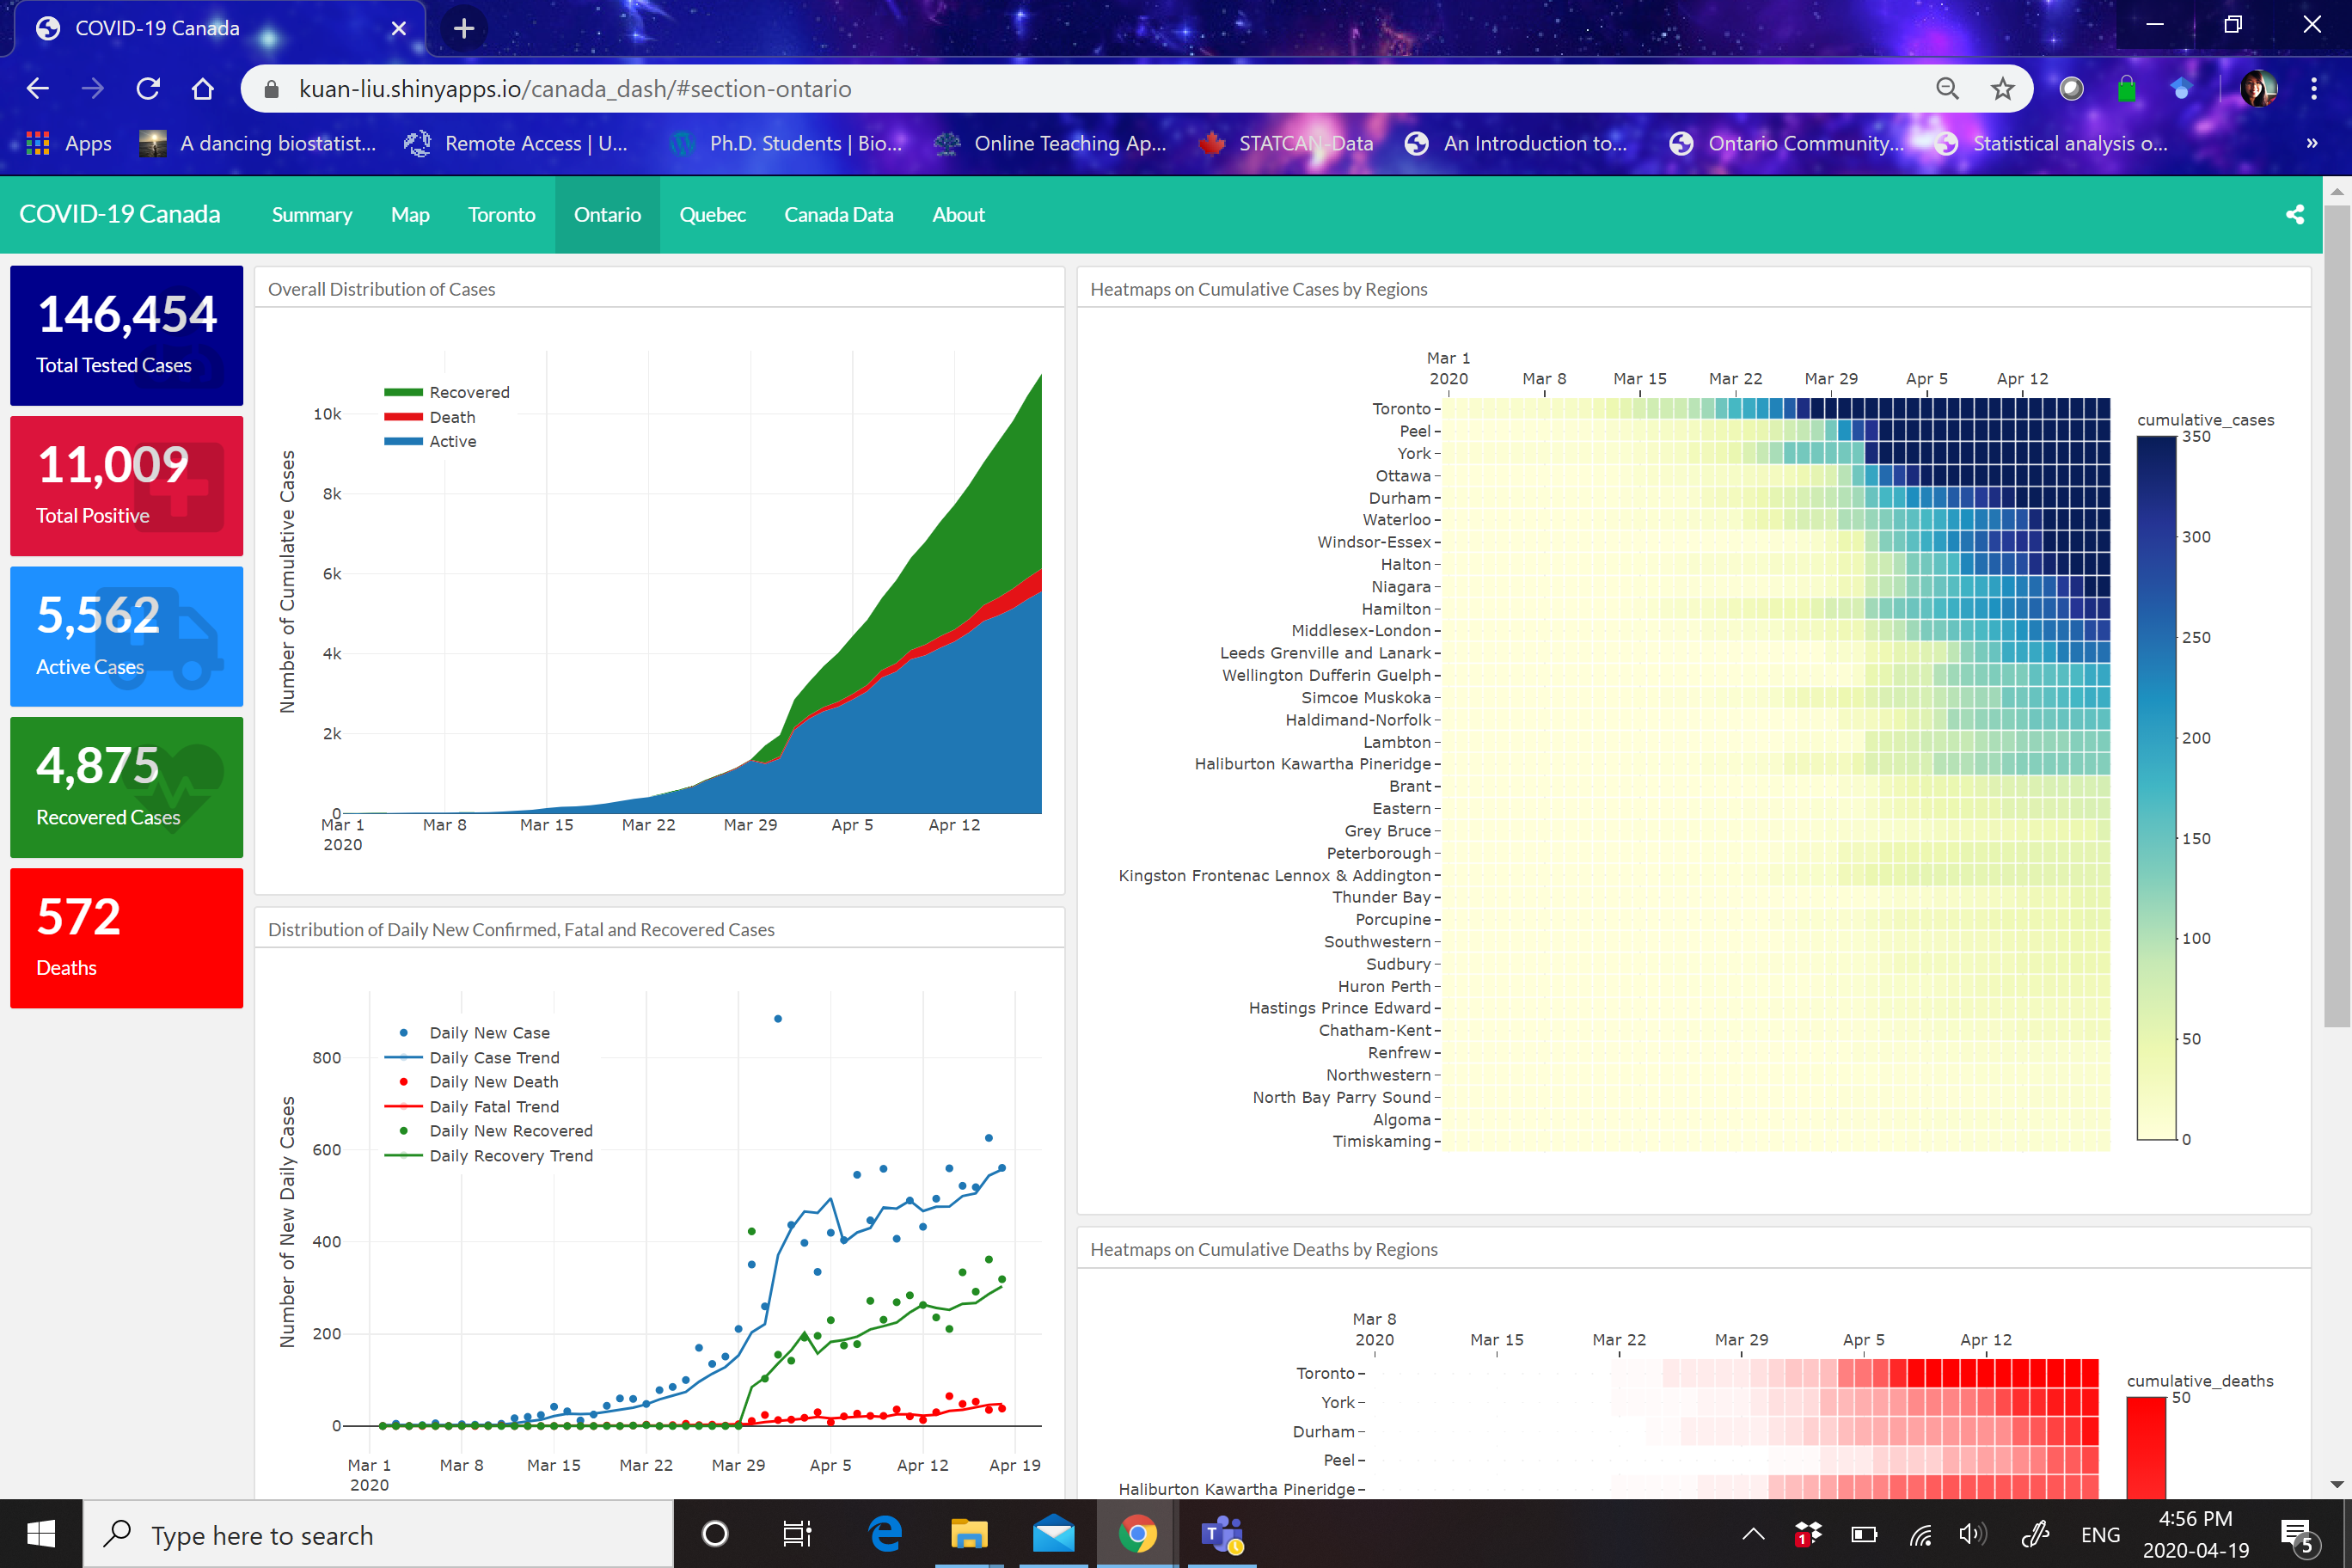
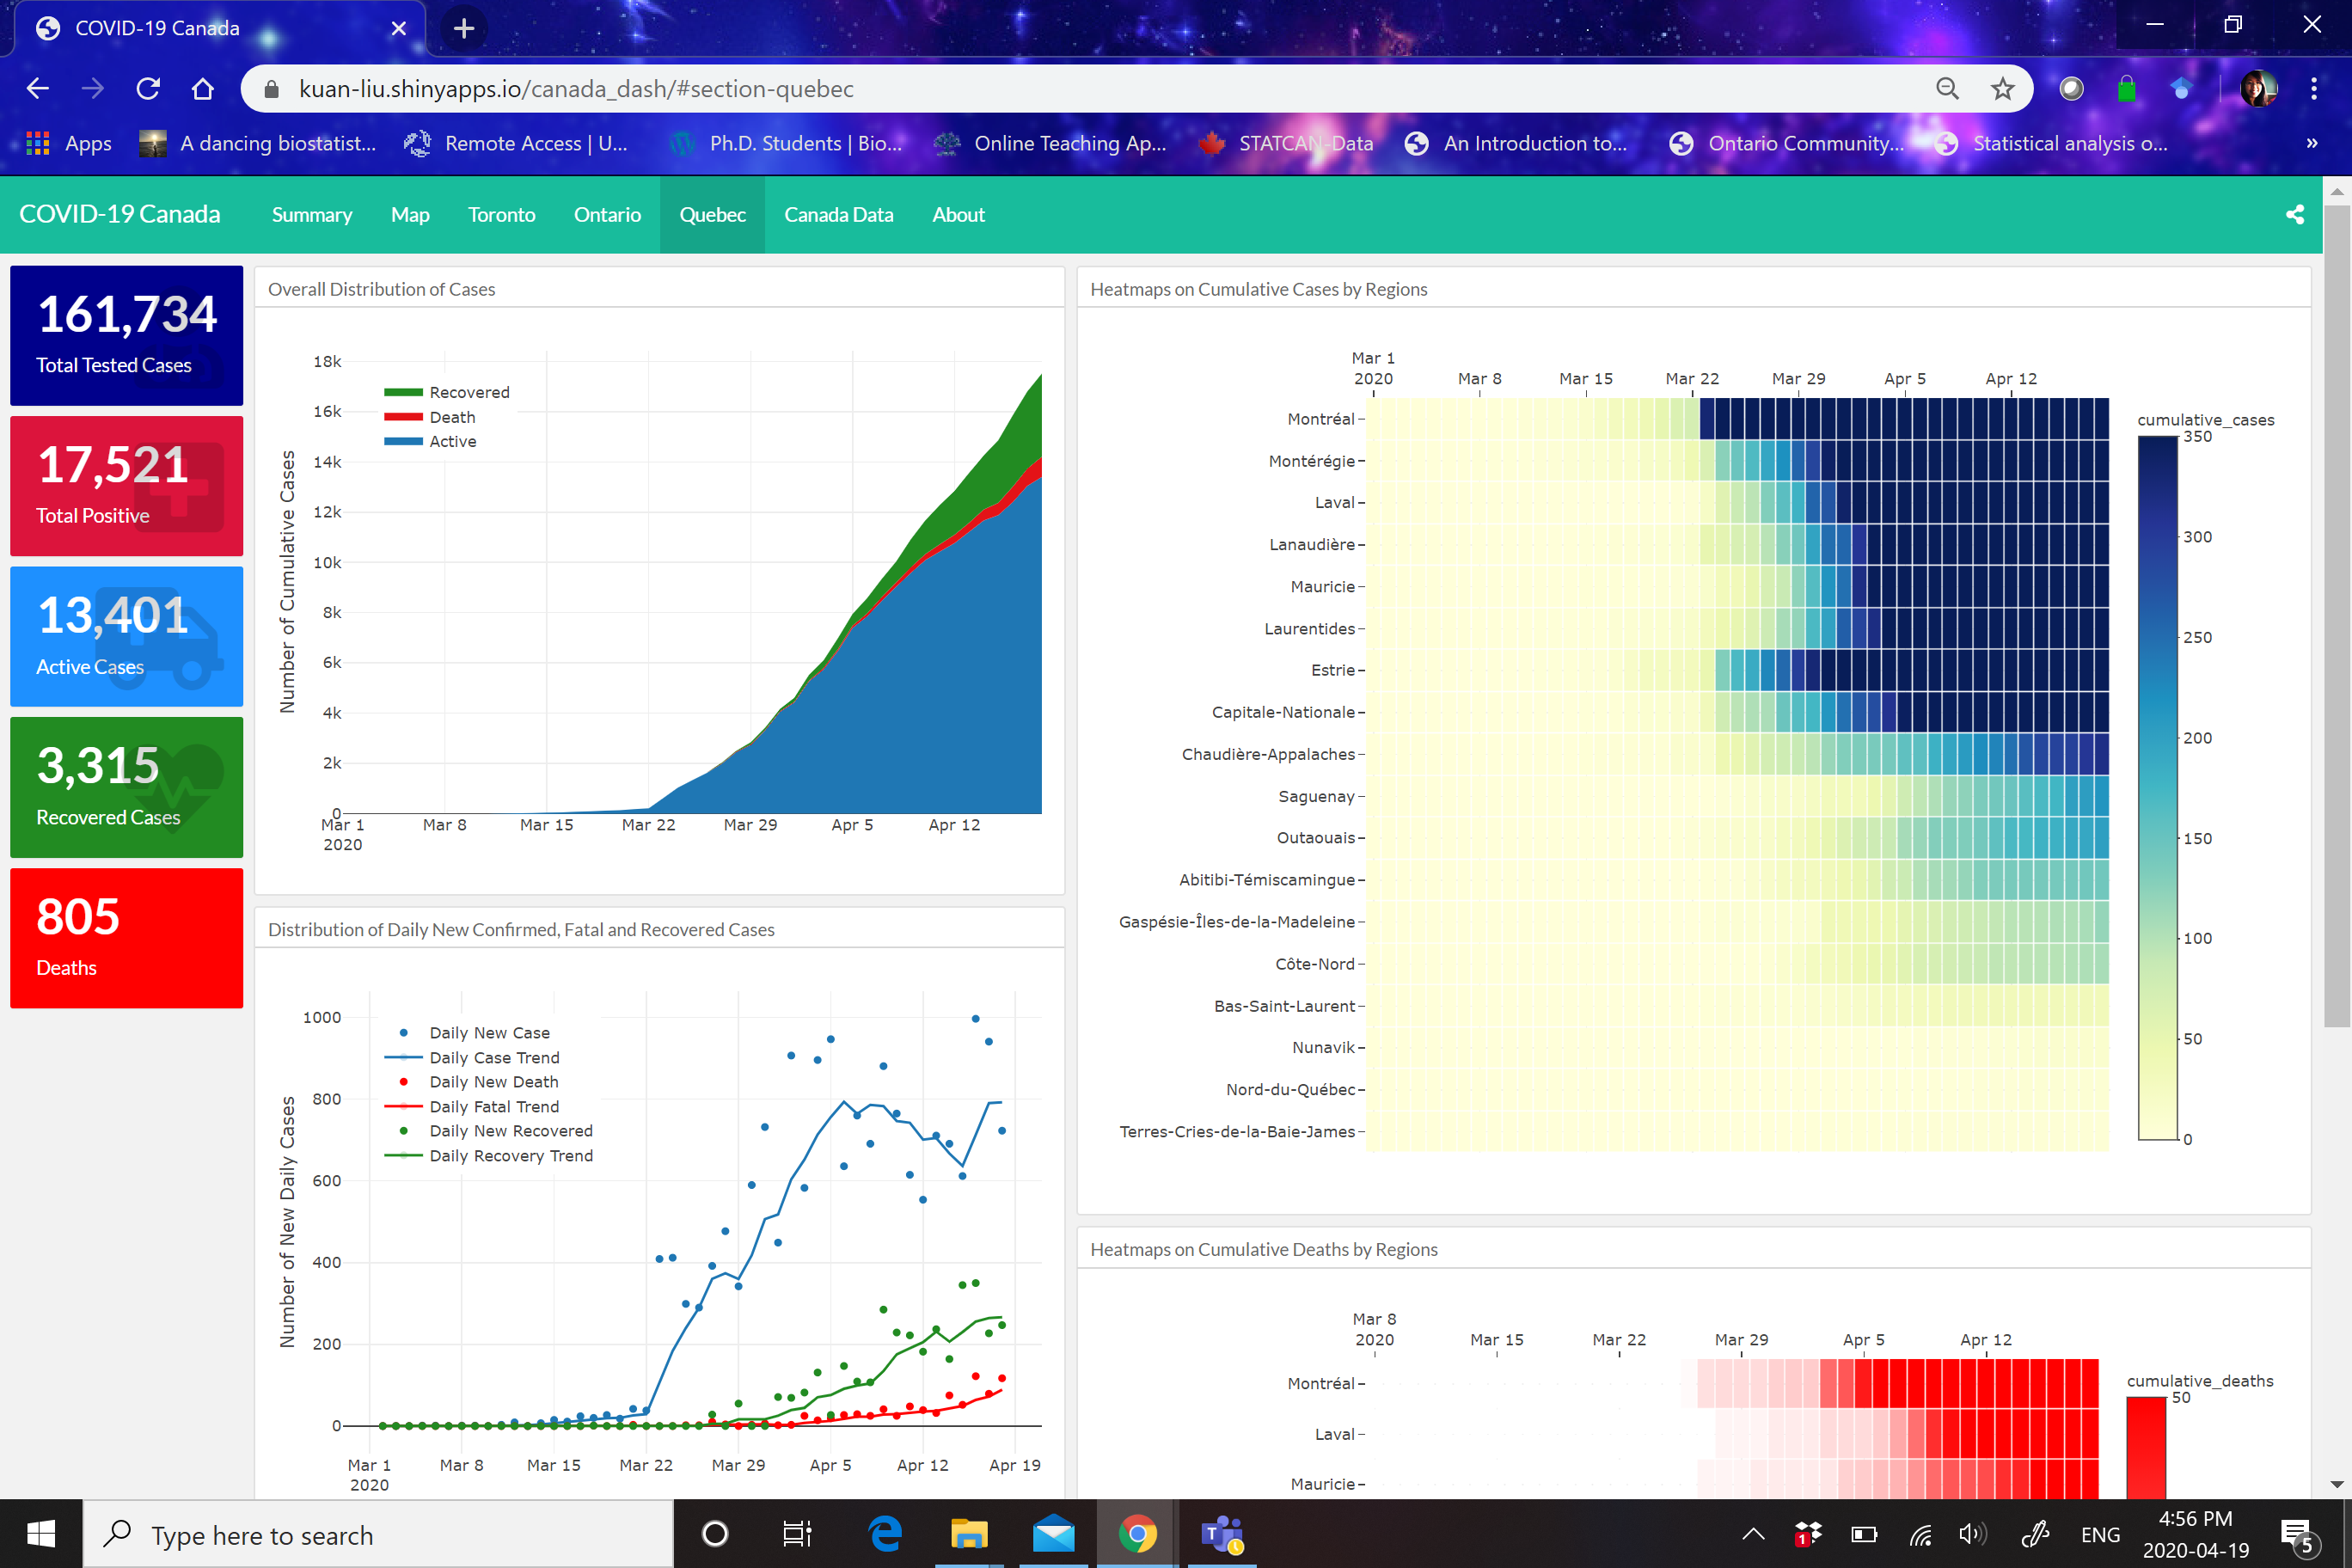
You can view the dashboard online at https://kuan-liu.shinyapps.io/canada_dash/.
I am excited to share with everyone, Rose Garrett, my academic sister will be joining me to improve this dashboard. Rose is a second year PhD student in Biostatistics at DLSPH, University of Toronto, also under the supervision of Dr. Eleanor Pullenayegum at Sickkids. Rose will create new visualization figures for us. Stay tuned!
Thank you for your interest in my new data visualization project. There are many great COVID-19 Canada dashboards available online. I have compiled the following list to show some of the dashboards that inspired me to build this one.
-
The COVID-19 Canada Open Data Working Groups dashboard made by Jean-Paul R. Soucy and Isha Berry, two amazing talented students from my school, DLSPH, at Univerity of Toronto.
-
The Covid19 Italy dashboard by Rami Krispin. I used Rami’s R markdown code for this dashboard.
-
The PHAC COVID-19 Canada dashboard, most accurate and reliable info on Canadian COVID-19 epidemiology data.
-
The Ontario-specific COVID-19 Analysis Website which covers detailed Ontario focused analytical information on critical care analysis, health region analysis and testing analysis. This website I believe was also built by a group of University of Toronto students.
Using the four COVID-19 Canada Open Data Working Group’s spreadsheets on cases, mortality, recovery and testing at https://github.com/ishaberry/Covid19Canada, I created an aggregated Canada COVID-19 daily data. You can view this data on the data page of this dash.
Last but not least, I want to give a shout-out to Marc-Olivier Hétu whom I met on twitter. He has been scraping public COVID-19 Canada data since March and compiled an outstanding spreadsheet with graphic analysis, which he generiously shared with me, because he said he’s glad that more people get to use his data to build tools. I have adopted one of Marc’s special figure on this dash and I named it the Marc-Olivier figure to carry on the legacy.
Acknowledgement
- Data
- Canada data used in this dashboard are extracted from the data
posted by the COVID-19 Canada Open Data Working Group
(https://github.com/ishaberry/Covid19Canada) lead by
Jean-Paul R. Soucy and Isha
Berry. Since April 1st, the
working group collected and reported case and mortality data
directly from Public Health Units. Thus, the case and mortality
numbers reported may be higher than those from other sources,
incuding the Ontario Ministry of Health. We direct readers to
their dashboard website, About the data
section for
details.
- We want to express our sincere appreciation to all contributors of the COVID-19 Canada Open Data Working Group. Here is a list of contributors we want to pay special tribute to Isha Berry, Jean-Paul R. Soucy, Kamal Acharya, Gabrielle Brankston, Vinyas Harish, Kathy Kornas, Thivya Naganathan, Lindsay Obress, Meghan O’Neill, Tanya Rossi, Alison Simmons, Shelby Sturrock, Matthew Van Camp, James E.Wright and Wendy Xie.
- World data used in this dashboard are from the R package coronavirus developed by Rami Krispin which is generated from the Johns Hopkins University Center for Systems Science and Engineering (JHU CCSE) Coronavirus website.
- Canada data used in this dashboard are extracted from the data
posted by the COVID-19 Canada Open Data Working Group
(https://github.com/ishaberry/Covid19Canada) lead by
Jean-Paul R. Soucy and Isha
Berry. Since April 1st, the
working group collected and reported case and mortality data
directly from Public Health Units. Thus, the case and mortality
numbers reported may be higher than those from other sources,
incuding the Ontario Ministry of Health. We direct readers to
their dashboard website, About the data
section for
details.
- Dashboard R code
- I built this dashboard using Rami Krispin’s Covid19 Italy dashboard’s code as template. Rami’s code can be found on his github page.
- Special thanks to my supervisor Dr. Eleanor Pullenayegum at Sickkids for her support on all my COVID-19 projects!
I would not have made this bashboard if not for the work of the above team and individuals. You can find the code of this dashboard at https://github.com/Kuan-Liu/canada_dash.
Feedbacks
Please feel free to reach me at kuan.liu@mail.utoronto.ca. You can also find me on Twitter.
