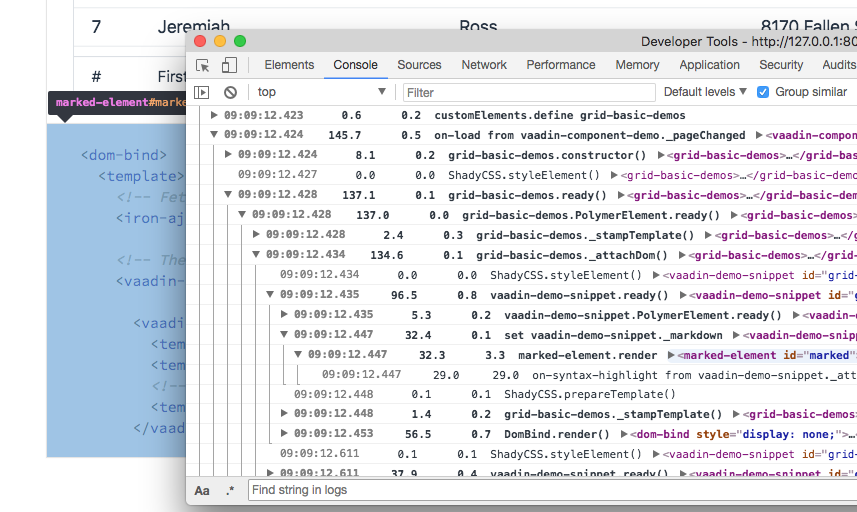
Console-based profiler for Polymer elements and applications
- Add
<script src="profiler.js">to your HTML page, preferably right after loading WebComponents polyfills but before loading anything related to Polymer. - Open the page in a browser and perform the action for which you want to collect profiling data. If you want to omit profiler data collected since the page was loaded, you can open the browser's console and run
profiler.clearEvents(). It's recommended to close the console after doing this to avoid the overhead that can be observed in some browsers while the console is open. - Open the browser's console and run
profiler.showTimeline()for printing a drill-down timeline of all the collected profiling data orprofiler.showSummaries()to print profiling data summaries sorted in a couple of different ways. - Fix you code based to avoid the slow parts that you have discovered.
profiler.js wraps various JavaScript functions to collect timing information for how long time it takes to run the wrapped function. Some functions are also wrapped to be able to discover additional functions to wrap once they have been defined.
Furthermore, some functions such as setTimeout are also wrapped to wrap the provided callback to collect profiling data once actually run.
This project is currently a rough prototype. Some ideas for future improvements include:
- Split out a generic profiler API for injecting probes and displaying the collected profiler data.
- Allow the user to add their own profiling data collectors to their own code.
- Enables using the profiler with other frameworks instead of Polymer.
- Convert into a proper Bower package. Right now, the expectation is that the user will still have to customize some things, and will therefore just copy the file into their own application.
- Define custom probes for more Polymer elements
- Refactor to use proper JS objects instead of using array indices for properties
- Improvements to how the collected data can be analyzed
- Show the data in the DOM (e.g. a hierarchical
<vaadin-grid>) instead of relying on the slightly limitingconsoleAPI. - Dump the data as e.g. JSON to allow external visualisation
- Allow filtering the timeline
- Additional categories for the summary, e.g. average run time
- Show the data in the DOM (e.g. a hierarchical
