How to construct a comparision between population simulations? #380
Comments
|
The version is PK-Sim 8.0 |
|
@wangwei1619 What parameters did you select in |
|
Also please check the docs here for more info https://docs.open-systems-pharmacology.org/working-with-pk-sim/pk-sim-documentation/pk-sim-simulations#comparison-chart-for-individual-or-population-simulations-in-one-plot |
|
I just select plasma concentration in 'Output' and no parameter in 'Population Parameters' like this |


|
Is there a way you can attach the project so that I can check what's going on? |
|
Here is the link: https://github.com/wangwei1619/Learnin-PBPK-PK-Sim |
|
Hi, @msevestre .Thanks for your zealous concern on my question. Is there anything wrong in my work? |
|
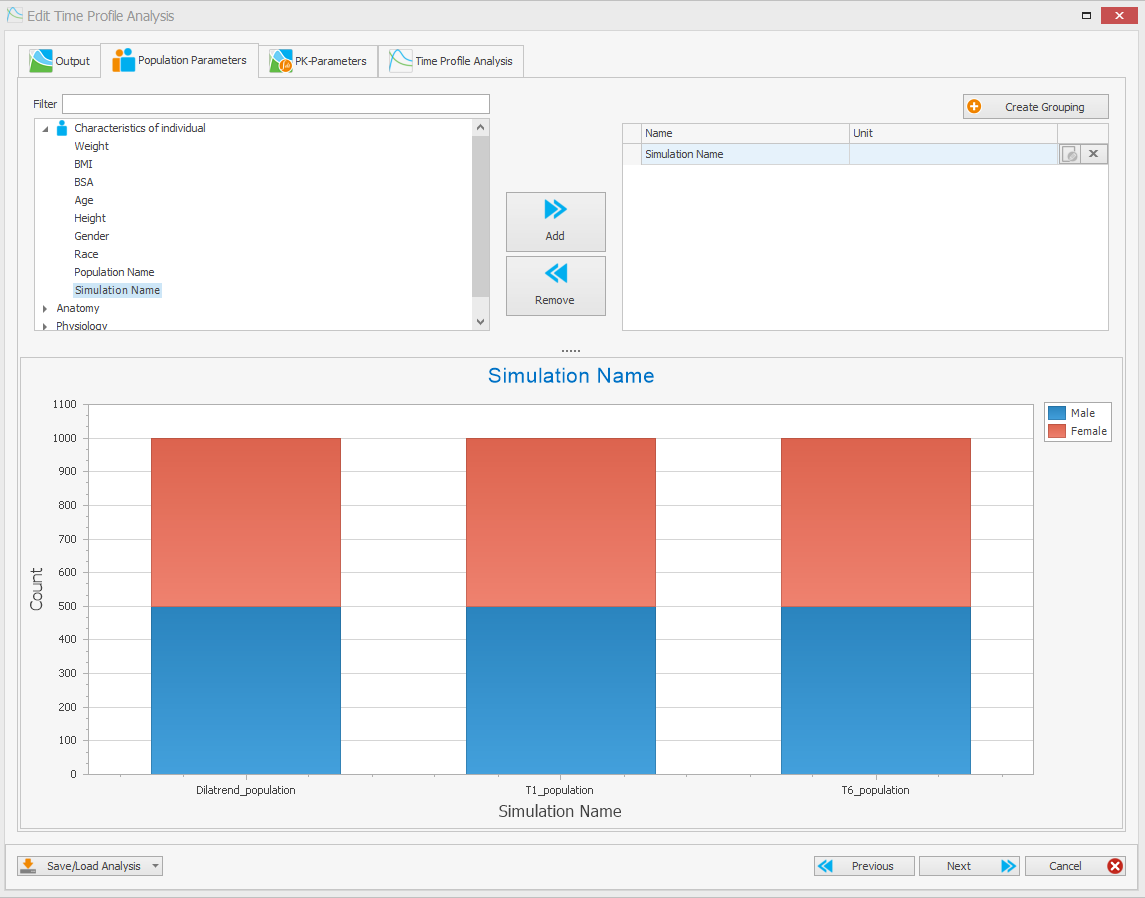
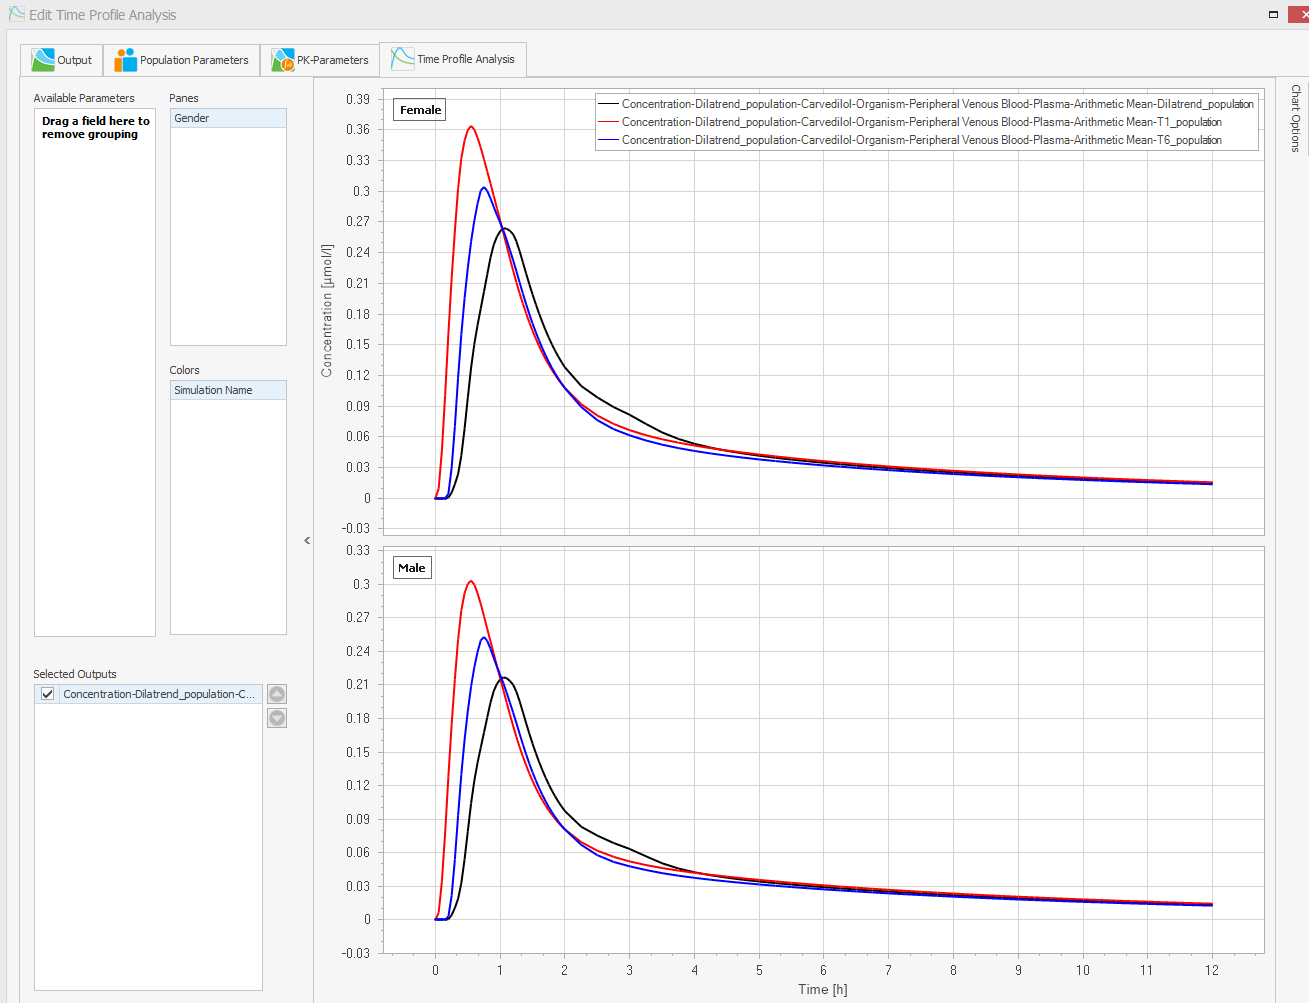
Hi @wangwei1619 So select the simulation name as a grouping parameter like so and group by simulation name like so You can also split by pane for example or by gender The sky is the limit. If you do not tell PK-Sim how you want to split your data, it will just aggregate all the data as one dataset and calculate the mean above all simulations. Useful sometimes, but now what you want |


|
Thank you so much! It hides there! |
Hi, all,
I have three simulations for three kinds of formations of the same molecule on one defined population, but I can't compare them or put them in one plot. Do I neglect something?
The text was updated successfully, but these errors were encountered: