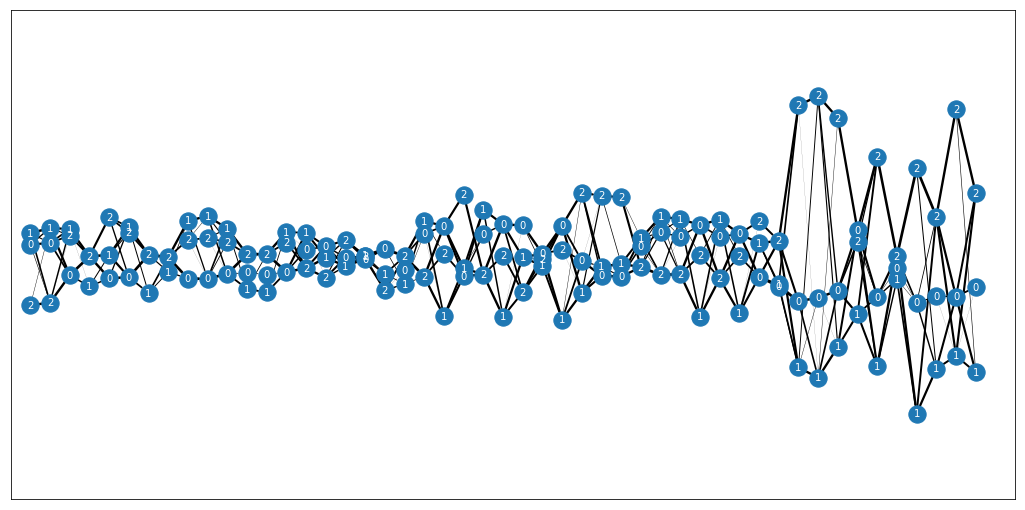
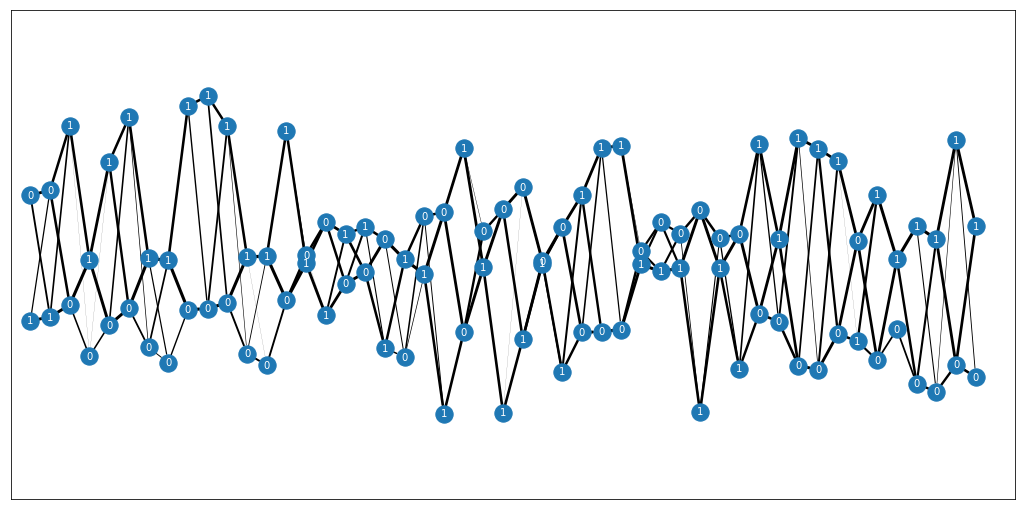
Textile plot python implementation. Original C file can be found under textile_c/.
Original paper:
Kumasaka, Natsuhiko and Shibata, Ritei. High-Dimensional Data Visualisation: The Textile Plot. 2008. Comput. Stat. Data Anal.
Genetic application:
Kumasaka, Natsuhiko; Nakamura, Yusuke and Kamatani, Naoyuki. The Textile Plot: A New Linkage Disequilibrium Display of Multiple-Single Nucleotide Polymorphism Genotype Data. 2010. PLOS ONE.
The implementation depends on whether data is missing or not (no missing = faster).
The input is a n x p numpy matrix and an indicator list of length p to determine which variables are categorical.
ie. [False, True, False] indicates the second variable is categorical. Use None instead of a list to indicate no categorical variables. Pass the string "all" to indicate they all are categorical.
Included are the original dataset found in the original C code (has missing data) as well as the Iris dataset which is used as an example in the original paper (no missing data).
labels, X, is_categorical = get_example_data()
Y = textile_transform(X, is_categorical)
labels, X, is_categorical = get_iris_data()
Y = textile_transform(X, is_categorical)
This implementation produces the same location (α) and scale (β) parameters for the Iris dataset as noted in the original paper:
α=[−41.22766, −190.56643, 106.09412, −65.95838, −47.63126]
β=[50.57710, 73.10587, 32.61262, −34.70152, 17.55146, 39.71478]
A framework for variant-based textile plots is included in this script. To run an example:
- Generate a genotype plot using 1000Genomes data:
import matplotlib.pyplot as plt
vcf_records=get_1kgenome_data()
plt.figure(figsize=(18,9))
genotype_textile(vcf_records, plot=True, haplotype=False, set_missing_to_ref=True)
- A haplotype plot can also be generated using
haplotype=True:

