-
Notifications
You must be signed in to change notification settings - Fork 2
New issue
Have a question about this project? Sign up for a free GitHub account to open an issue and contact its maintainers and the community.
By clicking “Sign up for GitHub”, you agree to our terms of service and privacy statement. We’ll occasionally send you account related emails.
Already on GitHub? Sign in to your account
Migrate segments to SoA+PortableCollection #93
Migrate segments to SoA+PortableCollection #93
Conversation
|
/run standalone |
|
There was a problem while building and running in standalone mode. The logs can be found here. |
|
/run standalone |
|
There was a problem while building and running in standalone mode. The logs can be found here. |
|
/run standalone |
|
There was a problem while building and running in standalone mode. The logs can be found here. |
|
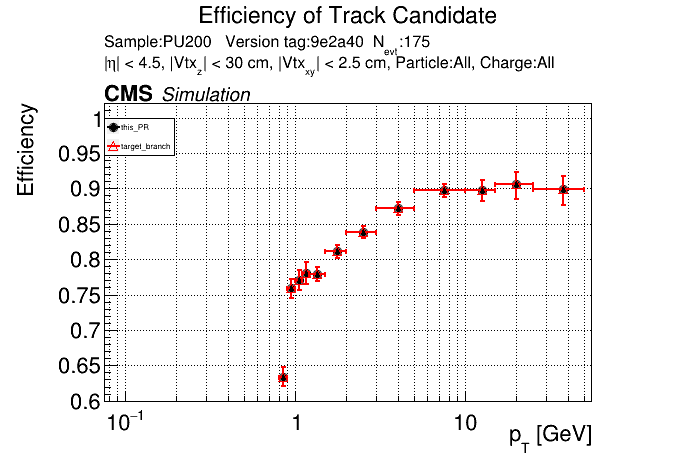
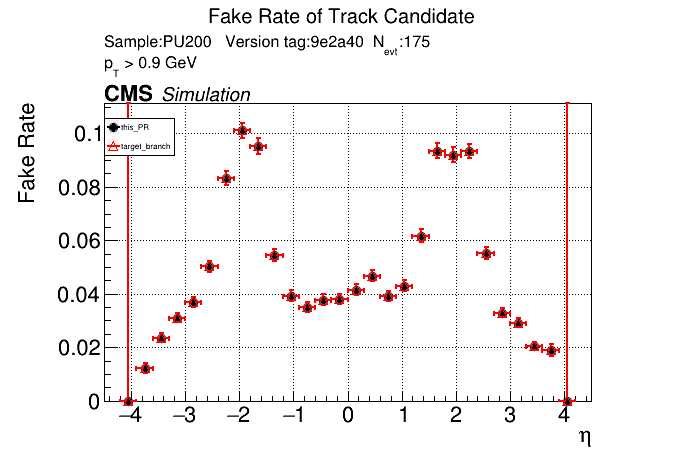
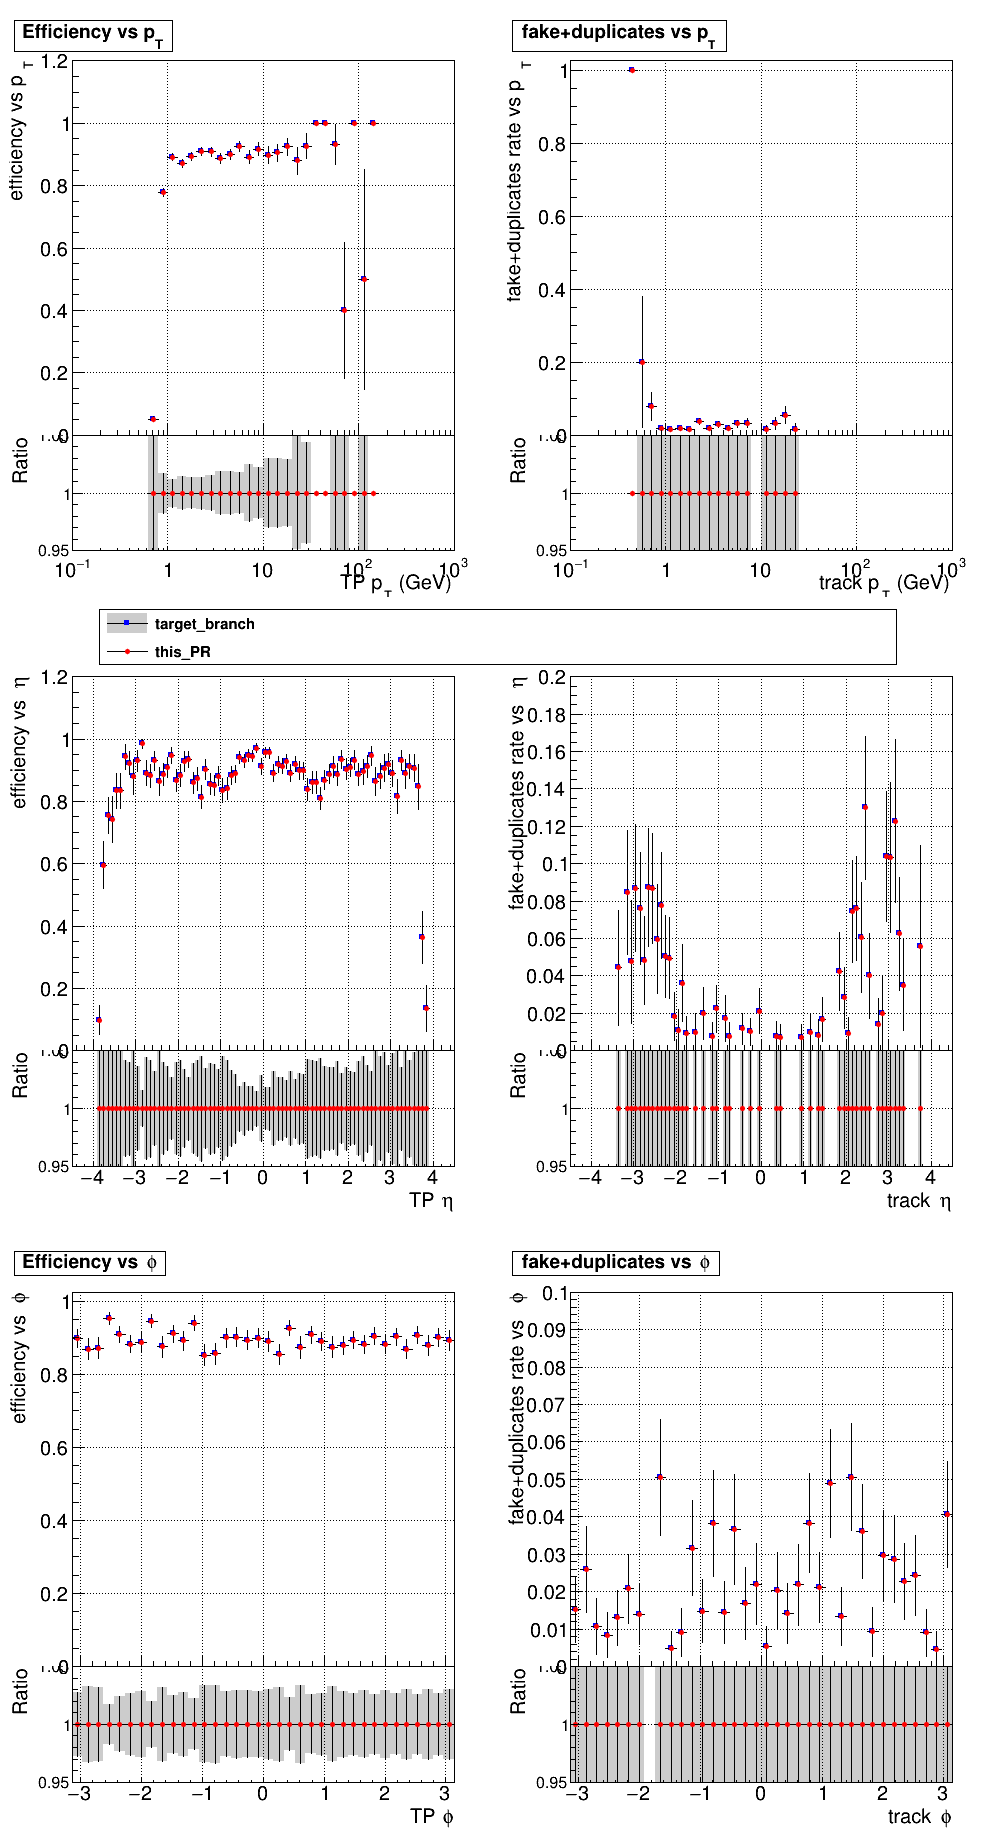
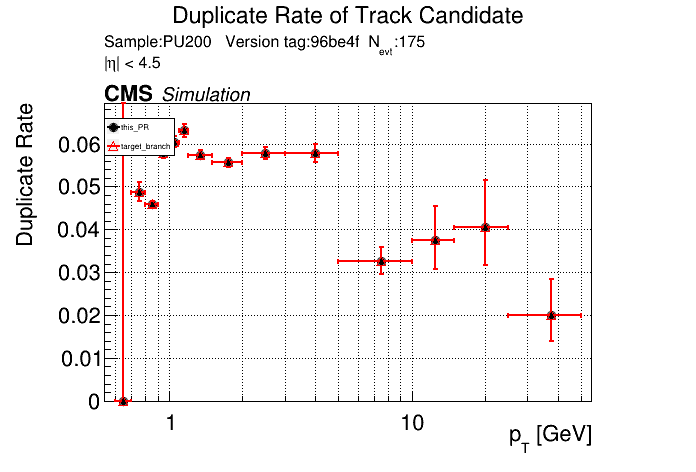
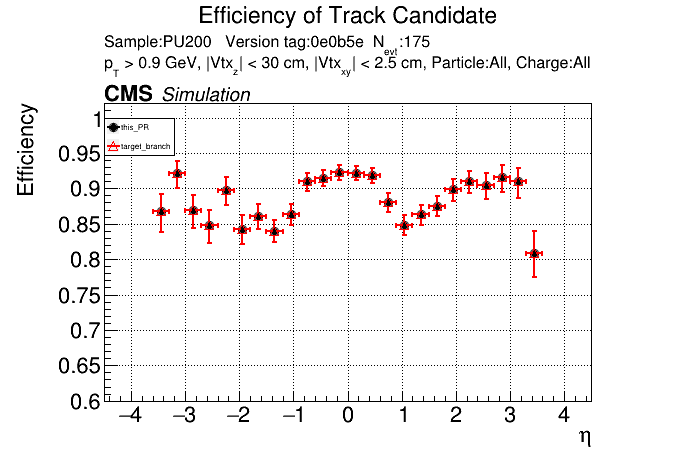
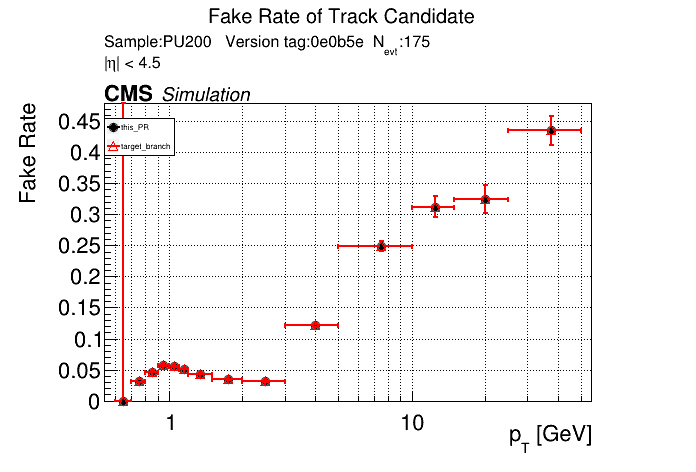
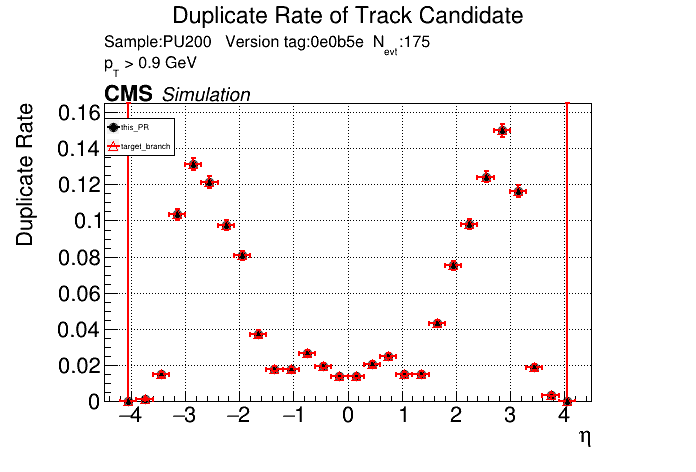
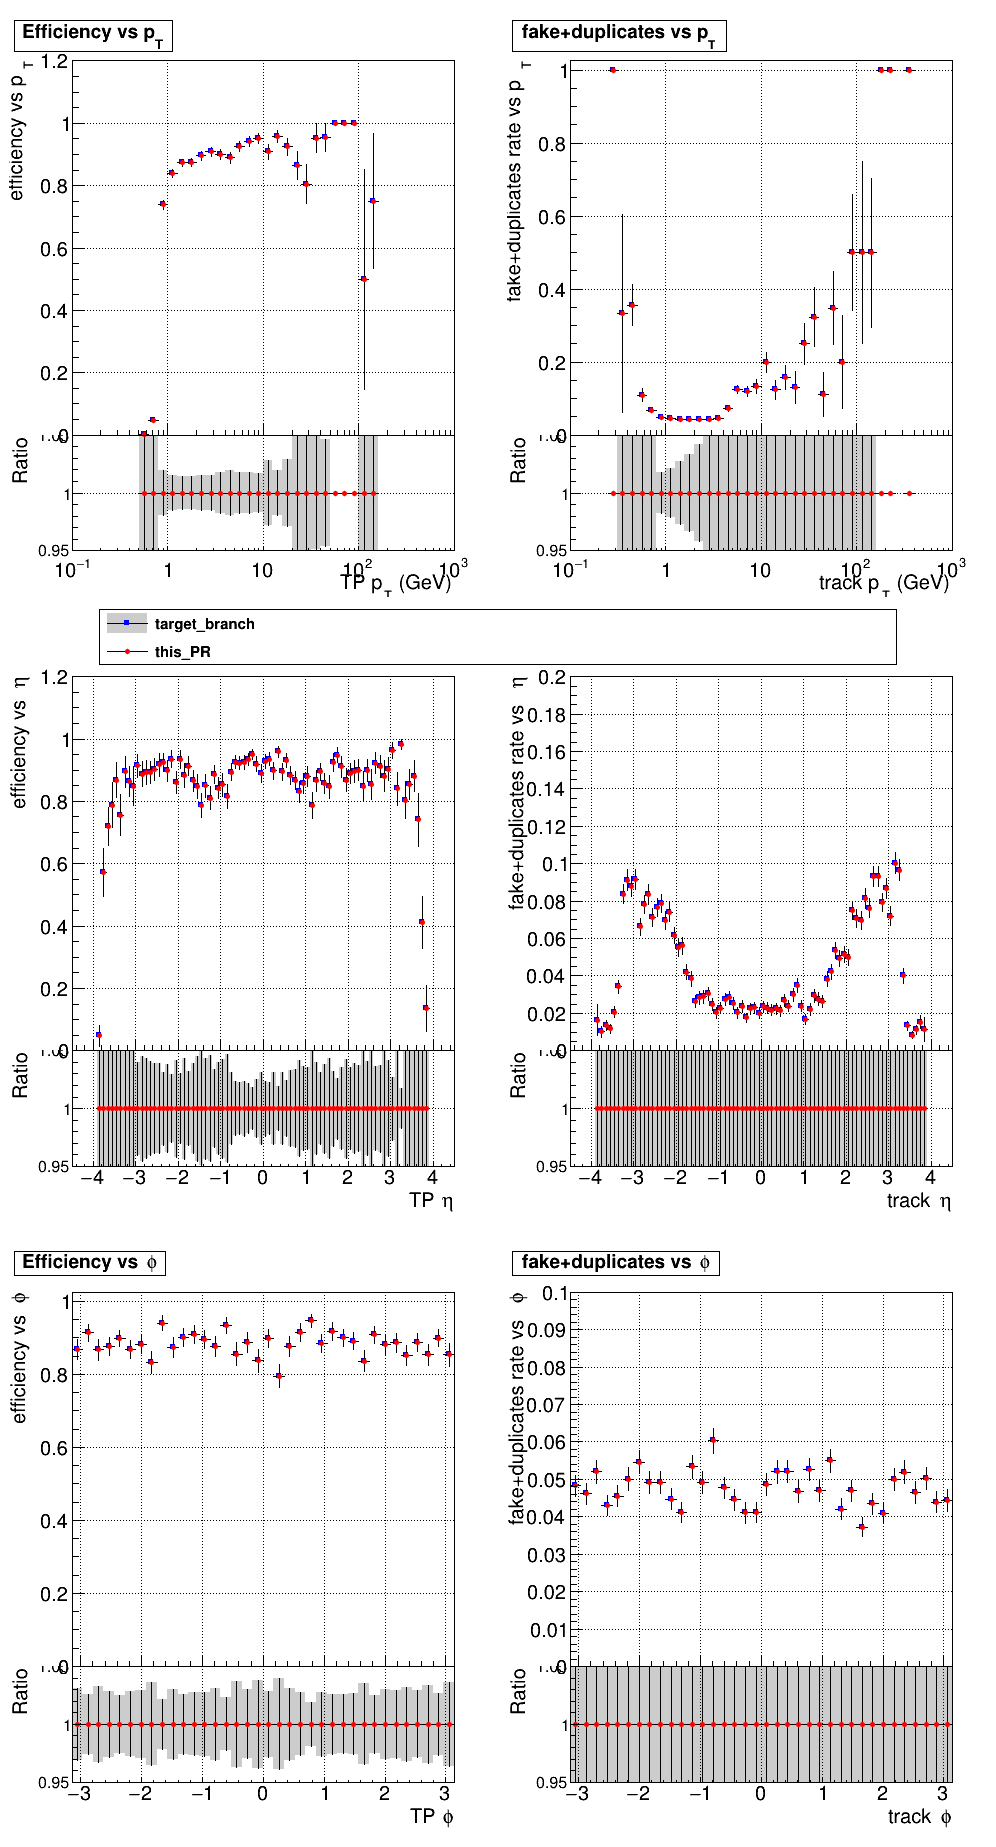
The PR was built and ran successfully in standalone mode. Here are some of the comparison plots.
The full set of validation and comparison plots can be found here. Here is a timing comparison: |
is the T3 increase from 44 to 63 real? |
|
Here's a timing comparison on cgpu-1. It seems like it might actually be a bit slower. I'll check whether initializing the whole buffer is causing this, or if it's unrelated. I'm still working on getting the CI to run the CMSSW comparison. |
|
/run cmssw |
|
There was a problem while building and running with CMSSW. The logs can be found here. |
|
The PR was built and ran successfully with CMSSW. Here are some plots. OOTB All Tracks
The full set of validation and comparison plots can be found here. |
|
Pending the CI test, it seems like initializing only the required columns fixed the timing. /run standalone |
|
The PR was built and ran successfully in standalone mode. Here are some of the comparison plots.
The full set of validation and comparison plots can be found here. Here is a timing comparison: |
|
Hmm it's weird that the T3 timing is still significantly higher in the CI. |
|
/run cmssw |
|
There was a problem while building and running with CMSSW. The logs can be found here. |
|
The PR was built and ran successfully with CMSSW. Here are some plots. OOTB All Tracks
The full set of validation and comparison plots can be found here. |
|
This is the timing comparison for CPU on cgpu-1. It must be that the new memory layout is not very favorable for CPU, but at least it seems like it's not too bad on GPU. |
|
The PR was built and ran successfully with CMSSW. Here are some plots. OOTB All Tracks
The full set of validation and comparison plots can be found here. |
| alpaka::memcpy(queue_, alpaka::createView(devAcc_, segmentsPixel.ptIn(), size), ptIn, size); | ||
| alpaka::memcpy(queue_, alpaka::createView(devAcc_, segmentsPixel.ptErr(), size), ptErr, size); | ||
| alpaka::memcpy(queue_, alpaka::createView(devAcc_, segmentsPixel.px(), size), px, size); | ||
| alpaka::memcpy(queue_, alpaka::createView(devAcc_, segmentsPixel.py(), size), py, size); | ||
| alpaka::memcpy(queue_, alpaka::createView(devAcc_, segmentsPixel.pz(), size), pz, size); | ||
| alpaka::memcpy(queue_, alpaka::createView(devAcc_, segmentsPixel.etaErr(), size), etaErr, size); | ||
| alpaka::memcpy(queue_, alpaka::createView(devAcc_, segmentsPixel.isQuad(), size), isQuad, size); | ||
| alpaka::memcpy(queue_, alpaka::createView(devAcc_, segmentsPixel.eta(), size), eta, size); | ||
| alpaka::memcpy(queue_, alpaka::createView(devAcc_, segmentsPixel.phi(), size), phi, size); | ||
| alpaka::memcpy(queue_, alpaka::createView(devAcc_, segmentsPixel.charge(), size), charge, size); | ||
| alpaka::memcpy(queue_, alpaka::createView(devAcc_, segmentsPixel.seedIdx(), size), seedIdx, size); | ||
| alpaka::memcpy(queue_, alpaka::createView(devAcc_, segmentsPixel.superbin(), size), superbin, size); | ||
| alpaka::memcpy(queue_, alpaka::createView(devAcc_, segmentsPixel.pixelType(), size), pixelType, size); |
There was a problem hiding this comment.
Choose a reason for hiding this comment
The reason will be displayed to describe this comment to others. Learn more.
If I remember correctly the final size argument can be omitted, and will be assumed to match the size of the destination of the copy.
There was a problem hiding this comment.
Choose a reason for hiding this comment
The reason will be displayed to describe this comment to others. Learn more.
That usually works, but not when combining std::vector and Alpaka buffers. You end up getting this error:
In file included from /cvmfs/cms.cern.ch/el8_amd64_gcc12/external/alpaka/1.1.0-4d4f1220bfca9be4c4149ab758d15463/include/alpaka/mem/buf/Traits.hpp:10,
                 from /cvmfs/cms.cern.ch/el8_amd64_gcc12/external/alpaka/1.1.0-4d4f1220bfca9be4c4149ab758d15463/include/alpaka/dev/DevCpu.hpp:11,
                 from /cvmfs/cms.cern.ch/el8_amd64_gcc12/external/alpaka/1.1.0-4d4f1220bfca9be4c4149ab758d15463/include/alpaka/acc/AccCpuOmp2Blocks.hpp:36,
                 from /cvmfs/cms.cern.ch/el8_amd64_gcc12/external/alpaka/1.1.0-4d4f1220bfca9be4c4149ab758d15463/include/alpaka/alpaka.hpp:13,
                 from /home/users/anriosta/CMSSW_tests/CMSSW_14_2_0_pre1/src/RecoTracker/LSTCore/standalone/../../../HeterogeneousCore/AlpakaInterface/interface/memory.h:6,
                 from ../../src/alpaka/Event.dev.cc:1:
/cvmfs/cms.cern.ch/el8_amd64_gcc12/external/alpaka/1.1.0-4d4f1220bfca9be4c4149ab758d15463/include/alpaka/mem/view/Traits.hpp: In instantiation of 'auto alpaka::createTaskMemcpy(TViewDstFwd&&, const TViewSrc&, const TExtent&) [with TExtent = Vec<std::integral_constant<long unsigned int, 1>, long unsigned int>; TViewSrc = std::vector<float>; TViewDstFwd = ViewPlainPtr<DevCpu, float, std::integral_constant<long unsigned int, 1>, unsigned int>]':
/cvmfs/cms.cern.ch/el8_amd64_gcc12/external/alpaka/1.1.0-4d4f1220bfca9be4c4149ab758d15463/include/alpaka/mem/view/Traits.hpp:312:40:   required from 'void alpaka::memcpy(TQueue&, TViewDstFwd&&, const TViewSrc&) [with TViewSrc = std::vector<float>; TViewDstFwd = ViewPlainPtr<DevCpu, float, std::integral_constant<long unsigned int, 1>, unsigned int>; TQueue = QueueGenericThreadsBlocking<DevCpu>]'
../../src/alpaka/Event.dev.cc:249:17:   required from here
/cvmfs/cms.cern.ch/el8_amd64_gcc12/external/alpaka/1.1.0-4d4f1220bfca9be4c4149ab758d15463/include/alpaka/mem/view/Traits.hpp:277:58: error: static assertion failed: The destination view and the extent are required to have compatible index types!
  277 |             meta::IsIntegralSuperset<DstIdx, ExtentIdx>::value,
      |                                                          ^~~~~
/cvmfs/cms.cern.ch/el8_amd64_gcc12/external/alpaka/1.1.0-4d4f1220bfca9be4c4149ab758d15463/include/alpaka/mem/view/Traits.hpp:277:58: note: 'std::integral_constant<bool, false>::value' evaluates to false
There was a problem hiding this comment.
Choose a reason for hiding this comment
The reason will be displayed to describe this comment to others. Learn more.
Thanks for the error message - I will try to reproduce it and open an issue with alpaka.
|
@ariostas @slava77 could you tell me how to interpret these timing results ?
Is it a before / after comparison of the impact of these changes ? What about these ones ?
What do the five rows indicate ? Looking at the columns, what do |
Yeah, the first row is before, and the second row is after (it's not very clear, but they are labeled at the end of the line). The columns are the (average) time to complete each step of the algorithm.
These are the same, but testing different numbers of streams, indicated by
What is being timed are these functions (and the other columns time equivalent functions)
|
How exactly do you measure time? Is it CPU time? Wall clock time? Kernel time? |
| // This is not used, but it is needed for compilation | ||
| template <typename T0, typename... Args> | ||
| struct CopyToHost<PortableHostMultiCollection<T0, Args...>> { |
There was a problem hiding this comment.
Choose a reason for hiding this comment
The reason will be displayed to describe this comment to others. Learn more.
Could you elaborate? Having to copy a "host collection" to host seems wrong.
There was a problem hiding this comment.
Choose a reason for hiding this comment
The reason will be displayed to describe this comment to others. Learn more.
I wanted to ask you about this. I needed to add it so that this part compiles (even with the if constexpr).
cmssw/RecoTracker/LSTCore/src/alpaka/Event.dev.cc
Lines 1399 to 1412 in 96be4f7
| template <typename TSoA> | |
| typename TSoA::ConstView Event::getSegments(bool sync) { | |
| if constexpr (std::is_same_v<Device, DevHost>) | |
| return segmentsDev_->const_view<TSoA>(); | |
| if (!segmentsHost_) { | |
| segmentsHost_.emplace(cms::alpakatools::CopyToHost<SegmentsDeviceCollection>::copyAsync(queue_, *segmentsDev_)); | |
| if (sync) | |
| alpaka::wait(queue_); // host consumers expect filled data | |
| } | |
| return segmentsHost_->const_view<TSoA>(); | |
| } | |
| template SegmentsConst Event::getSegments<SegmentsSoA>(bool); | |
| template SegmentsOccupancyConst Event::getSegments<SegmentsOccupancySoA>(bool); | |
| template SegmentsPixelConst Event::getSegments<SegmentsPixelSoA>(bool); |
There was a problem hiding this comment.
Choose a reason for hiding this comment
The reason will be displayed to describe this comment to others. Learn more.
The if constexpr allows the non-taken branch to be non-compilable only when the condition depends on a template argument (e.g. if the the getSegments() would take the Queue as an argument, but could be achieved in many other ways). I'd want to avoid the specialization of CopyToHost for host-specific data types.
There was a problem hiding this comment.
Choose a reason for hiding this comment
The reason will be displayed to describe this comment to others. Learn more.
On a similar note: is it intended to make a copy of the data when running on the host ?
There was a problem hiding this comment.
Choose a reason for hiding this comment
The reason will be displayed to describe this comment to others. Learn more.
In fact, what happens if you avoid the copy at line 1404 when running on the Cpu ?
Does the code require that the device buffer is still valid after the copy ? Does it assume that the "host" and "device" buffers can be modified independently of each other ?
There was a problem hiding this comment.
Choose a reason for hiding this comment
The reason will be displayed to describe this comment to others. Learn more.
Ah, ignore me, I missed the if on line 1401.
There was a problem hiding this comment.
Choose a reason for hiding this comment
The reason will be displayed to describe this comment to others. Learn more.
@makortel I tried this
template <typename TSoA, typename TDev = Device>
typename TSoA::ConstView Event::getSegments(bool sync) {
  if constexpr (std::is_same_v<TDev, DevHost>)
    return segmentsDev_->const_view<TSoA>();
  if (!segmentsHost_) {
    segmentsHost_.emplace(cms::alpakatools::CopyToHost<SegmentsDeviceCollection>::copyAsync(queue_, *segmentsDev_));
    if (sync)
      alpaka::wait(queue_);  // host consumers expect filled data
  }
  return segmentsHost_->const_view<TSoA>();
}
and this
template <typename TSoA, typename TQueue>
typename TSoA::ConstView Event::getSegments(bool sync, TQueue& queue) {
  if constexpr (std::is_same_v<alpaka::Dev<TQueue>, DevHost>)
    return segmentsDev_->const_view<TSoA>();
  if (!segmentsHost_) {
    segmentsHost_.emplace(cms::alpakatools::CopyToHost<SegmentsDeviceCollection>::copyAsync(queue_, *segmentsDev_));
    if (sync)
      alpaka::wait(queue_);  // host consumers expect filled data
  }
  return segmentsHost_->const_view<TSoA>();
}
but none of them compile.
There was a problem hiding this comment.
Choose a reason for hiding this comment
The reason will be displayed to describe this comment to others. Learn more.
It seems you need to put the non-compilable code into an explicit if or else branch, along
template <typename TSoA, typename TQueue>
typename TSoA::ConstView Event::getSegments(bool sync, TQueue& queue) {
  if constexpr (std::is_same_v<alpaka::Dev<TQueue>, DevHost>) {
    return segmentsDev_->const_view<TSoA>();
  } else {
    if (!segmentsHost_) {
      segmentsHost_.emplace(cms::alpakatools::CopyToHost<SegmentsDeviceCollection>::copyAsync(queue_, *segmentsDev_));
      if (sync)
        alpaka::wait(queue_);  // host consumers expect filled data
    }
    return segmentsHost_->const_view<TSoA>();
  }
}There was a problem hiding this comment.
Choose a reason for hiding this comment
The reason will be displayed to describe this comment to others. Learn more.
Thank you @makortel. For some reason that still didn't work for me, but I got it to work by additionally explicitly involving the templated type in CopyToHost.
Just wall time cmssw/RecoTracker/LSTCore/standalone/code/core/trkCore.cc Lines 118 to 121 in 96be4f7
|
|
I resolved the merge conflicts and changed things to match the conventions from previous PRs. If the CI plots look fine, then this is ready for review. /run all |
|
The PR was built and ran successfully in standalone mode. Here are some of the comparison plots.
The full set of validation and comparison plots can be found here. Here is a timing comparison: |
|
The PR was built and ran successfully with CMSSW. Here are some plots. OOTB All Tracks
The full set of validation and comparison plots can be found here. |
There was a problem hiding this comment.
Choose a reason for hiding this comment
The reason will be displayed to describe this comment to others. Learn more.
I have a few rather technical comments; these can be addressed later
| segmentsDC_.emplace(segments_sizes, queue_); | ||
|
|
||
| auto nSegments_view = | ||
| alpaka::createView(devAcc_, segmentsDC_->view<SegmentsOccupancySoA>().nSegments(), nLowerModules_ + 1); |
There was a problem hiding this comment.
Choose a reason for hiding this comment
The reason will be displayed to describe this comment to others. Learn more.
| alpaka::createView(devAcc_, segmentsDC_->view<SegmentsOccupancySoA>().nSegments(), nLowerModules_ + 1); | |
| alpaka::createView(devAcc_, segmentsDC_->view<SegmentsOccupancySoA>().nSegments(), segments_sizes[1]); |
same below
There was a problem hiding this comment.
Choose a reason for hiding this comment
The reason will be displayed to describe this comment to others. Learn more.
Sorry I missed these. I'll fix them and finish the SoA migration next week.
|
|
||
| // Create source views for size and mdSize | ||
| auto src_view_size = alpaka::createView(cms::alpakatools::host(), &size, (Idx)1u); | ||
| auto src_view_mdSize = alpaka::createView(cms::alpakatools::host(), &mdSize, (Idx)1u); | ||
|
|
||
| auto dst_view_segments = alpaka::createSubView(segmentsBuffers_->nSegments_buf, (Idx)1u, (Idx)pixelModuleIndex); | ||
| SegmentsOccupancy segmentsOccupancy = segmentsDC_->view<SegmentsOccupancySoA>(); | ||
| auto nSegments_view = alpaka::createView(devAcc_, segmentsOccupancy.nSegments(), (Idx)nLowerModules_ + 1); |
There was a problem hiding this comment.
Choose a reason for hiding this comment
The reason will be displayed to describe this comment to others. Learn more.
better use the segmentsOccupancy.metadata().size() here explicitly (same below)
cb84b9c
into
CMSSW_14_1_0_pre3_LST_X_LSTCore_realfiles_batch7










This PR is a draft for a possible way to migrate the classes we have to use SoA+PortableCollection. Since for segments we have columns of 3 different lengths then I had to introduce an extra struct. I still need to think whether there is a better way to do this or whether the names can be improved. Also, I haven't tested this to see if it works.