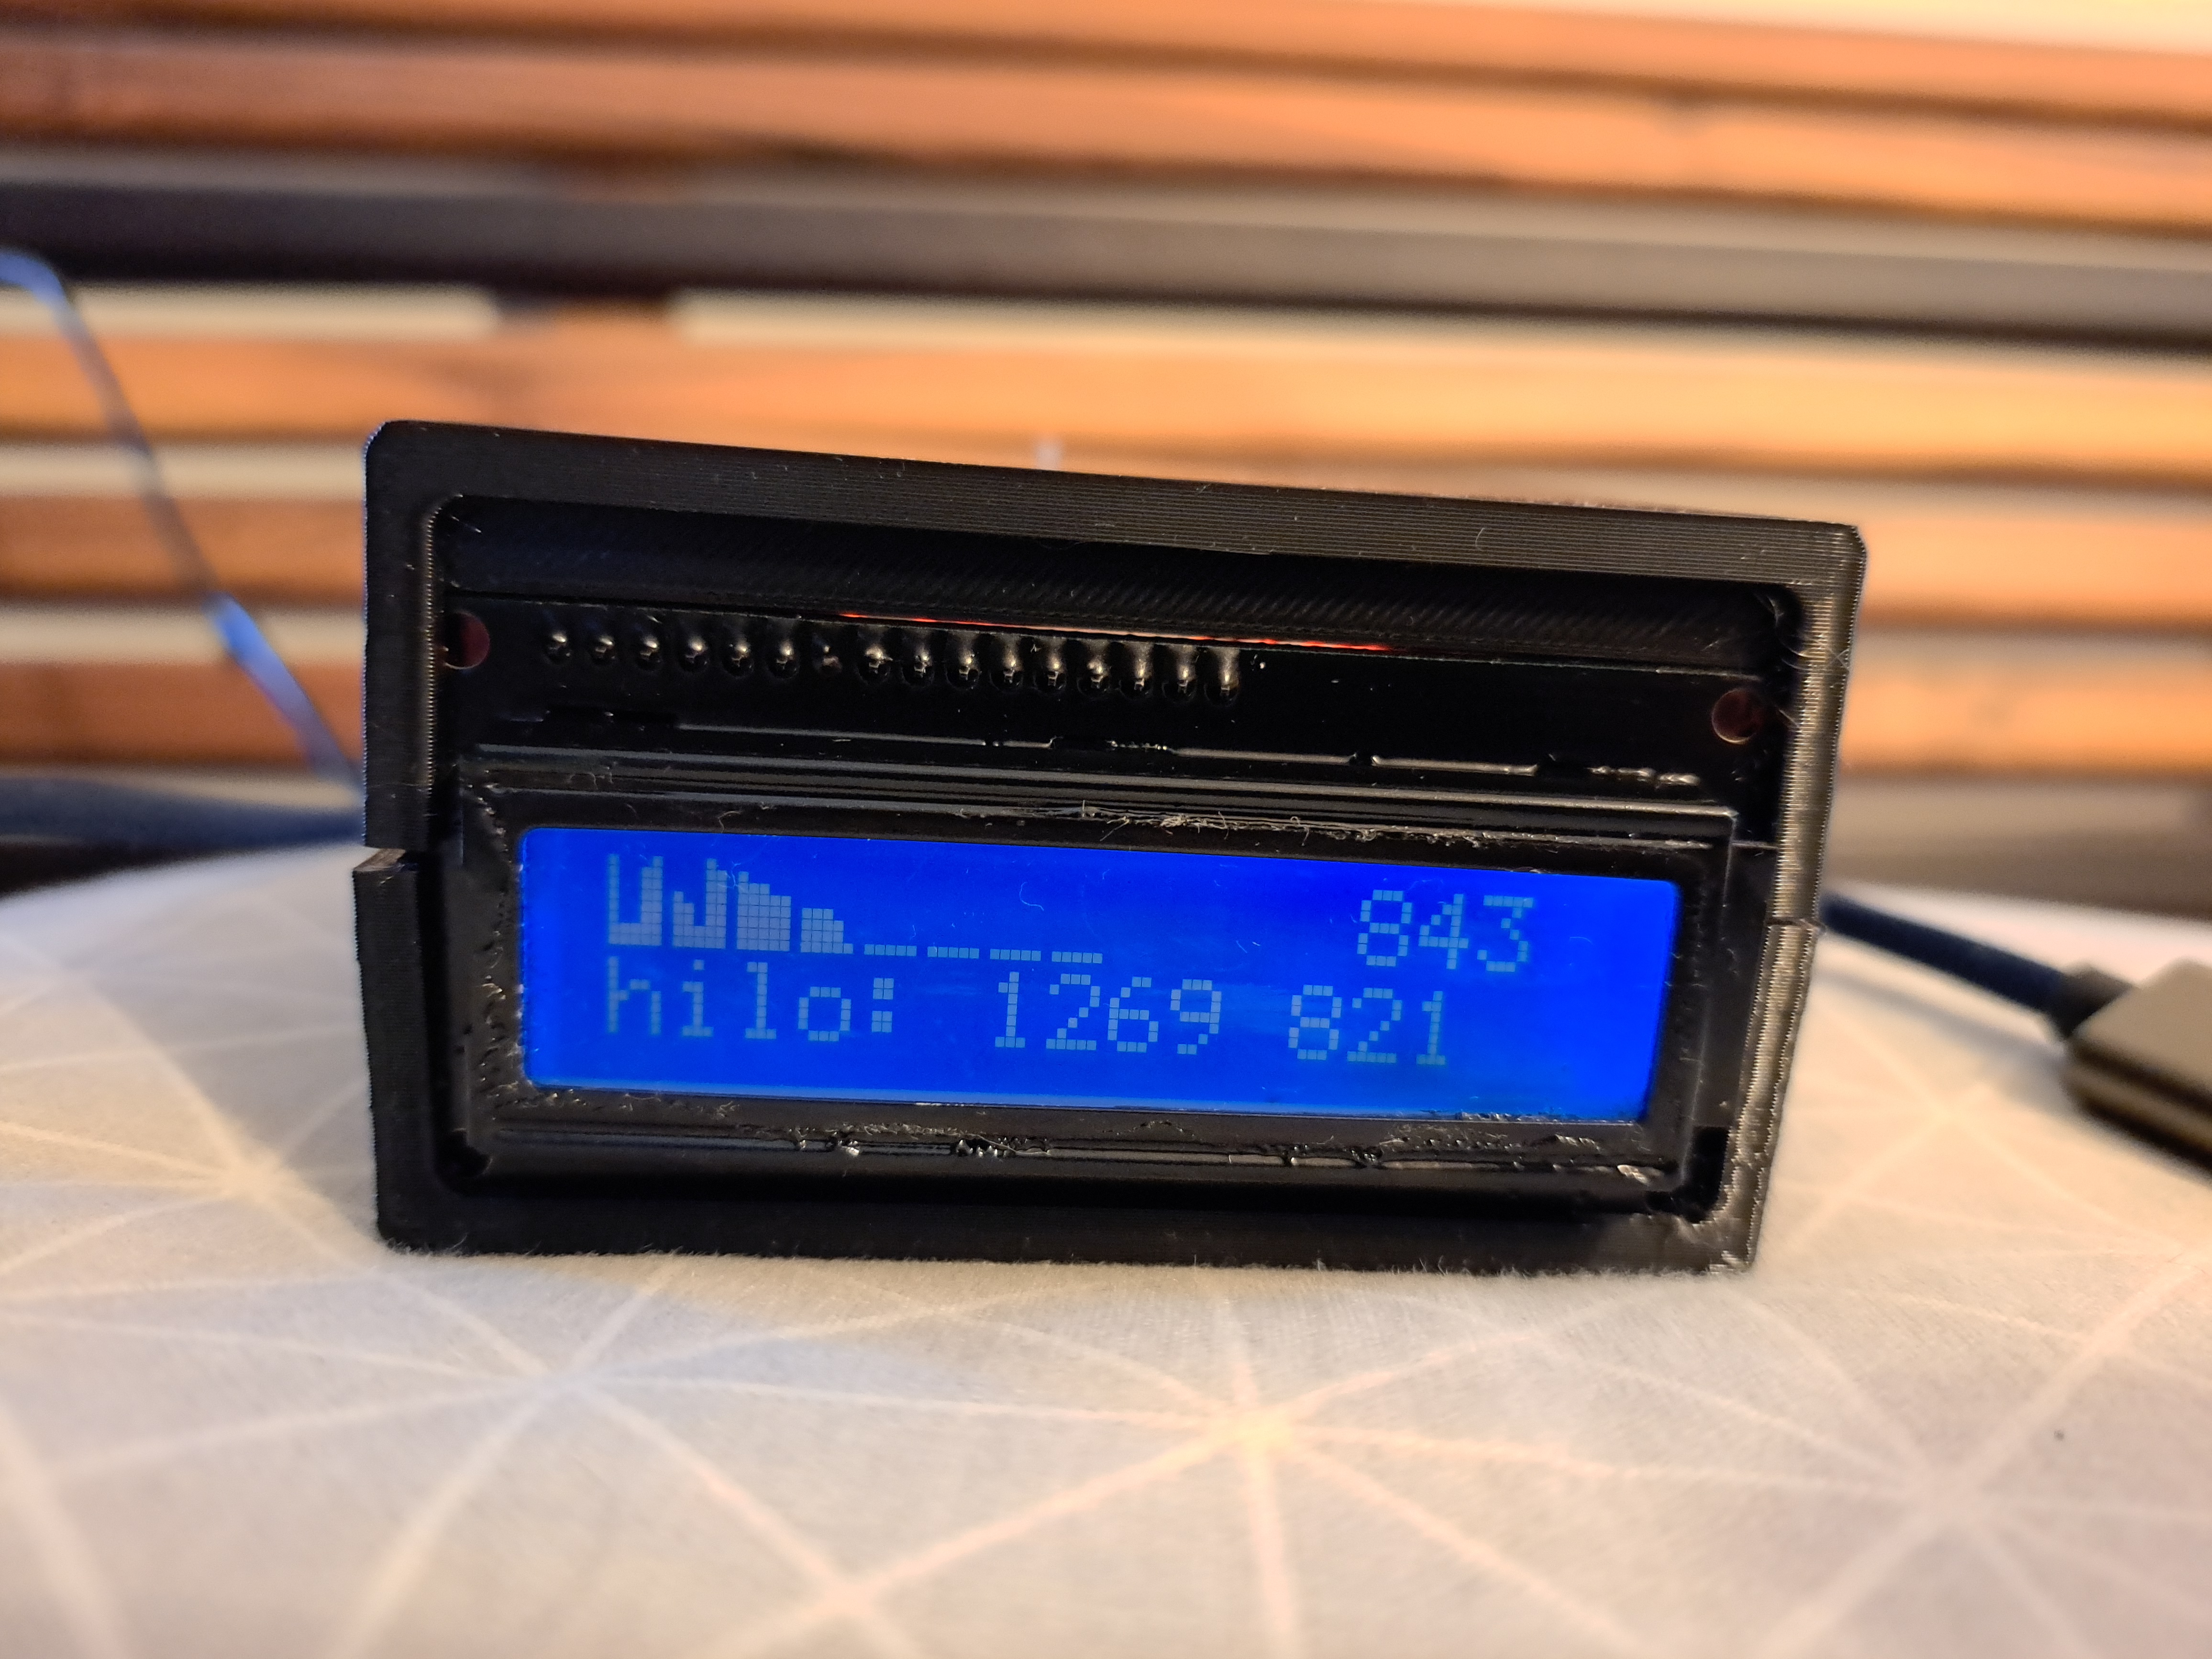
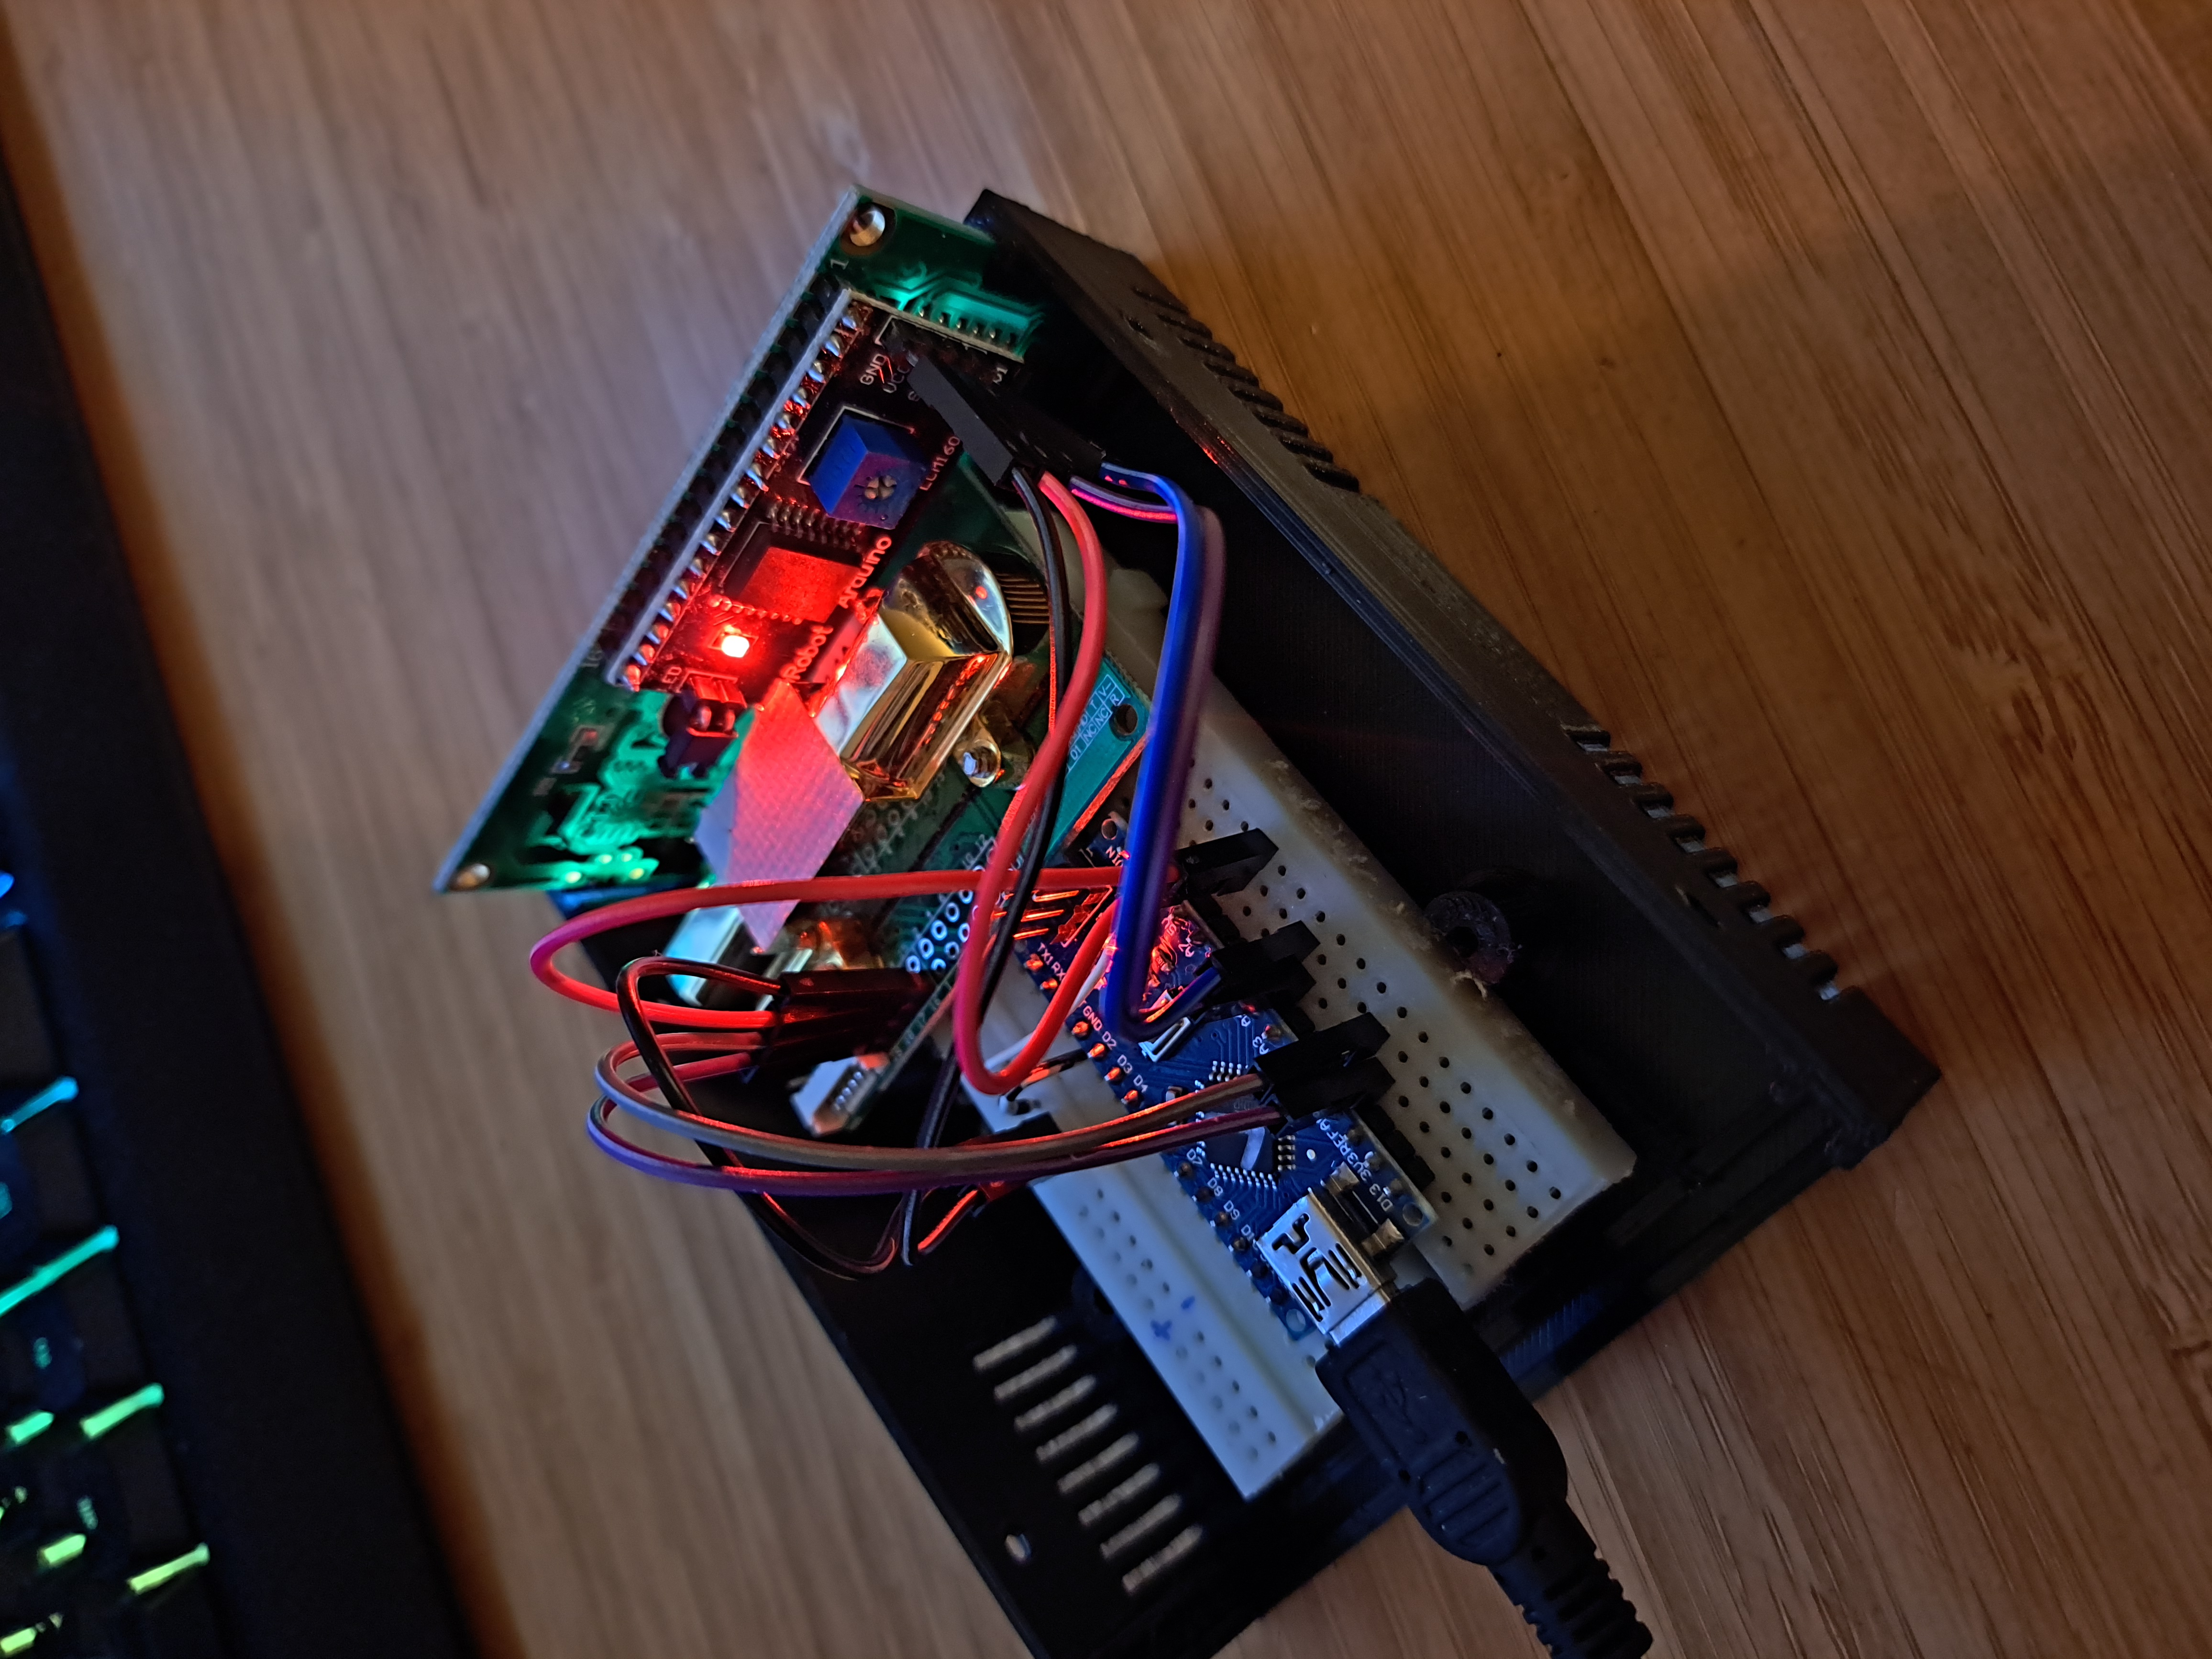
A standalone CO2 display based on Arduino and the MH-Z14 sensor, for checking if the ventilation in a living space is OK, because elevated CO2 levels seem to impair cognition.
I wanted to buy a commercial CO2 sensor but almost all of those are very vague on how calibration happens, or don't even specify the type of sensor used (NDIR, extrapolation based on VOC), let alone the sensor model. Exceptions to that are quite (>$120) expensive, but available - MoreSense for €120, Aranet4 for $250. As I wanted to build multiple sensor it made sense to DIY it.
Automatic Baseline Calibration is disabled, because ABC gives a false sense of accuracy. Let me explain: take a room with people, the CO2 will be elevated. Now if the (ventilated) room gets empty, CO2 readings will decrease, with an asymptote at ~400 ppm. If this asymptote happens according to the sensor at let's say 500 ppm, you know the sensor is in need of calibration, because the outside is ~400 ppm (see satellite imagery of that here).
The MH-Z14 sensor correlates infrared transmittance in air to a certain CO2 value. Because both the offset and the slope of this relationship can shift with sensor aging, say by the LED getting dimmer, it's unclear if just removing a Y offset (which is how the sensor seems to do calibration, see here) in our example, doing -100 to our reading of 500 to end up at 400 again) made things better. It might be that it wasn't the offset, but the slope that needed adjustment. Thus I think that it's better to leave readings uncalibrated, and look at the asymptote as a sanity check to see if the sensor is still 'good', because if it's ~400 in a well-ventilated room then both the slope and the offset must be correct.
When it does need calibration, a span (two point) calibration can be done with either test gases or a calibrated sensor.
The LCDGraph library is used for graphs, but the standard and cheap 16 character * 2 rows displays aren't very well suited to graphs, because of the grap between characters, and the 8 custom characters limit. A 128*64 OLED for a few dollars might be a better fit.
Generated by an openSCAD file, credits go to jbebel.
At ~500 ppm and ~2000 ppm, it seems that the readings fall within 200 ppm of my MoreSense with a SenseAir s8 sensor, which is good enough for me.

