This idea was born out of my need to figure out how much Netflix I have consumed and what shows I have spent an obscene amount of time on.
- Version 1: Only worked with my own data.
- Version 2: Works with any user's data. (Future improvements - 1)
- Installation and Tools
- Programming Languages and libraries used
- Graphs
- My Hot Takes
- Future Improvements
- Install an IDE of your choice
I prefer PyCharm: https://www.jetbrains.com/pycharm/download/
- Install Python 3
- CSV file containing Netflix Viewing Activity
Detailed instructions to download: https://help.netflix.com/en/node/101917
- Programming Language: Python
- Libraries used: Pandas, Matplotlib, and Seaborn
Copy paste the code from main.py into your chosen IDE.
The program requires user input three times, listed below:
1 - CSV File: Copy the exact file path of the CSV file that you downloaded and paste the path when asked:
For example: /Users/library/Data/Downloads/netflix-report/ViewingActivity.csv
This csv file will be cleaned up to remove unnecessary data and arrange existing data as required for visualizations.
2 - Profile Name: Given that Netflix account usually contains multiple profiles/users - this allows us to see visualisations associated with just ONE profile/user. Enter one of the profile names so that Graph 2, 3, 4 can be plotted.
For example: Yasmeen
3 - Heatmap: Enter the name of a TV Show that you have watched, which you would like to see a heatmap plotted for:
For example: Friends
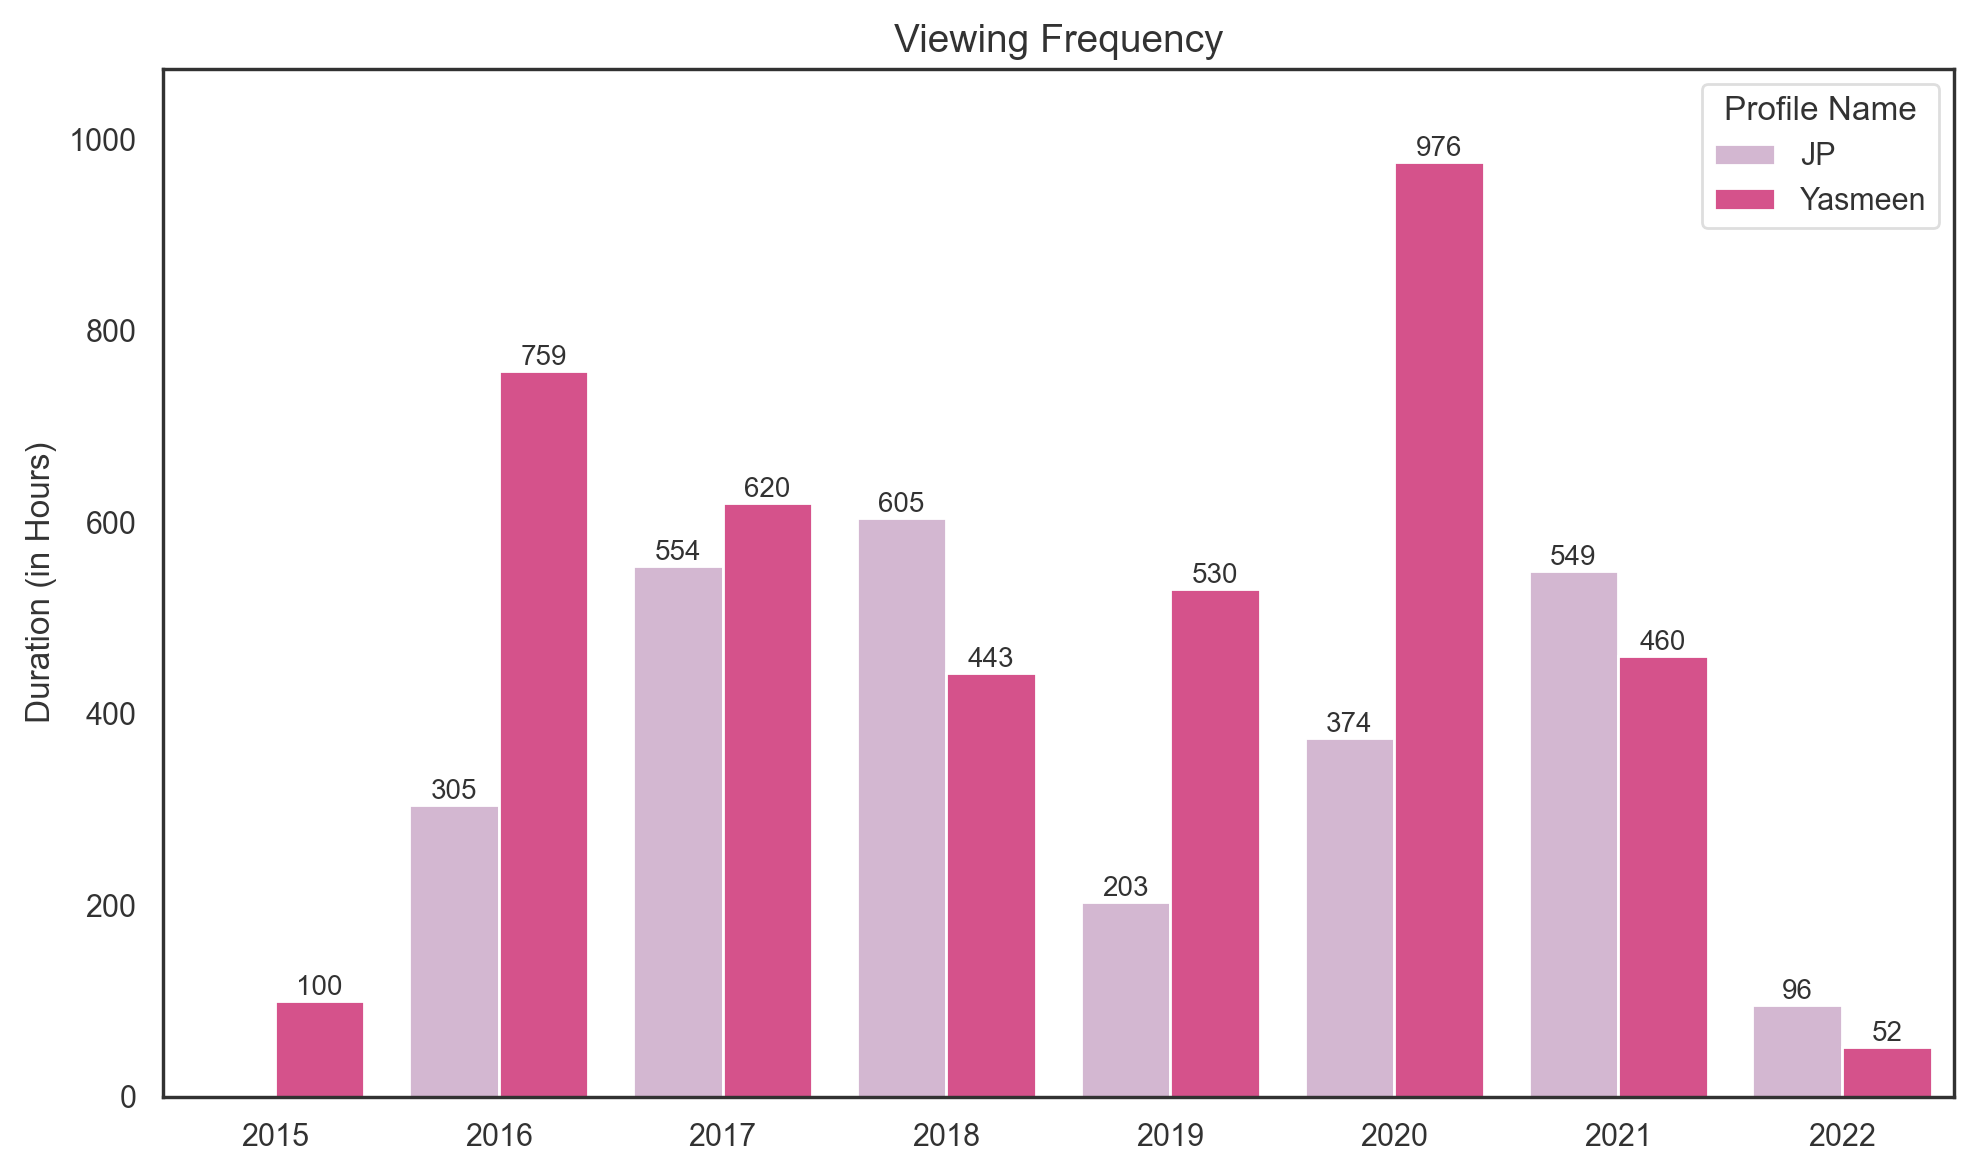
1 - Grouped Bar Graph by Profile
- Details : Illustrates how much each Netflix profile in your account has watched (in terms of duration hours).
- Image (my data for illustration purposes only)
- Parameters:
- X-Axis: Years
- Y-Axis: Duration in hours
2 – Stacked Bar Graph:
- Details: TV Shows watched vs Movies in terms of Duration (hours) each year.
- Image (my data for illustration purposes only)
)
- Parameters:
- X-Axis: Years
- Y-Axis: Duration in hours
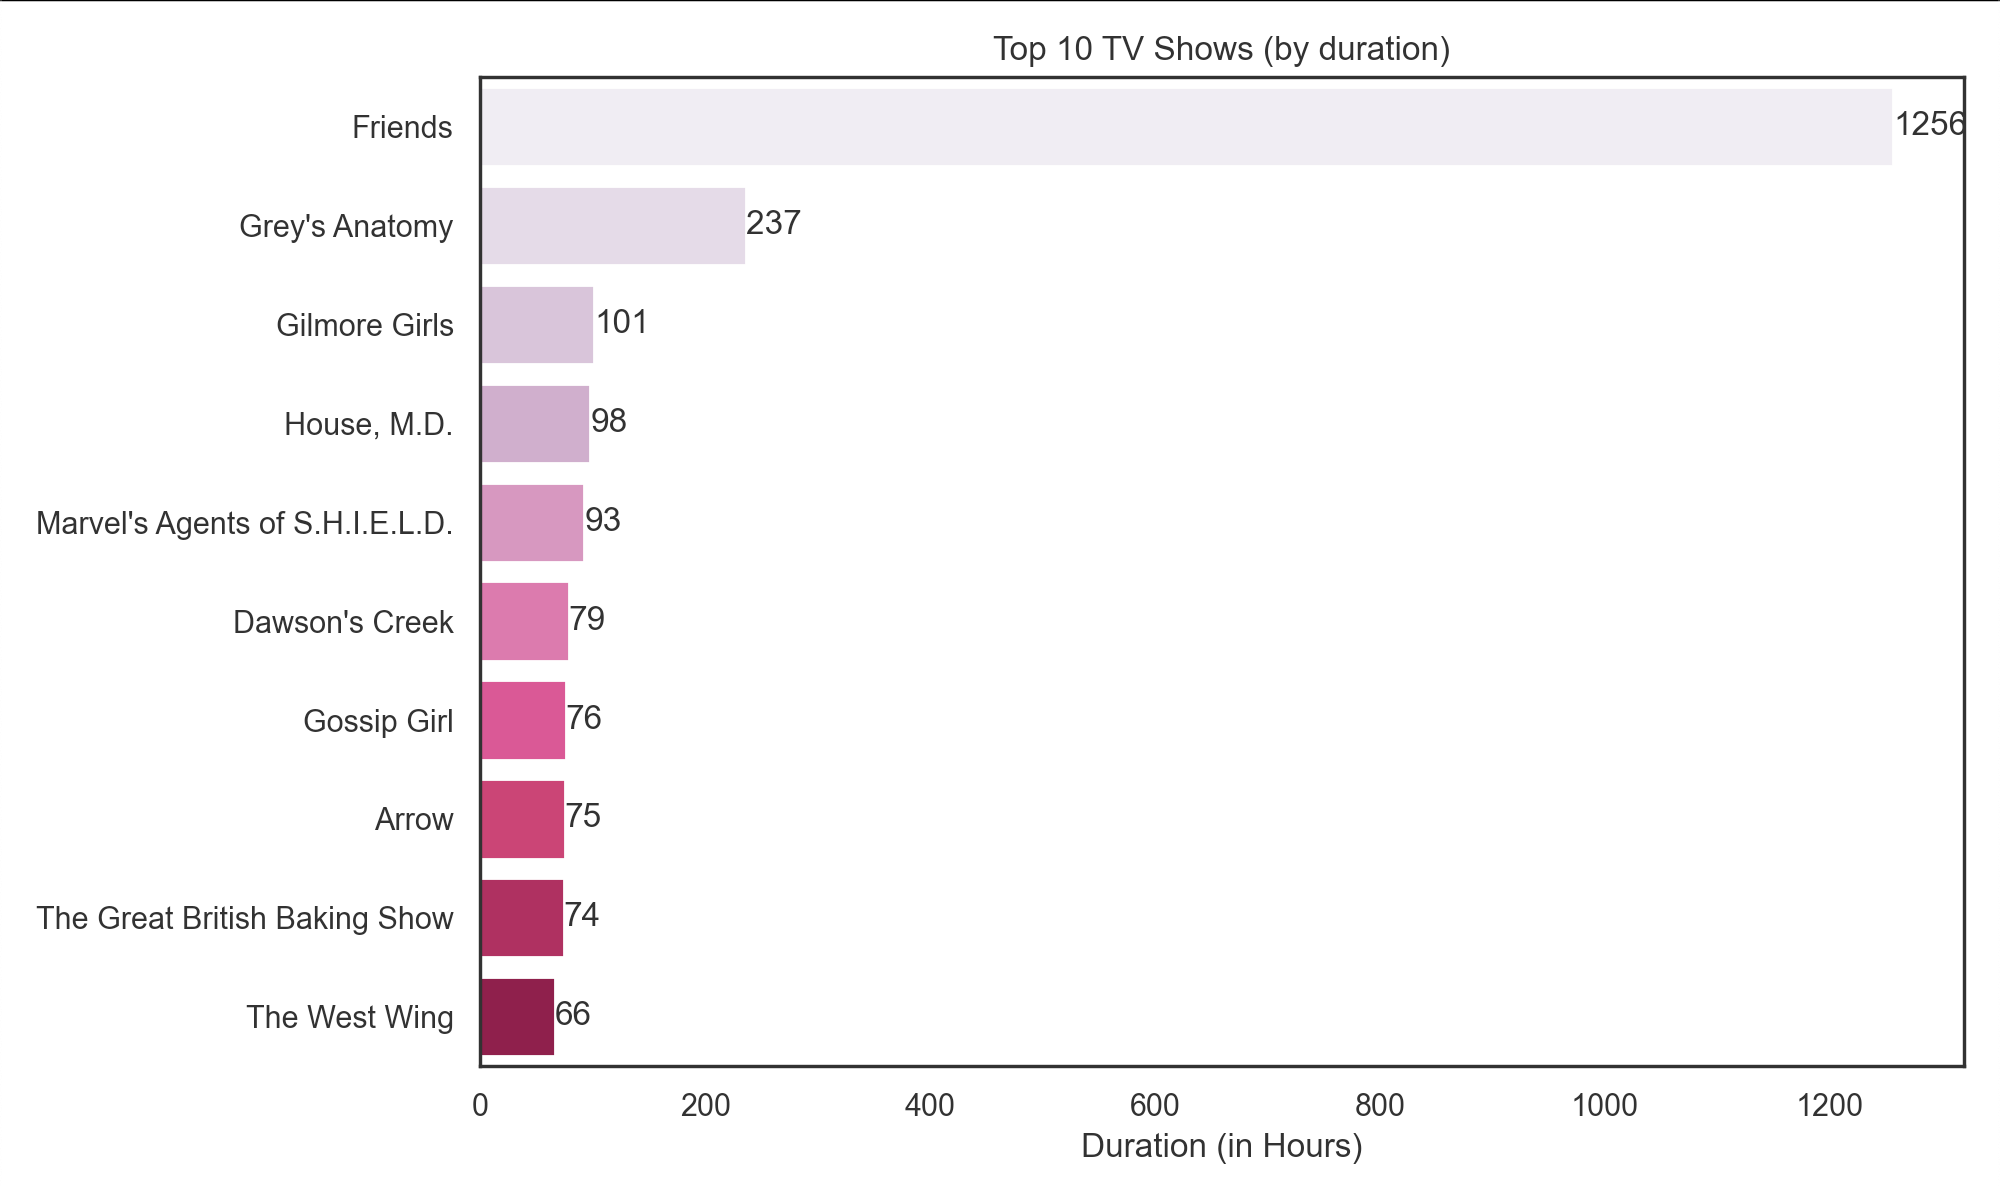
3 - Horizontal Bar Graph
- Details: Top 10 TV shows watched in terms of Duration (hours).
- Image (my data for illustration purposes only)
- Parameters:
- X-Axis: Duration in minutes
- Y-Axis: TV shows
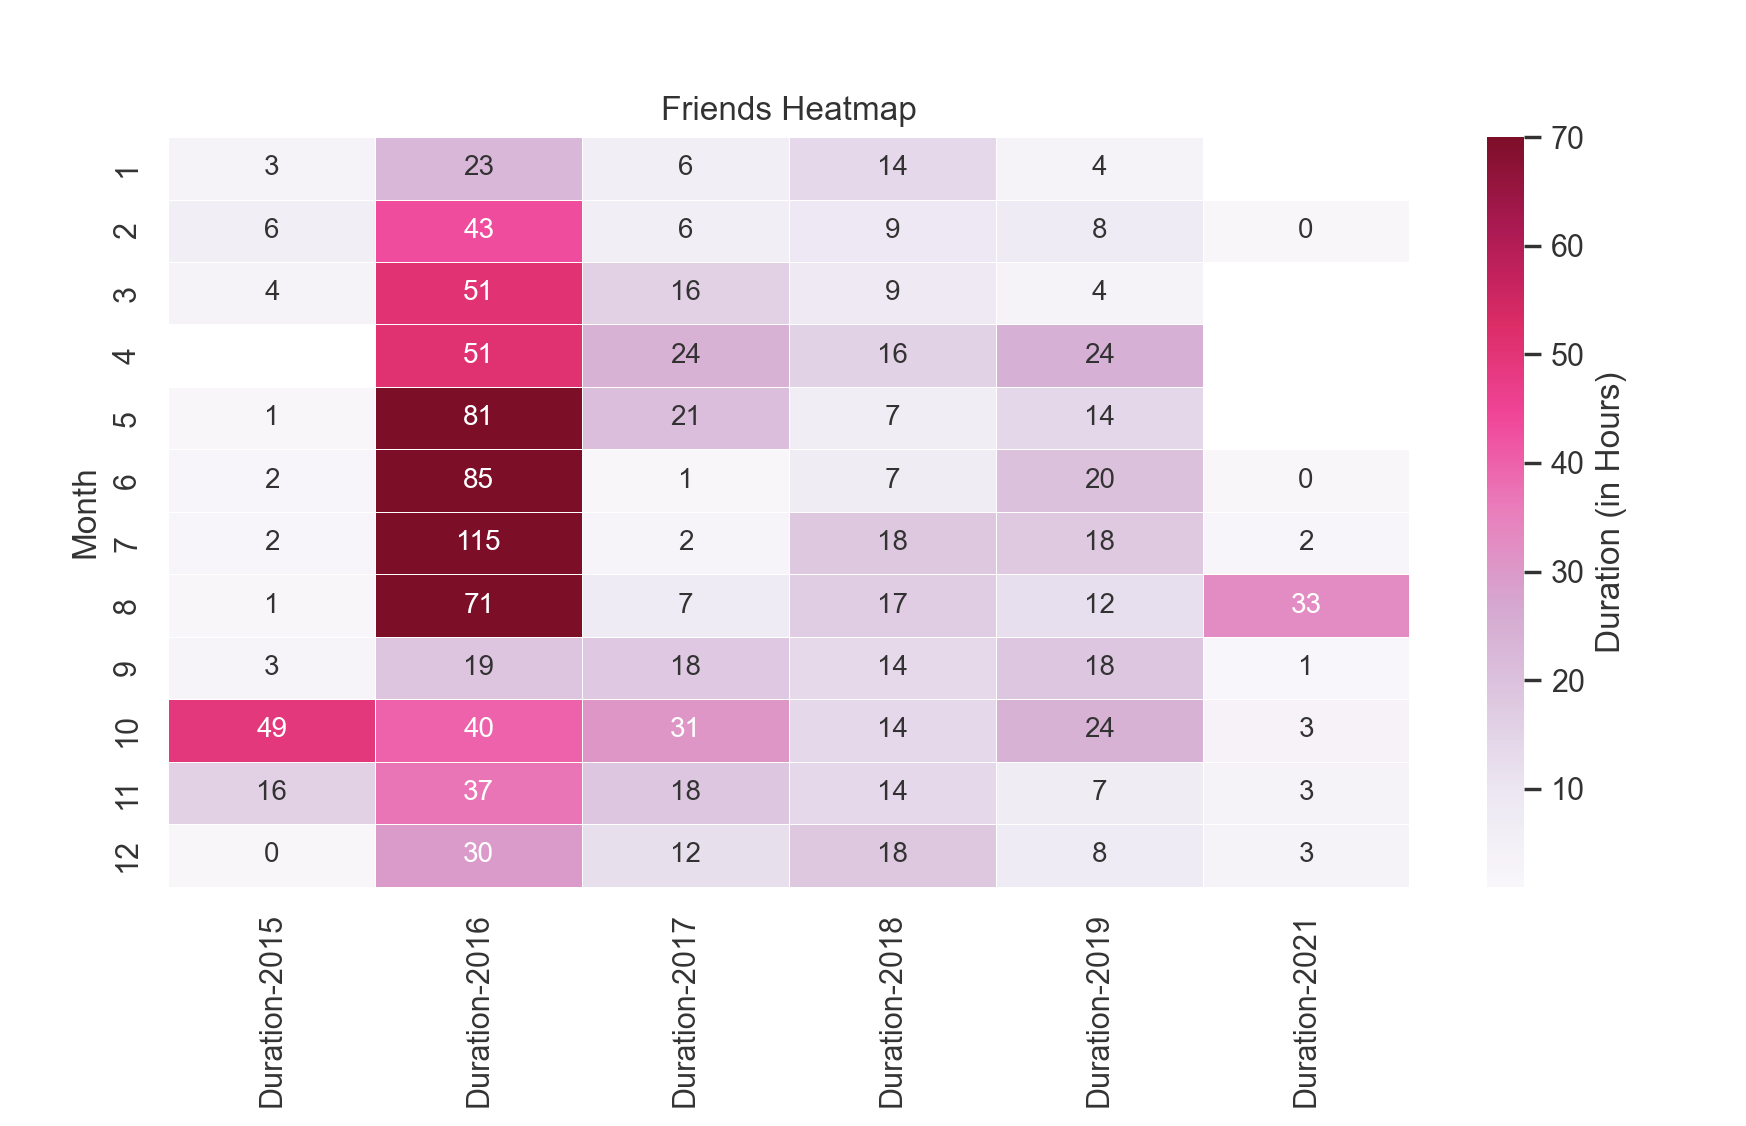
4 - Heatmap
- Details: Heatmap of your viewing activity on a show of your choice.
- Image (my data for illustration purposes only)
- Parameters:
- X-Axis: Years
- Y-Axis: Months
- The CSV file from Netflix requires significant clean-up to make it usable.
- I did not use seaborn for stacked bar graphs as I found it particularly hard to use.
- With every graph created, many sanity checks are needed to ensure that the data is correct. Some are included in this code, however, I have significantly condensed it here for readability and to ensure the focus is on the graphs.
Streamline data clean-up such that the code can be used for any user's data without amending the original code to account for that user's specific Netflix viewing activity.- Include the IMDb library to see how ratings correlate with viewing activity.
- Include viewing activity data from other streaming platforms' data (HBO, Hulu, etc.).
- Create a front end for it and make it more accessible.