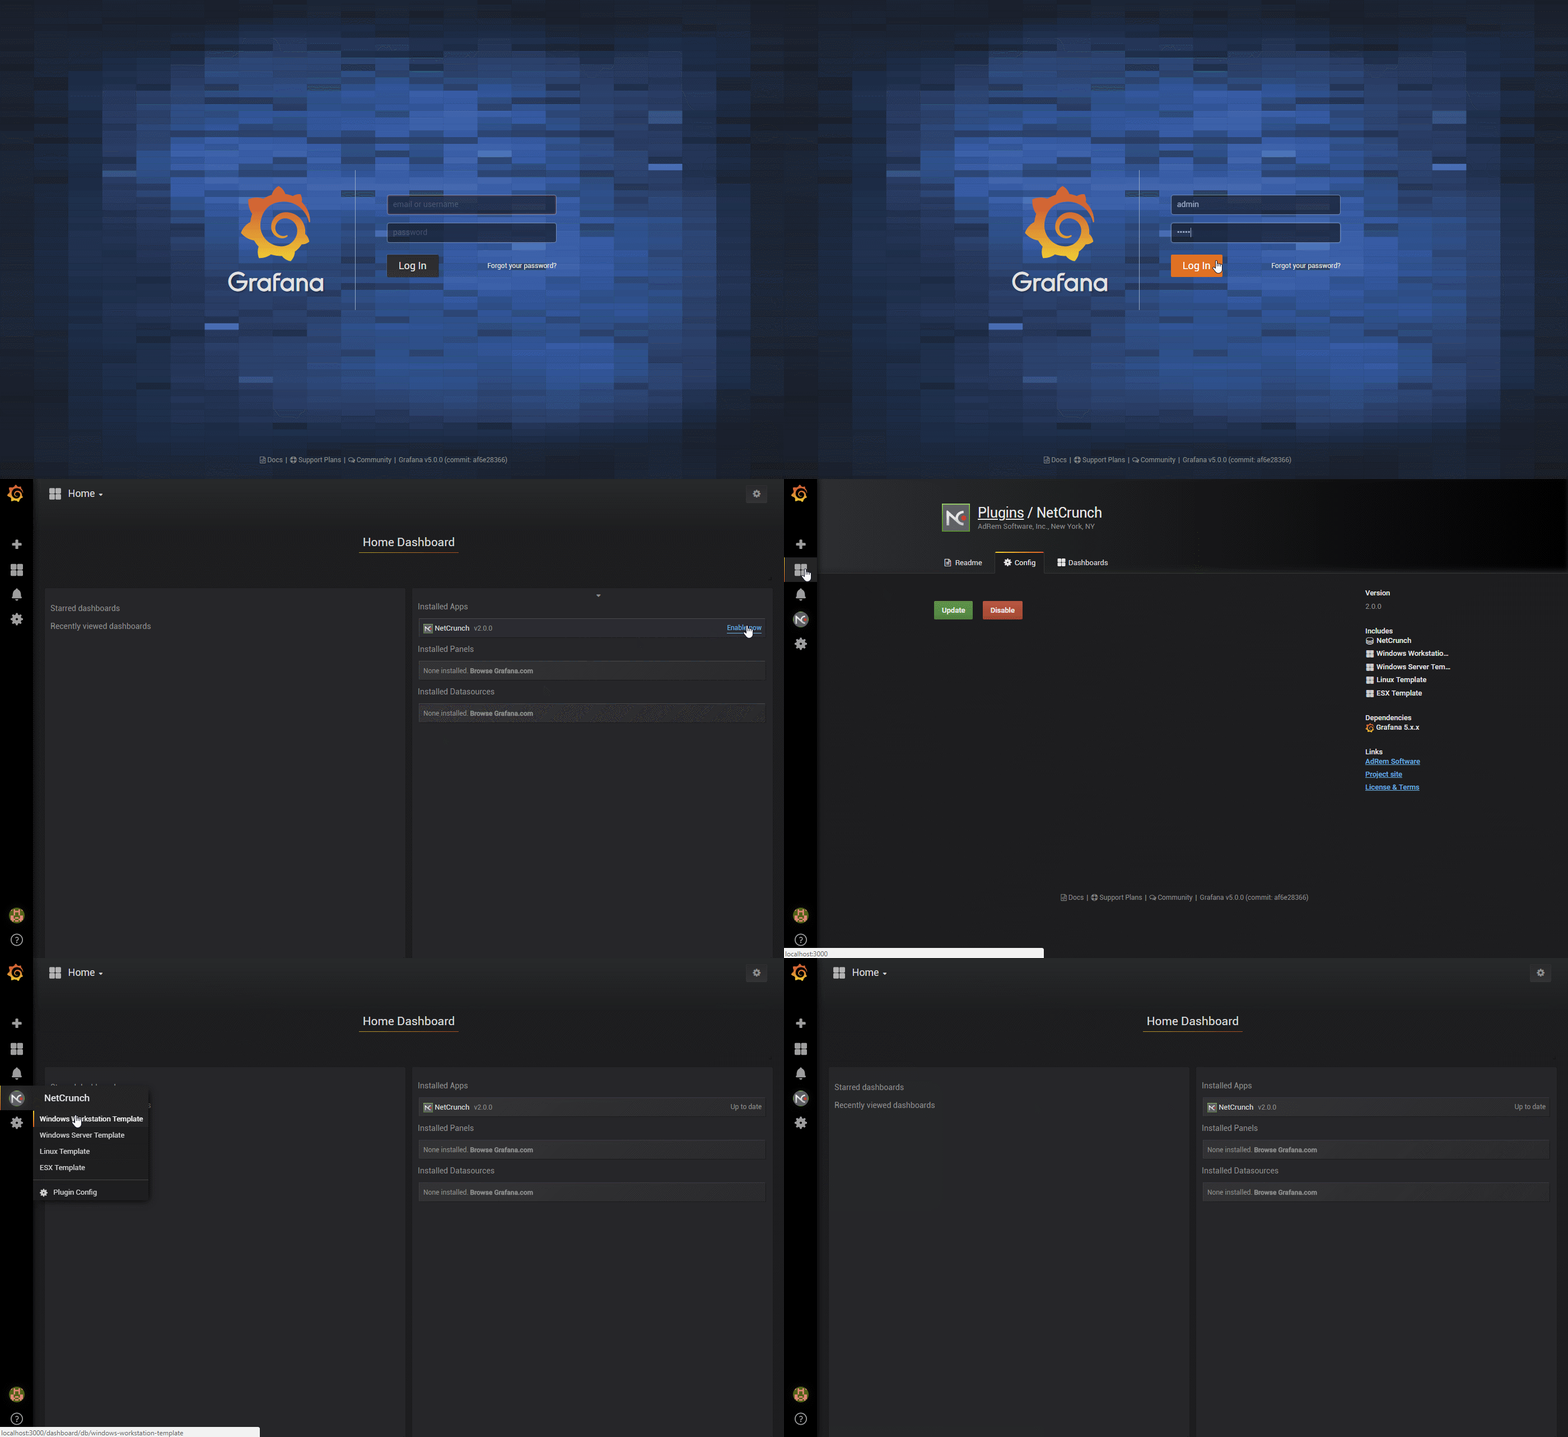
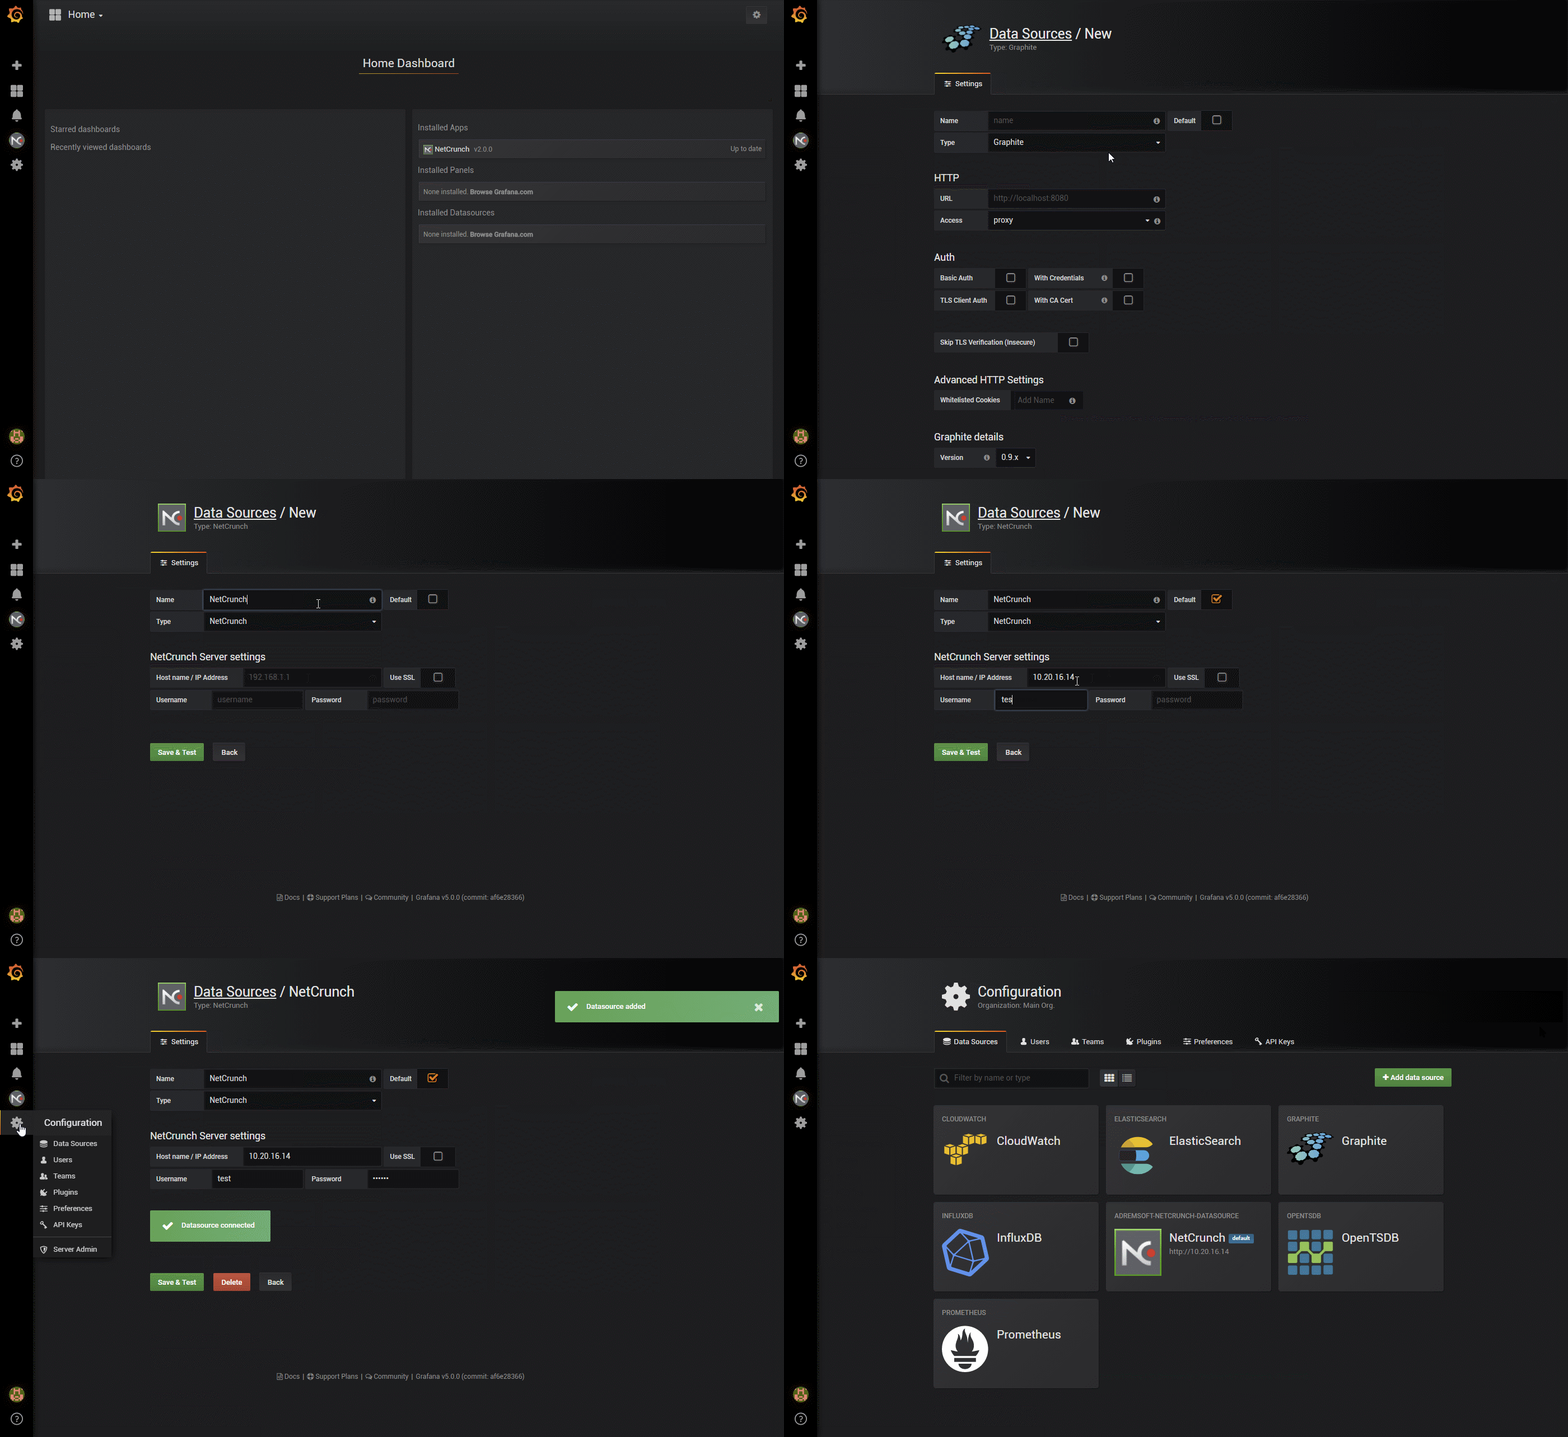
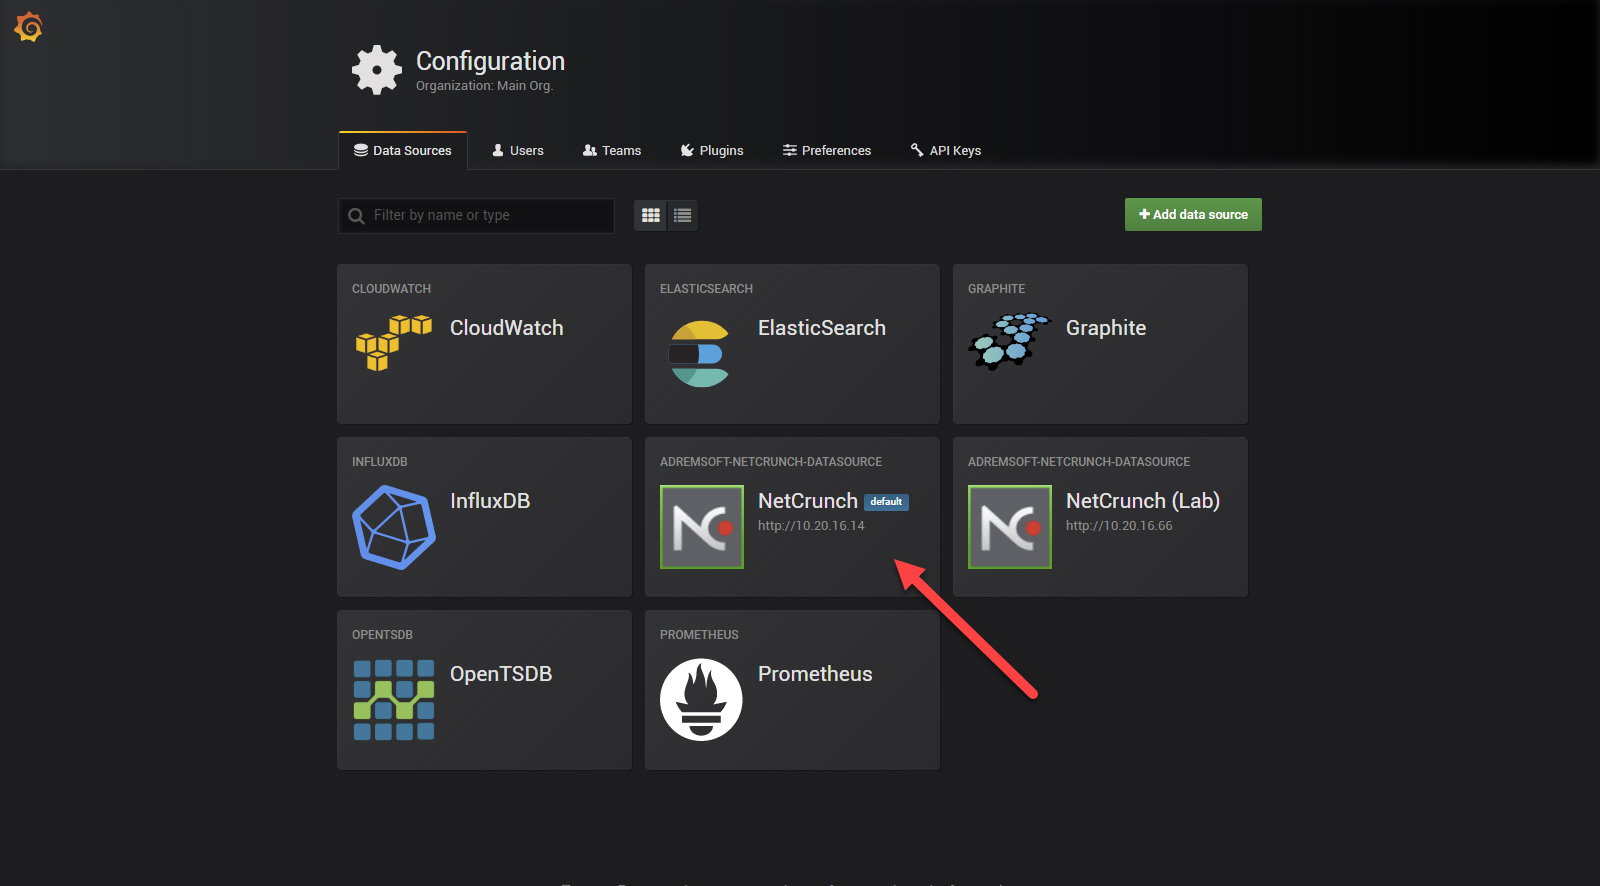
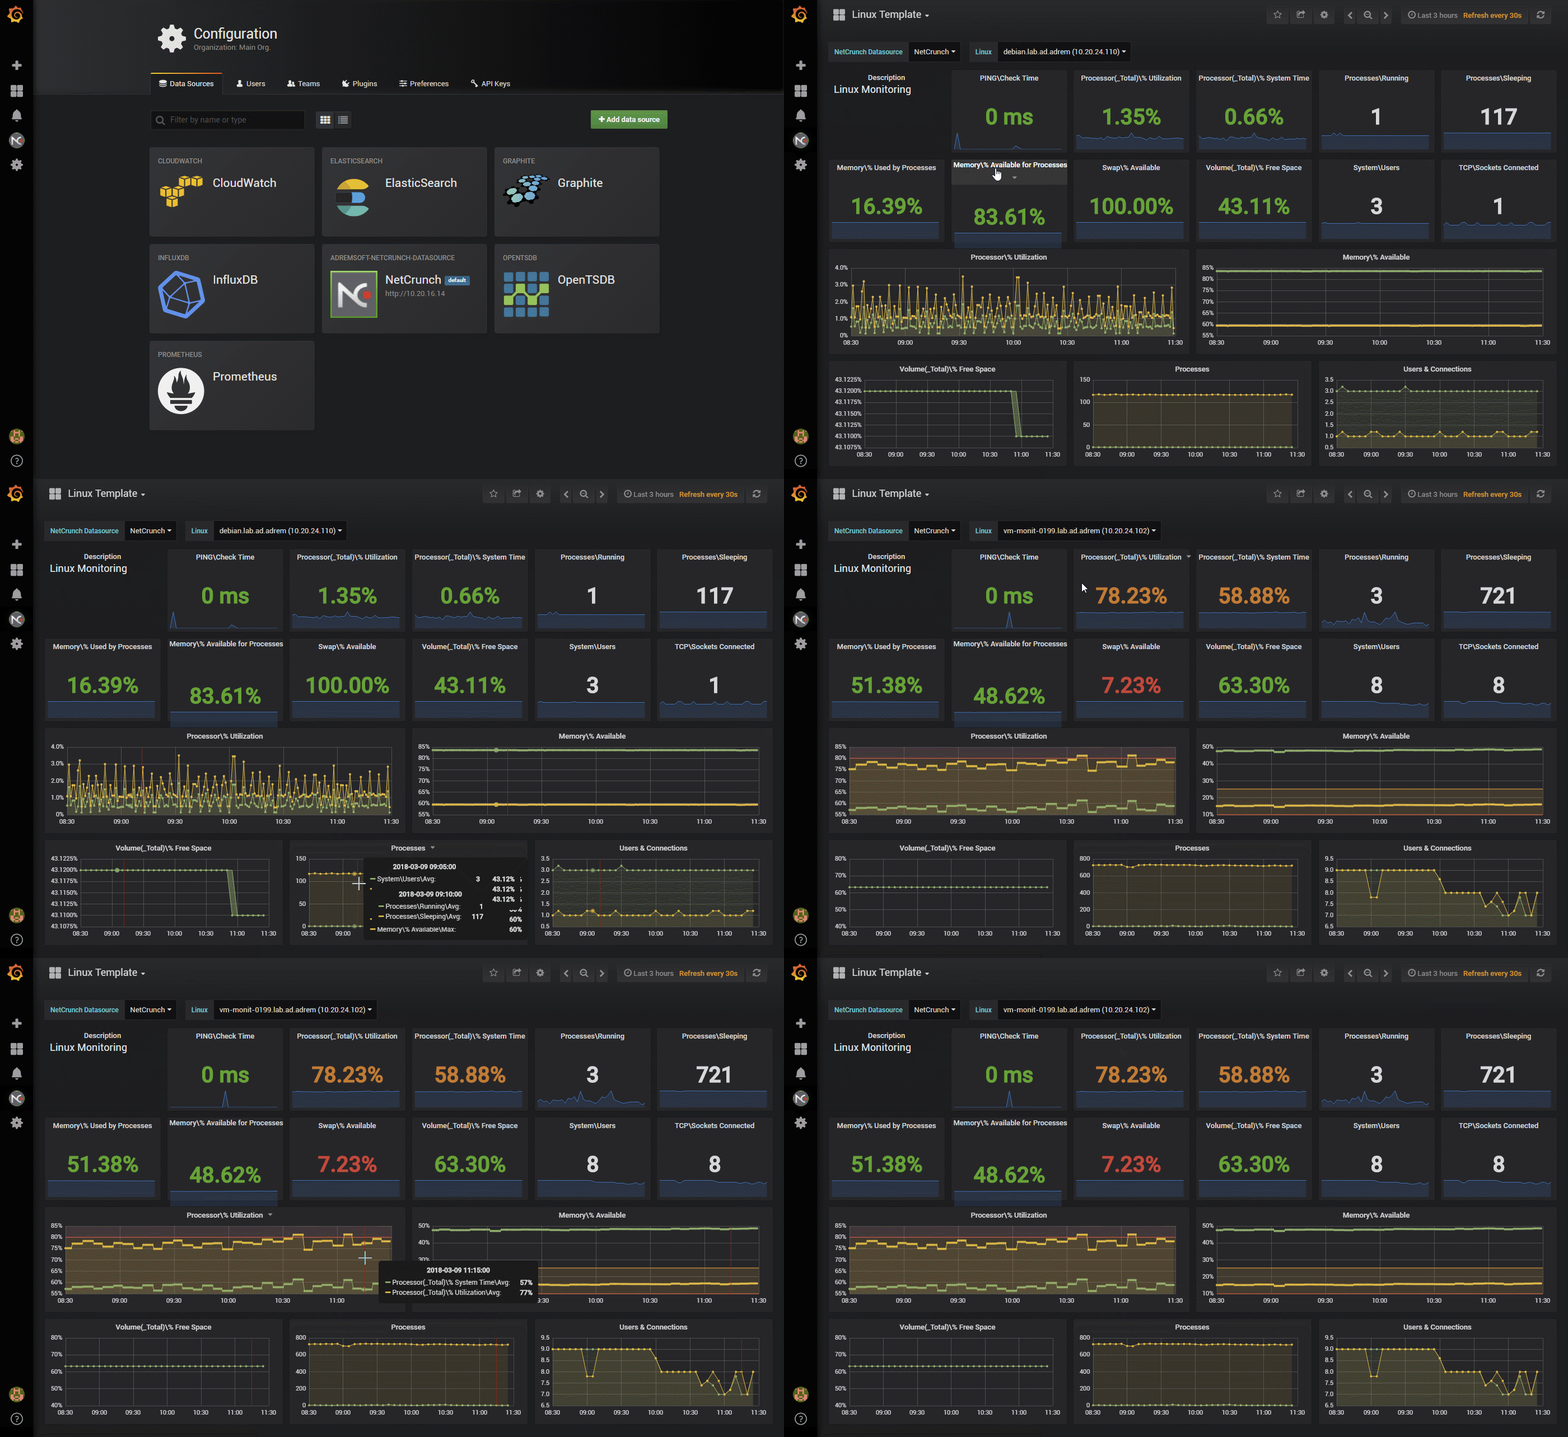
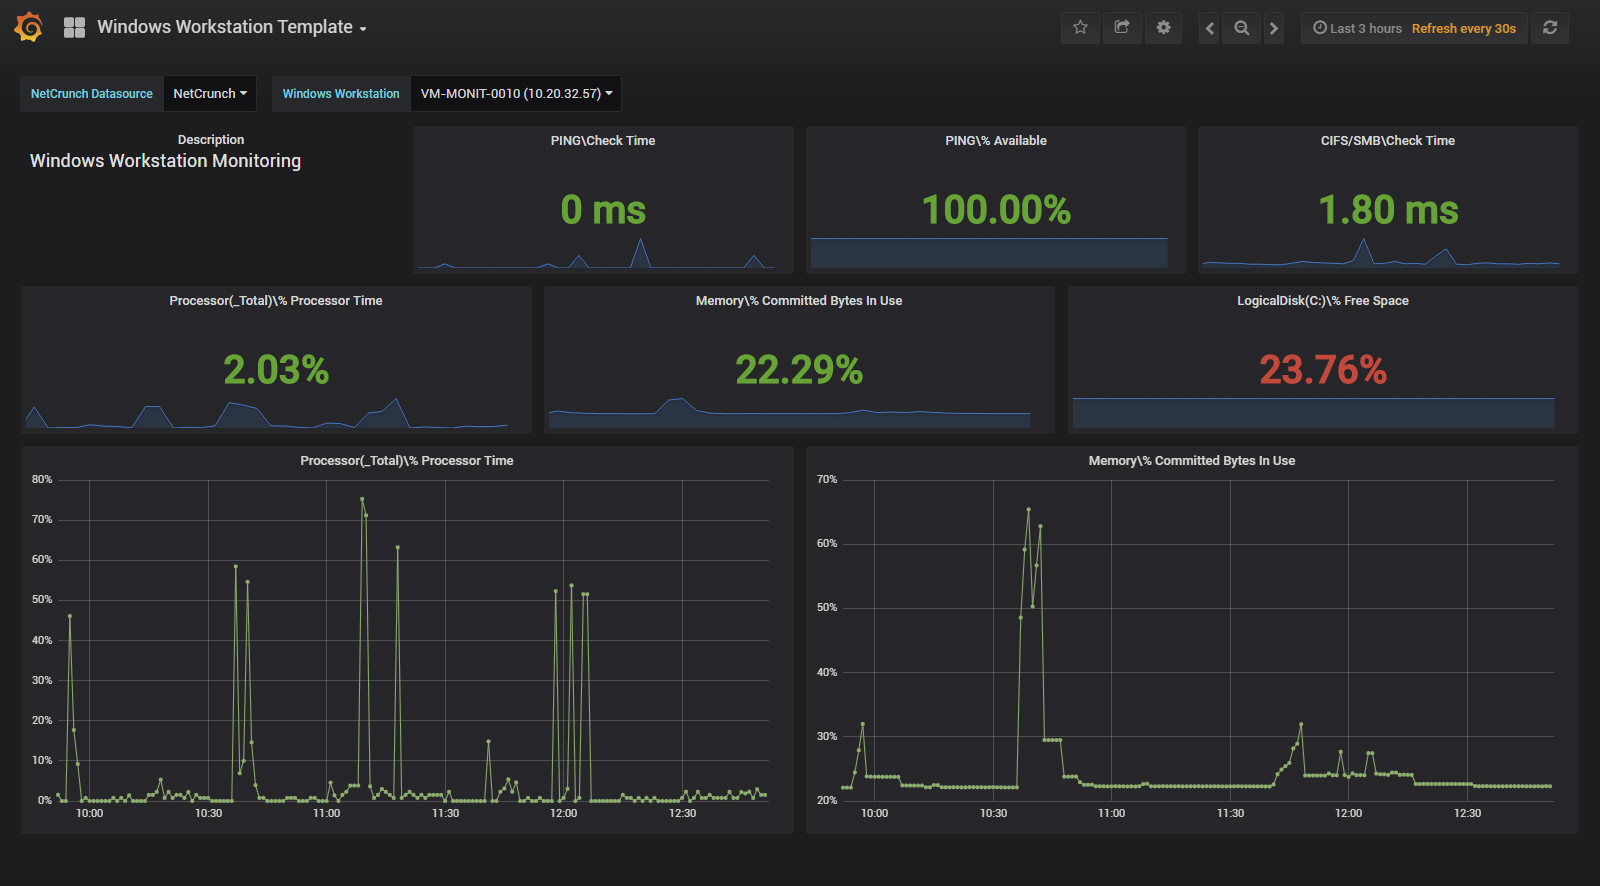
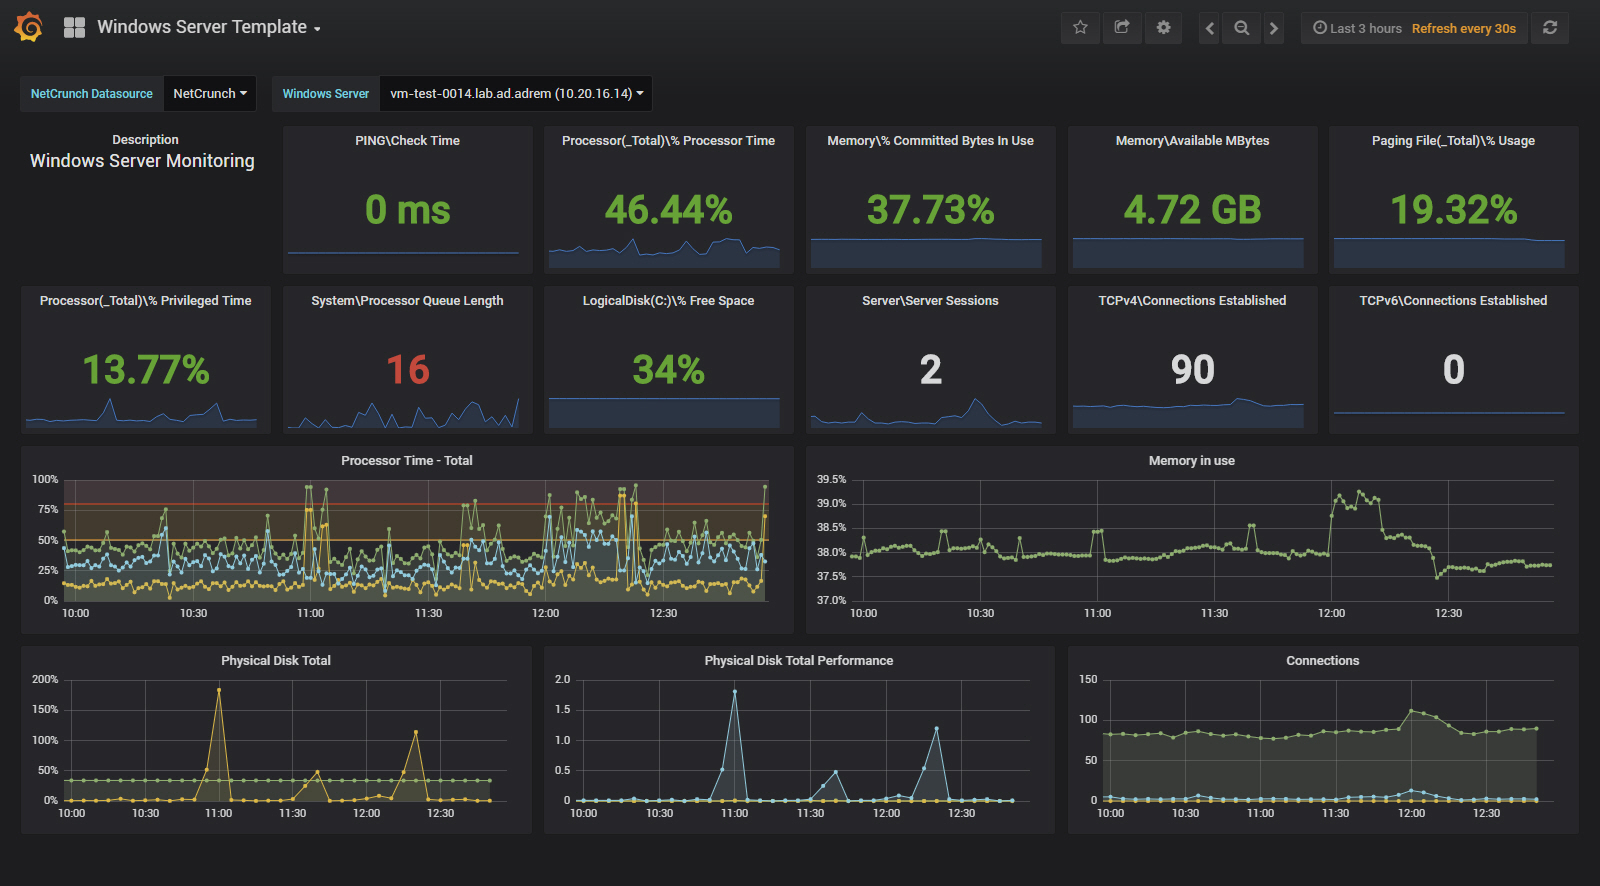
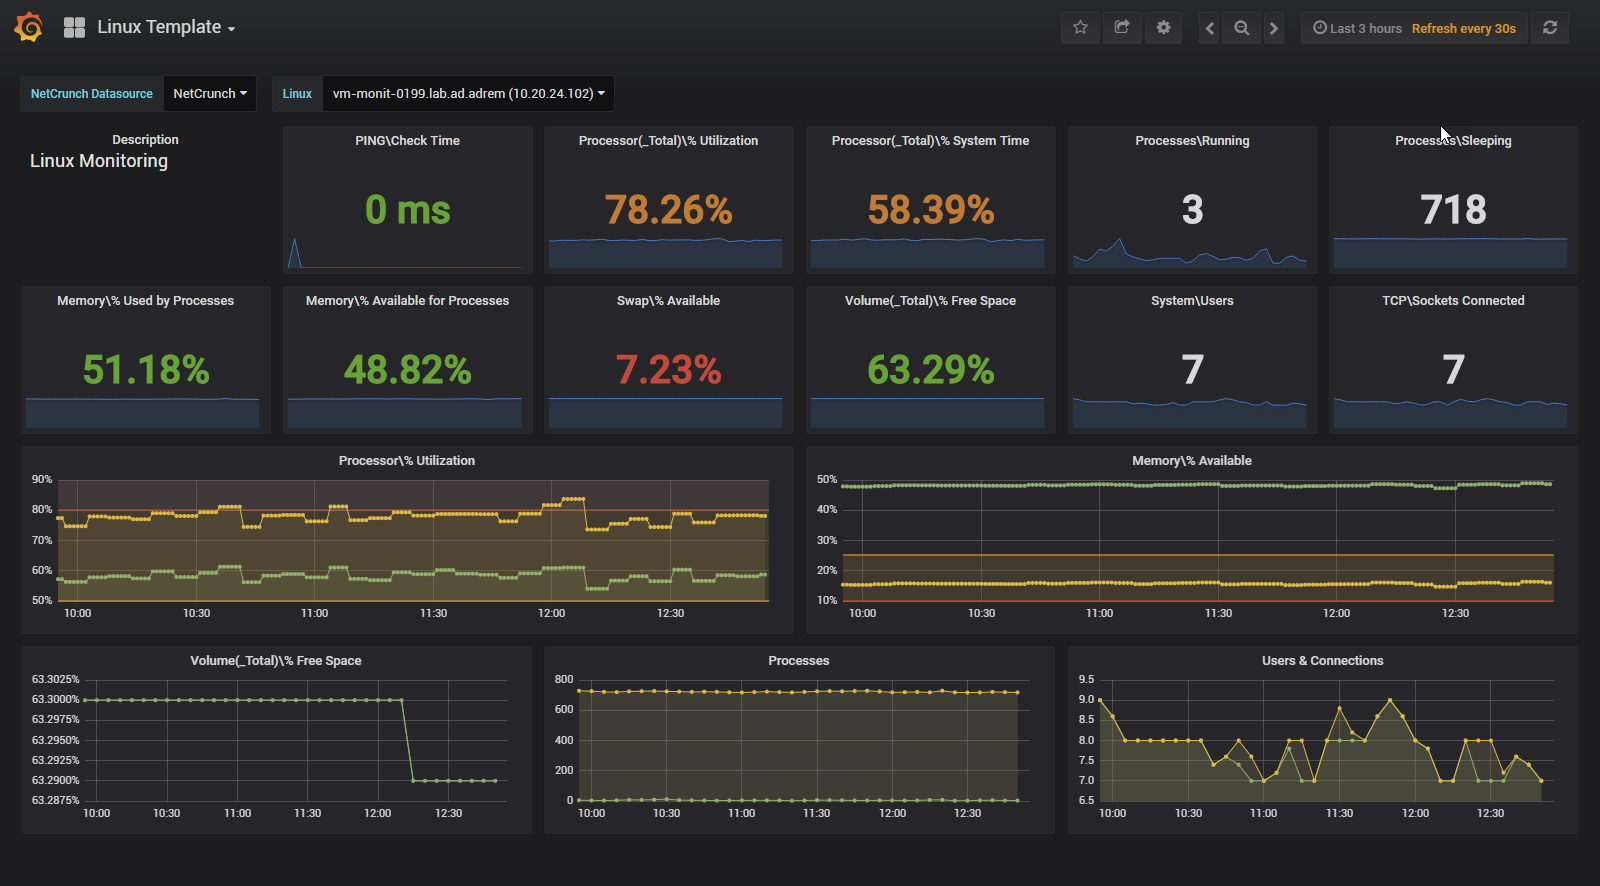
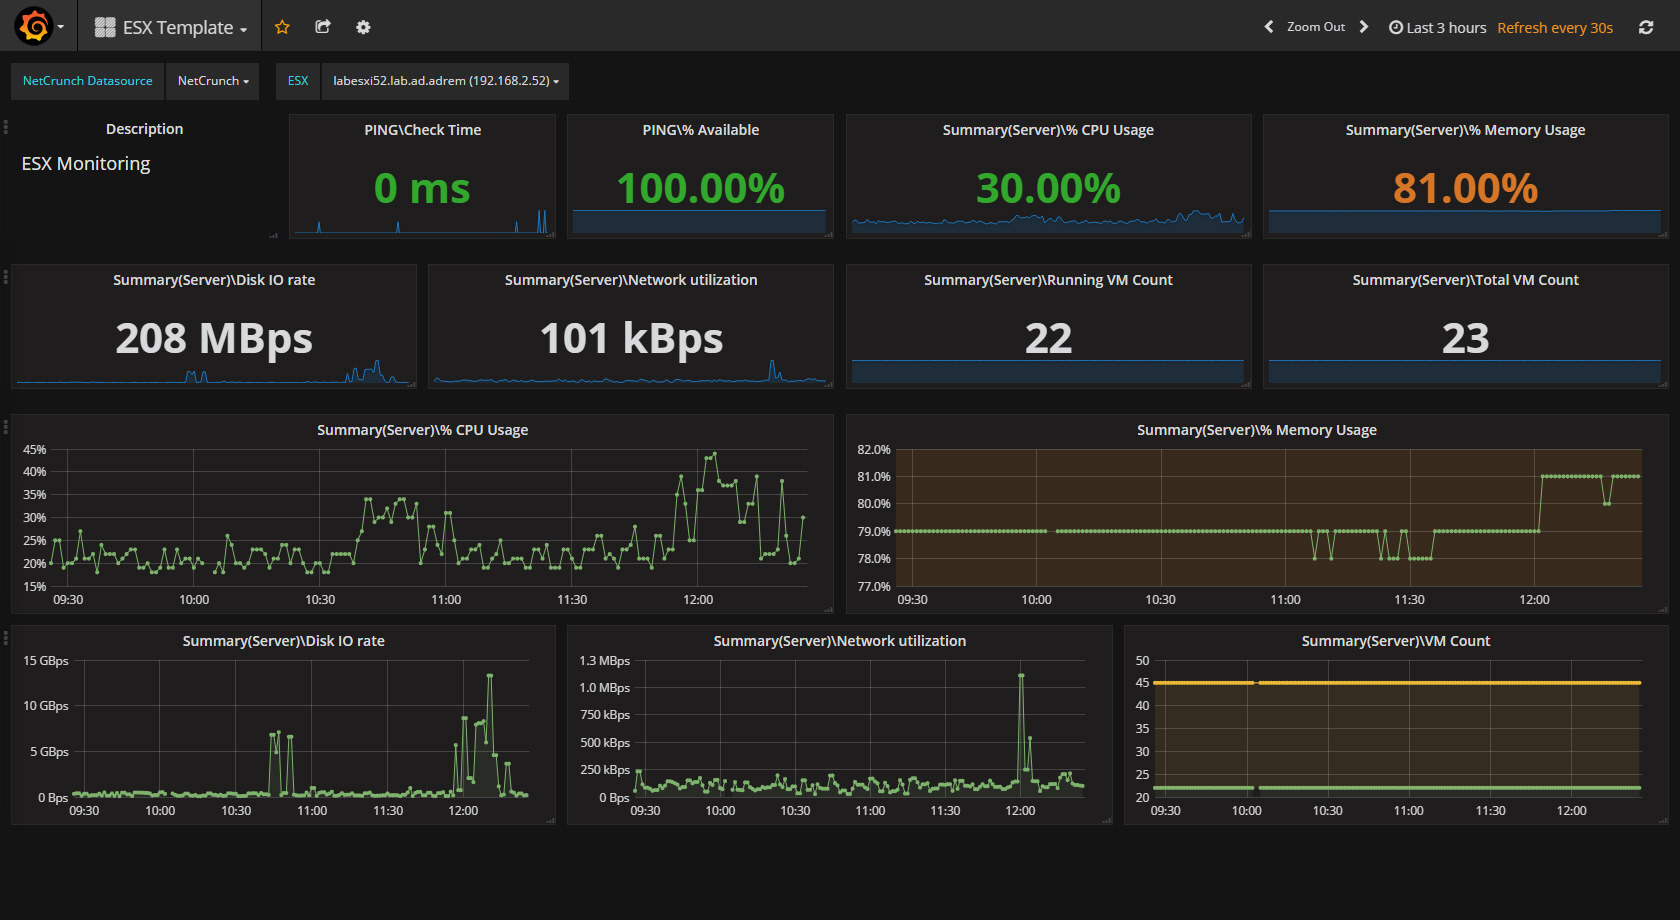
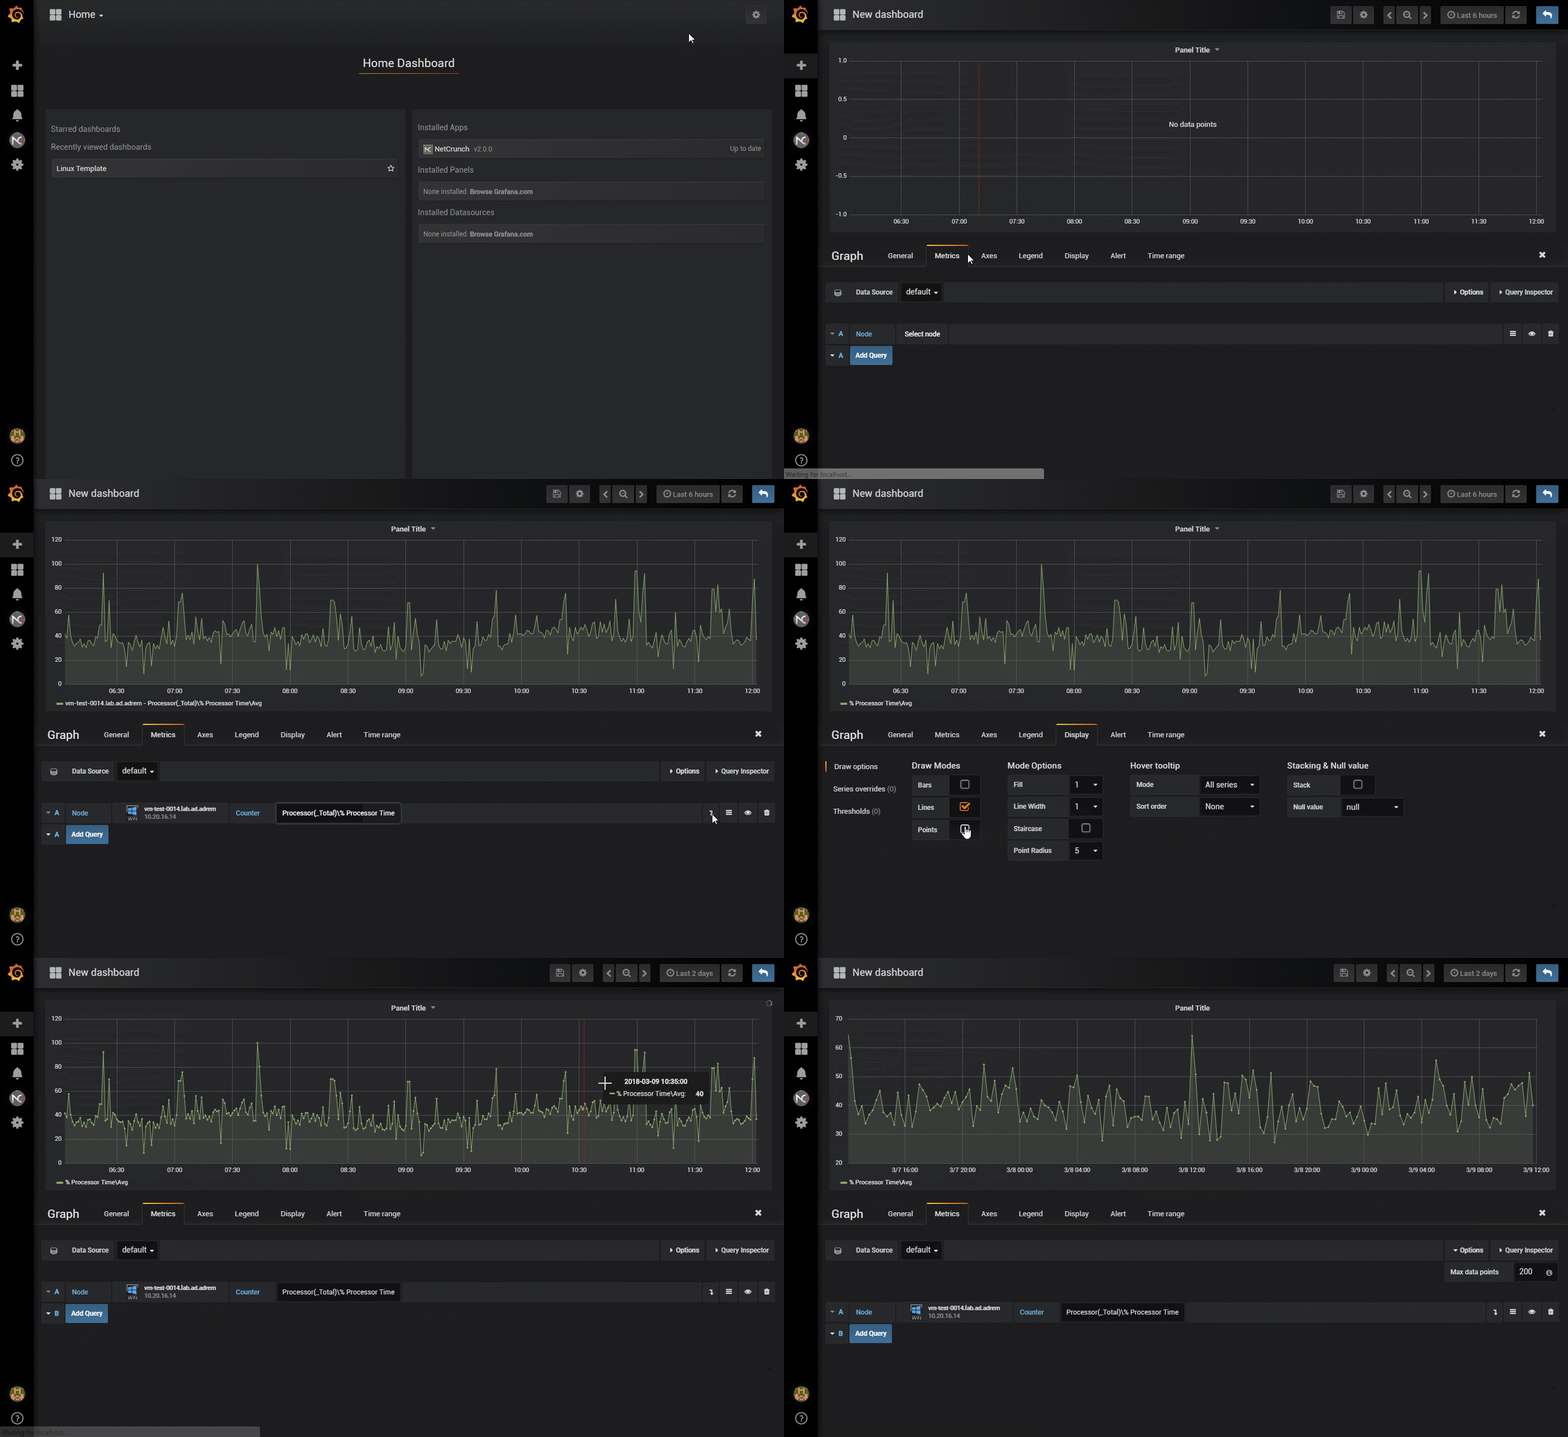
NetCrunch is a system of proactive and reactive network monitoring in a single package. NetCrunch App for Grafana allows to visualize time series data gathered in NetCrunch trend database.
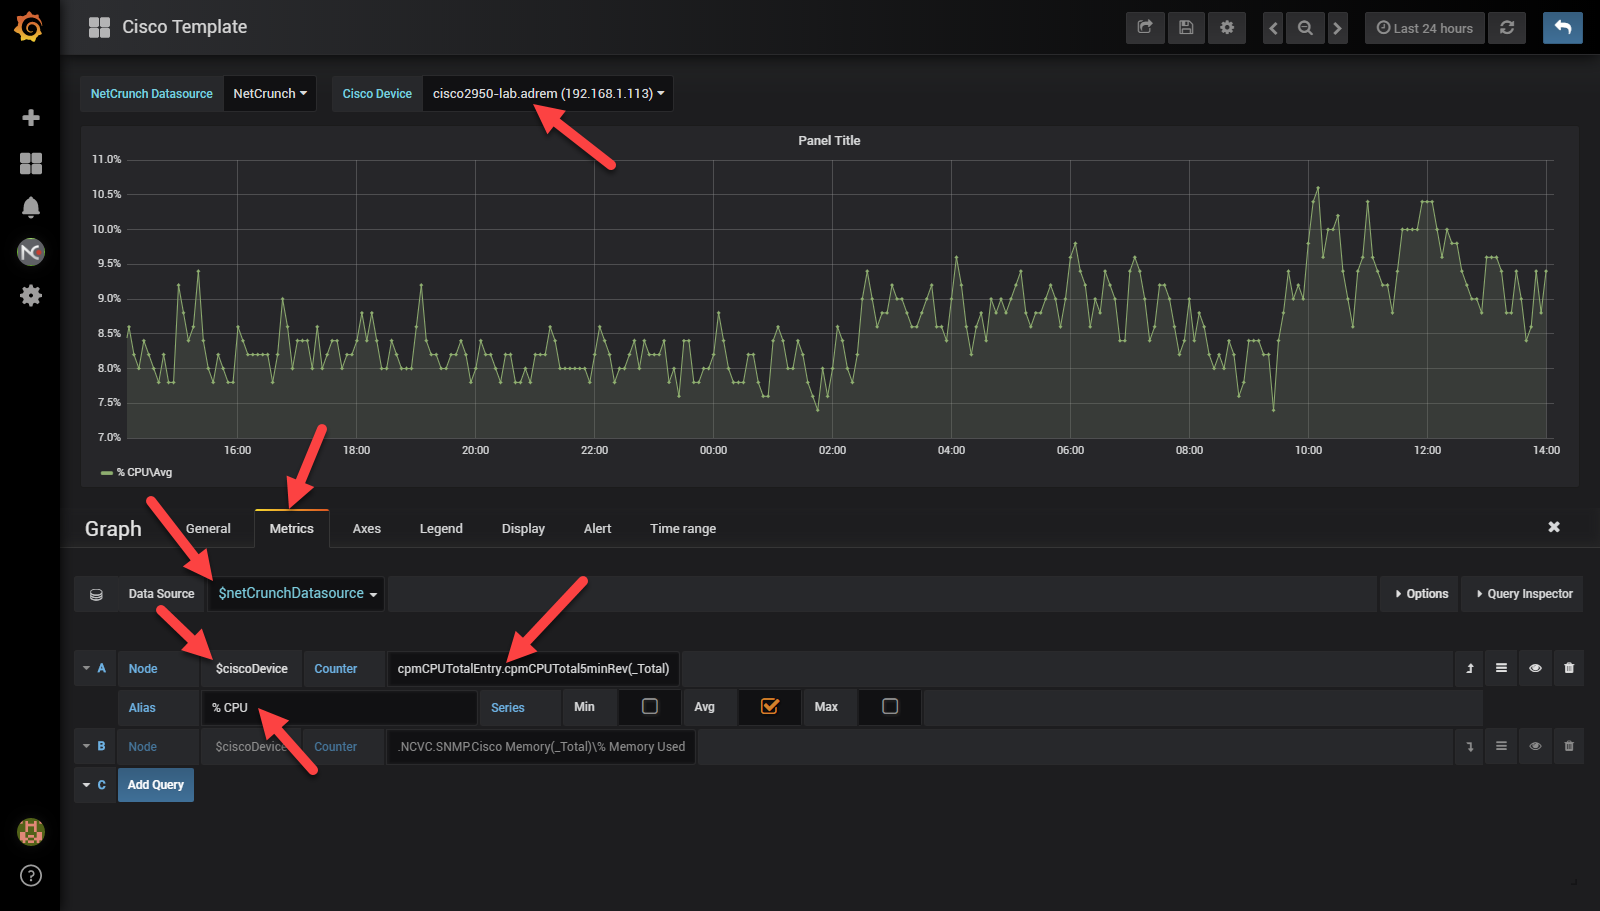
Current version of plugin works with NetCrunch 10 and has support for template queries which allow filtering network nodes for specific Network Atlas View or Monitoring Pack. It allows to define dashboard template for counters which belong to specific monitoring pack or network nodes grouped in specific atlas view.
The query is used to filter the nodes available in the template and should have following syntax:
<query> ::= 'nodes'['.'<map> | '.'<monitoringPack>]['.'<nodeType>]
This part of the query is obligatory and gives all nodes from the network atlas.
The simplest possible query that returns all atlas nodes is nodes.
This selector allows to filter the nodes that belongs to particular atlas map. To select the map it's necessary to specify a atlas group, folders and view using the following syntax:
networkAtlas("group name").folder("folder name").view("view name")
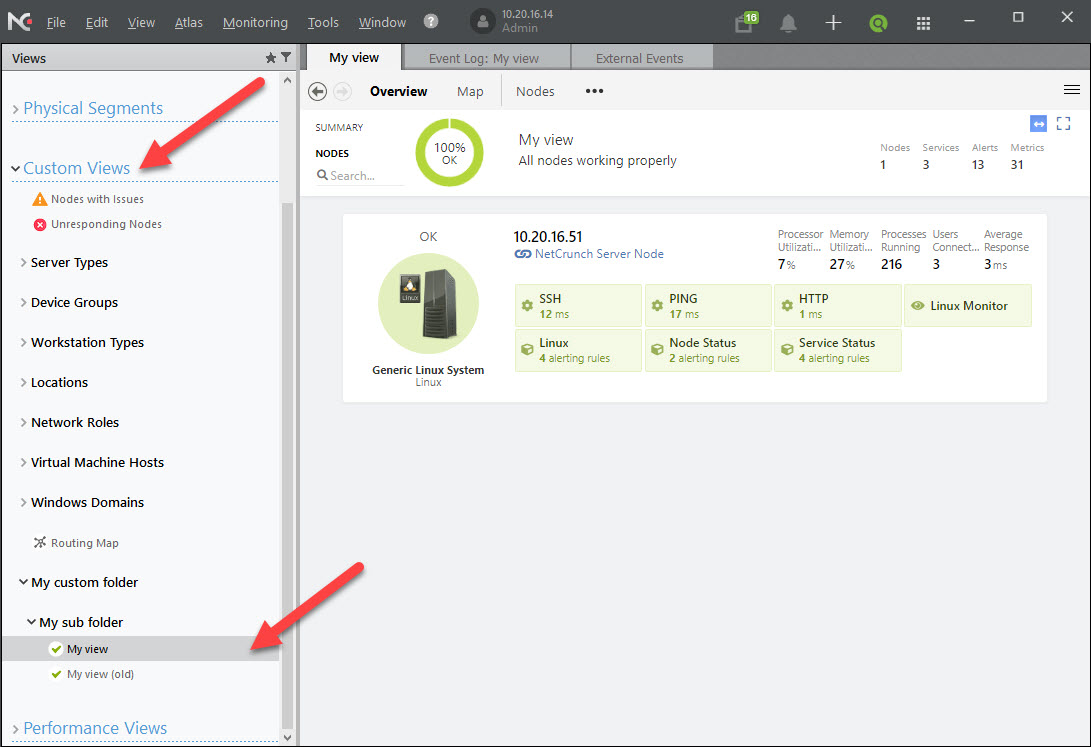
The query to filter out the nodes belonging to the view shown in the image below is as follows:
nodes.networkAtlas("Custom Views").folder("My custom folder").folder("My sub folder").view("My view")
Characters ( ) " occurring in names must be quoted by \. To get nodes from view My view (old)
query should be:
nodes.networkAtlas("Custom Views").folder("My custom folder").folder("My sub folder").view("My view \(old\)")
This selector allows to filter the nodes to which specific monitoring pack has been added. To select the monitoring pack it's necessary to specify a monitoring pack's folder, sub-folder and name using the following syntax:
nodes.monitoringPacks.folder("Folder name").folder("Sub-folder name").name("Monitoring pack name")
Hint: English names of build-in monitoring packs will be work for each language version of NetCrunch.
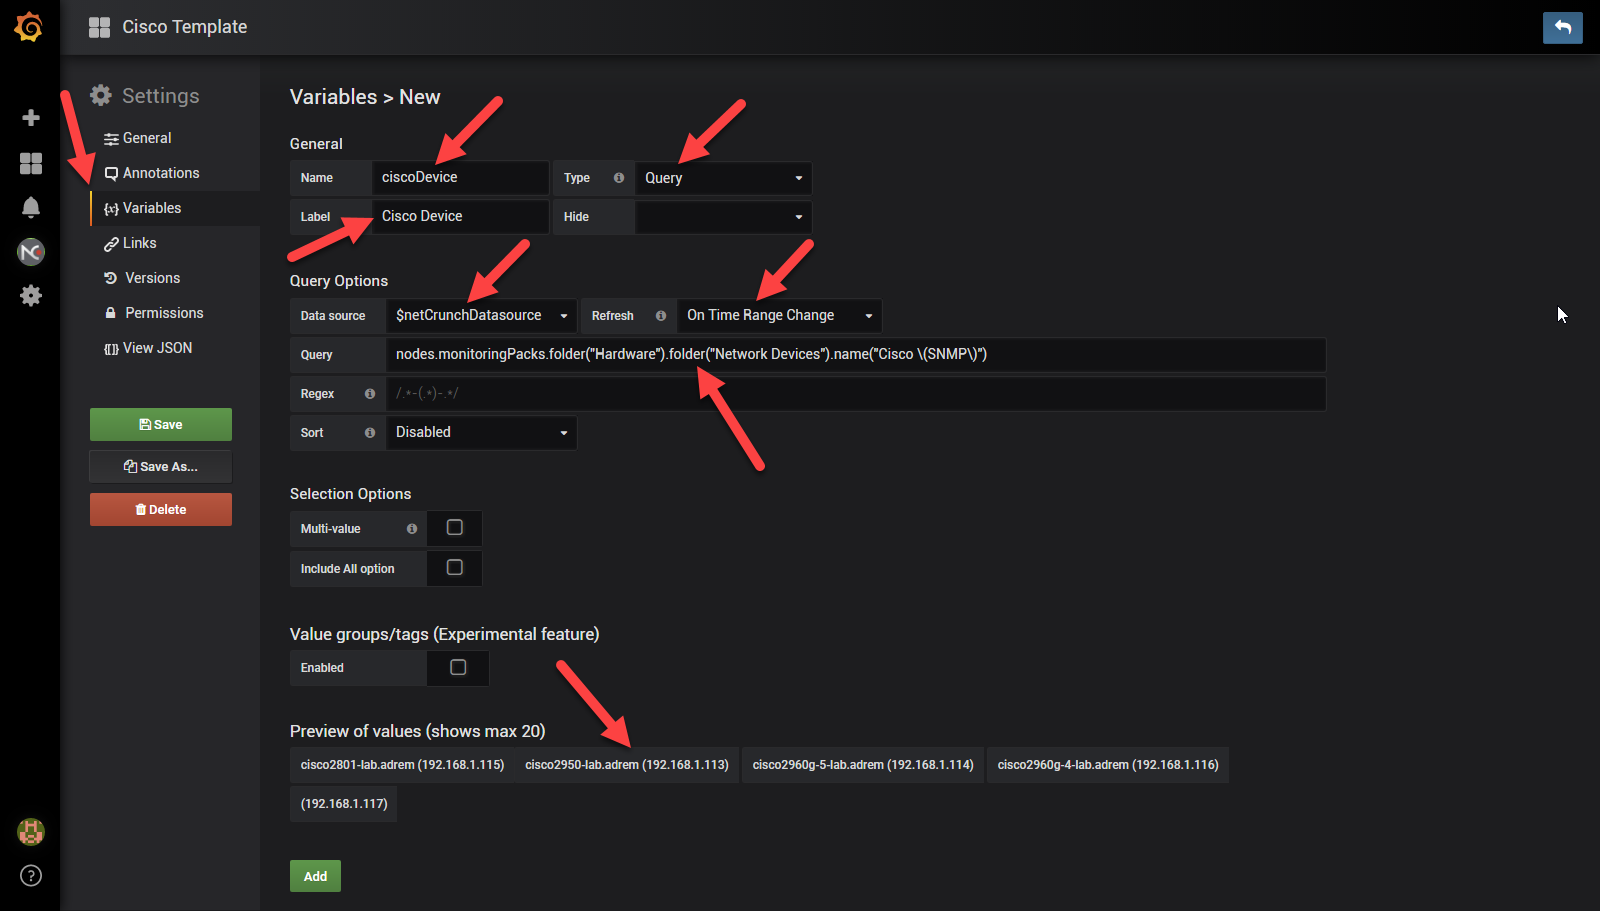
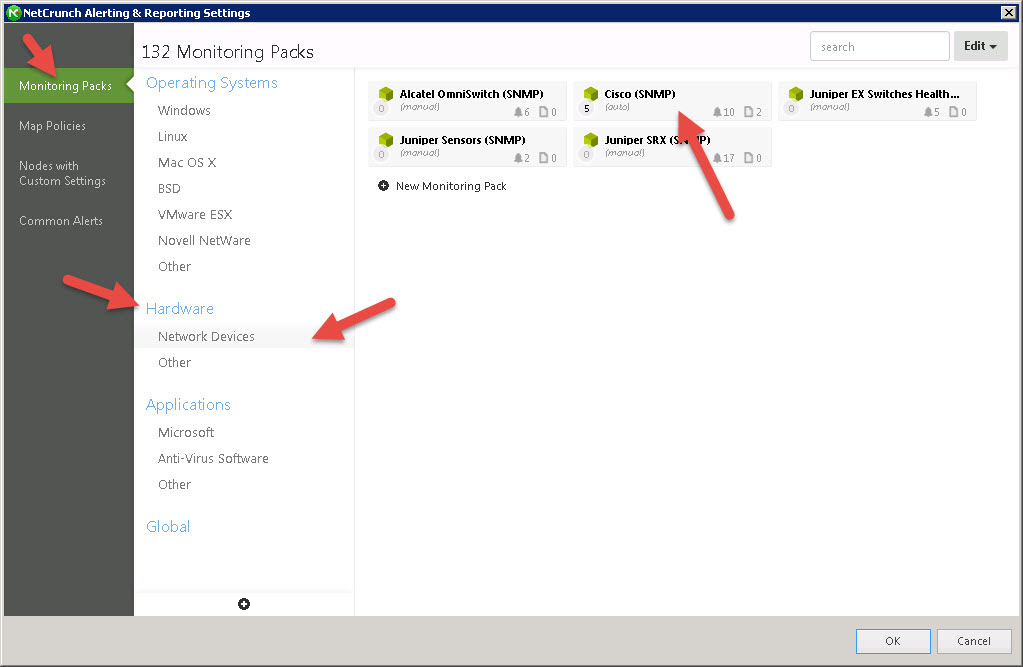
The query to filter out the nodes to which monitoring pack shown in the image below has been added is as follows:
nodes.monitoringPacks.folder("Hardware").folder("Network Devices").name("Cisco \(SNMP\)")
This selector is used to filter nodes by type and may be combined with other selectors. The types of nodes that can be filter are as follows:
- windows
- windows.server
- windows.workstation
- linux
- bsd
- macos
- solaris
- esx
- xenserver
- unix
- novell
- ibm
The query to filter out all linux nodes from a specific IP network is as follows:
nodes.networkAtlas("IP Networks").folder("Local").view("192.168.0.0/22").linux
- Support for template queries which allow filtering network nodes for specific Network Atlas View or Monitoring Pack. It allows to define dashboard template for counters which belong to specific monitoring pack or network nodes grouped in specific atlas view.
- Refactoring the settings of Max data points for datasource, base on the new Grafana mechanism.
- NetCrunch datasource
- Templates: esx, linux, windows-server, windows-workstation
npm install
grunt build
Update value of developmentDest in Gruntfile.js.
grunt develop
grunt watch
