Diagram as Code.
Important
Due to the fact that the upstream project seems to be inactive and non-processing/non-responsive to new Issues or Pull Requests for more than 2 years,
the artifacts supporting Open Telekom Cloud has been moved to their own package.
Nevertheless, the repository retains its downstream status and any change that might come in the future either in the other
providers artifacts or in the code itself, will be synced.
Unless nothing changes, the package name in PyPi is from now on diagrams-otc.
Diagrams lets you draw the cloud system architecture in Python code. It was born for prototyping a new system architecture design without any design tools. You can also describe or visualize the existing system architecture as well. Diagrams currently supports main major providers including: AWS, Azure, GCP, Kubernetes, Alibaba Cloud, Oracle Cloud etc... It also supports On-Premise nodes, SaaS and major Programming frameworks and languages.
Diagram as Code also allows you to track the architecture diagram changes in any version control system.
Note
It does not control any actual cloud resources nor does it generate cloud formation or terraform code. It is just for drawing the cloud system architecture diagrams.
in addition supports all the providers included in the original upstream:
It requires Python 3.7 or higher, check your Python version first.
It uses Graphviz to render the diagram, so you need to install Graphviz to use diagrams. After installing graphviz (or already have it), install the diagrams.
Tip
You can quickly install Graphviz either via pip: pip install graphviz (recommended) or via brew: brew install graphviz
Install the Diagrams for Open Telekom Cloud directly from Pypi choosing one of the following methods:
# using pip (pip3)
$ pip install diagrams-otc

# using pipenv
$ pipenv install diagrams-otc

# using poetry
$ poetry add diagrams-otc
and then you are ready to try your very first OTC diagram by executing the Python code below:
from diagrams import Diagram, Cluster
from diagrams.opentelekomcloud.computing import Ecs
from diagrams.opentelekomcloud.database import Rds
from diagrams.opentelekomcloud.network import Elb, Dns, Eip

with Diagram("Basic Web App", show=False):
    dns = Dns("dns")
    eip = Eip("eip")

    dns >> eip

    with Cluster("vpc"):
        elb = Elb("dns")

        with Cluster("app-subnet"):
            app = [Ecs("app1"),
            Ecs("app2")]

        with Cluster("db-subnet"):
            db_primary = Rds("primary")
            db_primary - [Rds("replica1"),
                        Rds("replica2")]

    eip >> elb >> app >> db_primary
save it in a python file, e.g. diagram.py and execute it with the following command:
python diagram.pywhich will generate an diagram in PNG format:
The list Open Telekom Cloud services currently supported can be found here.
Note
The rest of the documentation and examples refer to the original upstream site as is.
You can start with quick start. Check out guides for more details, and you can find all available nodes list in here.
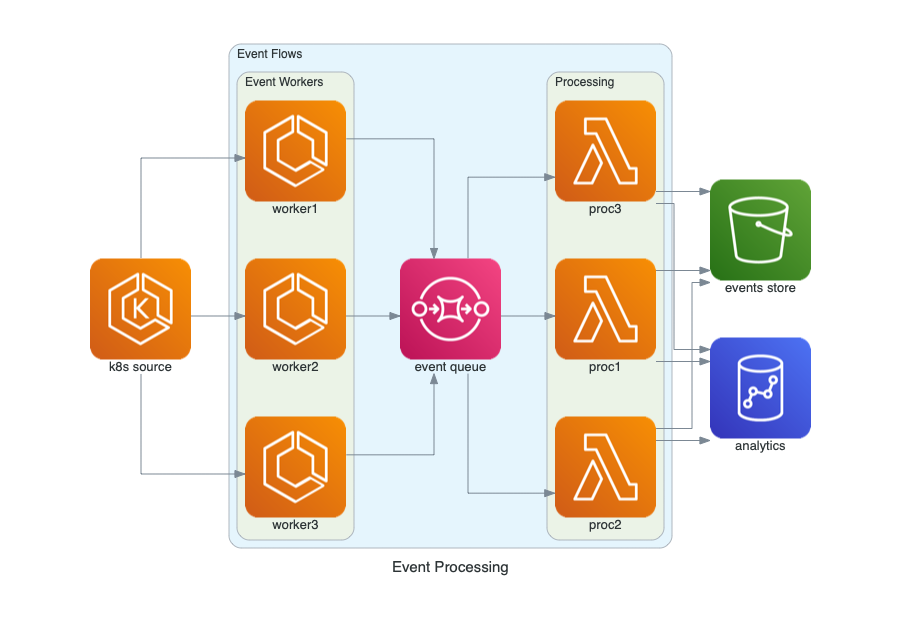
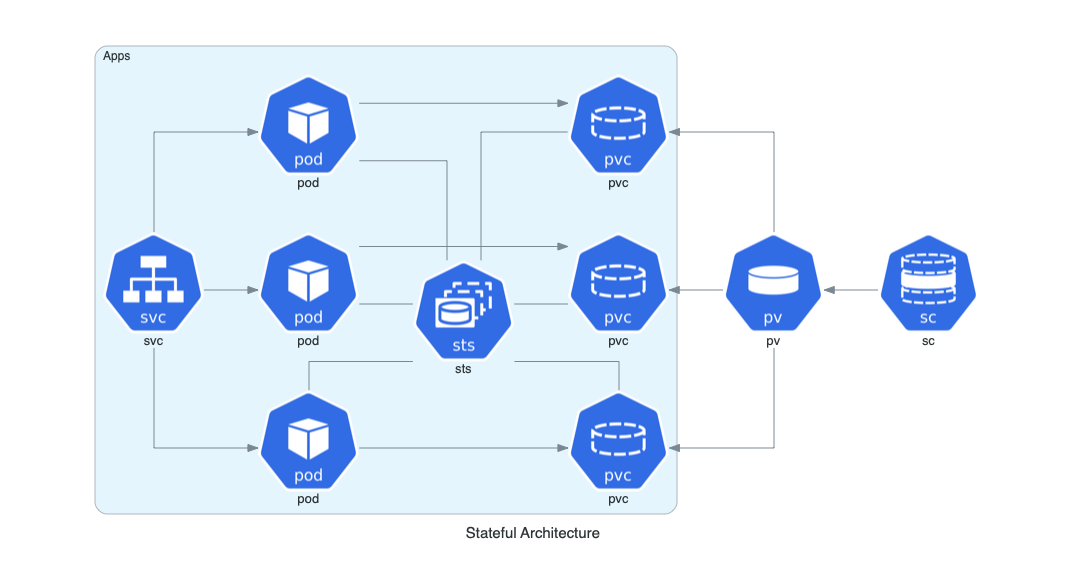
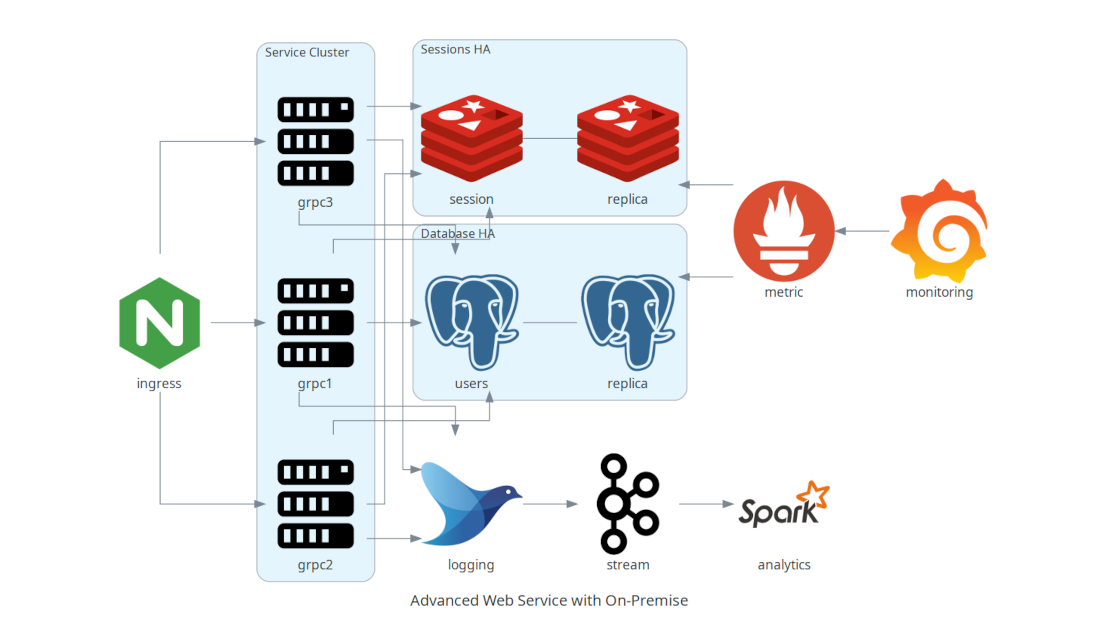
| Event Processing | Stateful Architecture | Advanced Web Service |
|---|---|---|
 |
 |
 |
You can find all the examples on the examples page.
To contribute to Diagrams by adding a new provider or additional Open Telekom Cloud services, check out contribution guidelines.
If you are familiar with Go, you can use go-diagrams as well.


