tadaa cloud code apigee hybrid javacallout debugging
- TADAA Stands for Troubleshooting and Debugging for Apigee: Advanced
This walkthough assumes that:
- you're working in a home folder of your Cloud Shell instance;
- your current gcloud account is athenticated
- your kubectl current context is pointing on a correct cluster that contains apigee hybrid instance we are going to debug.
In Kubernetes there are many ways to enable your containers for remote debugging. In any case, debugging is a trainsient experience. We need to track what we are changing for a debugging session and how to reset it.
In Apigee Hybrid,
ApigeeDeployment CRD creates apigee-runtime-$ORG-$ENV-$VERSION-$ID ReplicateSet manifest which creates apigee-runtime-$ORG-$ENV-$VERSION-$RSID-$PODID managed pod.
To remind, that means if we edit a pod, and it will get deleted, a newly-created pod will be configured by a Replica Set. In a same way, if we edit a Replica Set manifest, then re-create it (delete the replica set or re-run apigeectl with changes), the Replicat Set configuration will be reset to the one that ApigeeDeployment defines.
In our case, we have to configure two items:
-
jvm-debugport that exposes container's remote debugging port; -
JAVA_TOOL_OPTIONSenvironment variable that configures jvm remote debugging options.
Then we need to delete a pod. The Replica Set will create a new pod with remote debugging settings.
When we are ready to reset the debugging configuration, we can just delete the Replica Set. ApigeeDeployment will recreate it with correct original configuration.
Cloud Code for Cloud Shell is an IDE like VS Code that is preconfigured in your GCP Cloud Shell. Not only it contains extensions that speed up your Kubernetes tasks, but it also contains an integrated debugger as a part of the Skaffold.
Of course, you can use Eclipse or VIM, but you know what, they need to be installed and connectivity needs to be taken cared. With CloudShell and Cloud Code it's already there. So, let's use it.
?. Open ssh.cloud.google.com as a new terminal session you are going to work in.
?. Let's verify that there is a single apigee-runtime Replica Set
kubectl get rs -n apigee
?. For convenience, define RS variable that containts the apigee-runtime Replica Set.
export RS=$(kubectl get rs -n apigee |grep apigee-runtime |awk '{print $1}'); echo $RS
?. Edit Replica Set manifest.
Either use kubectl edit command or use GKE Workloads YAML editor to add two stanzas of the apigee-runtime Replica Set
kubectl edit rs -n apigee $RS
?. ?. Locate port: section and add three lines that patch the debug port 50005 for the apigee-runtime container name: apigee-runtime
        - containerPort: 50005
          name: jvm-debug
          protocol: TCP
Like this:

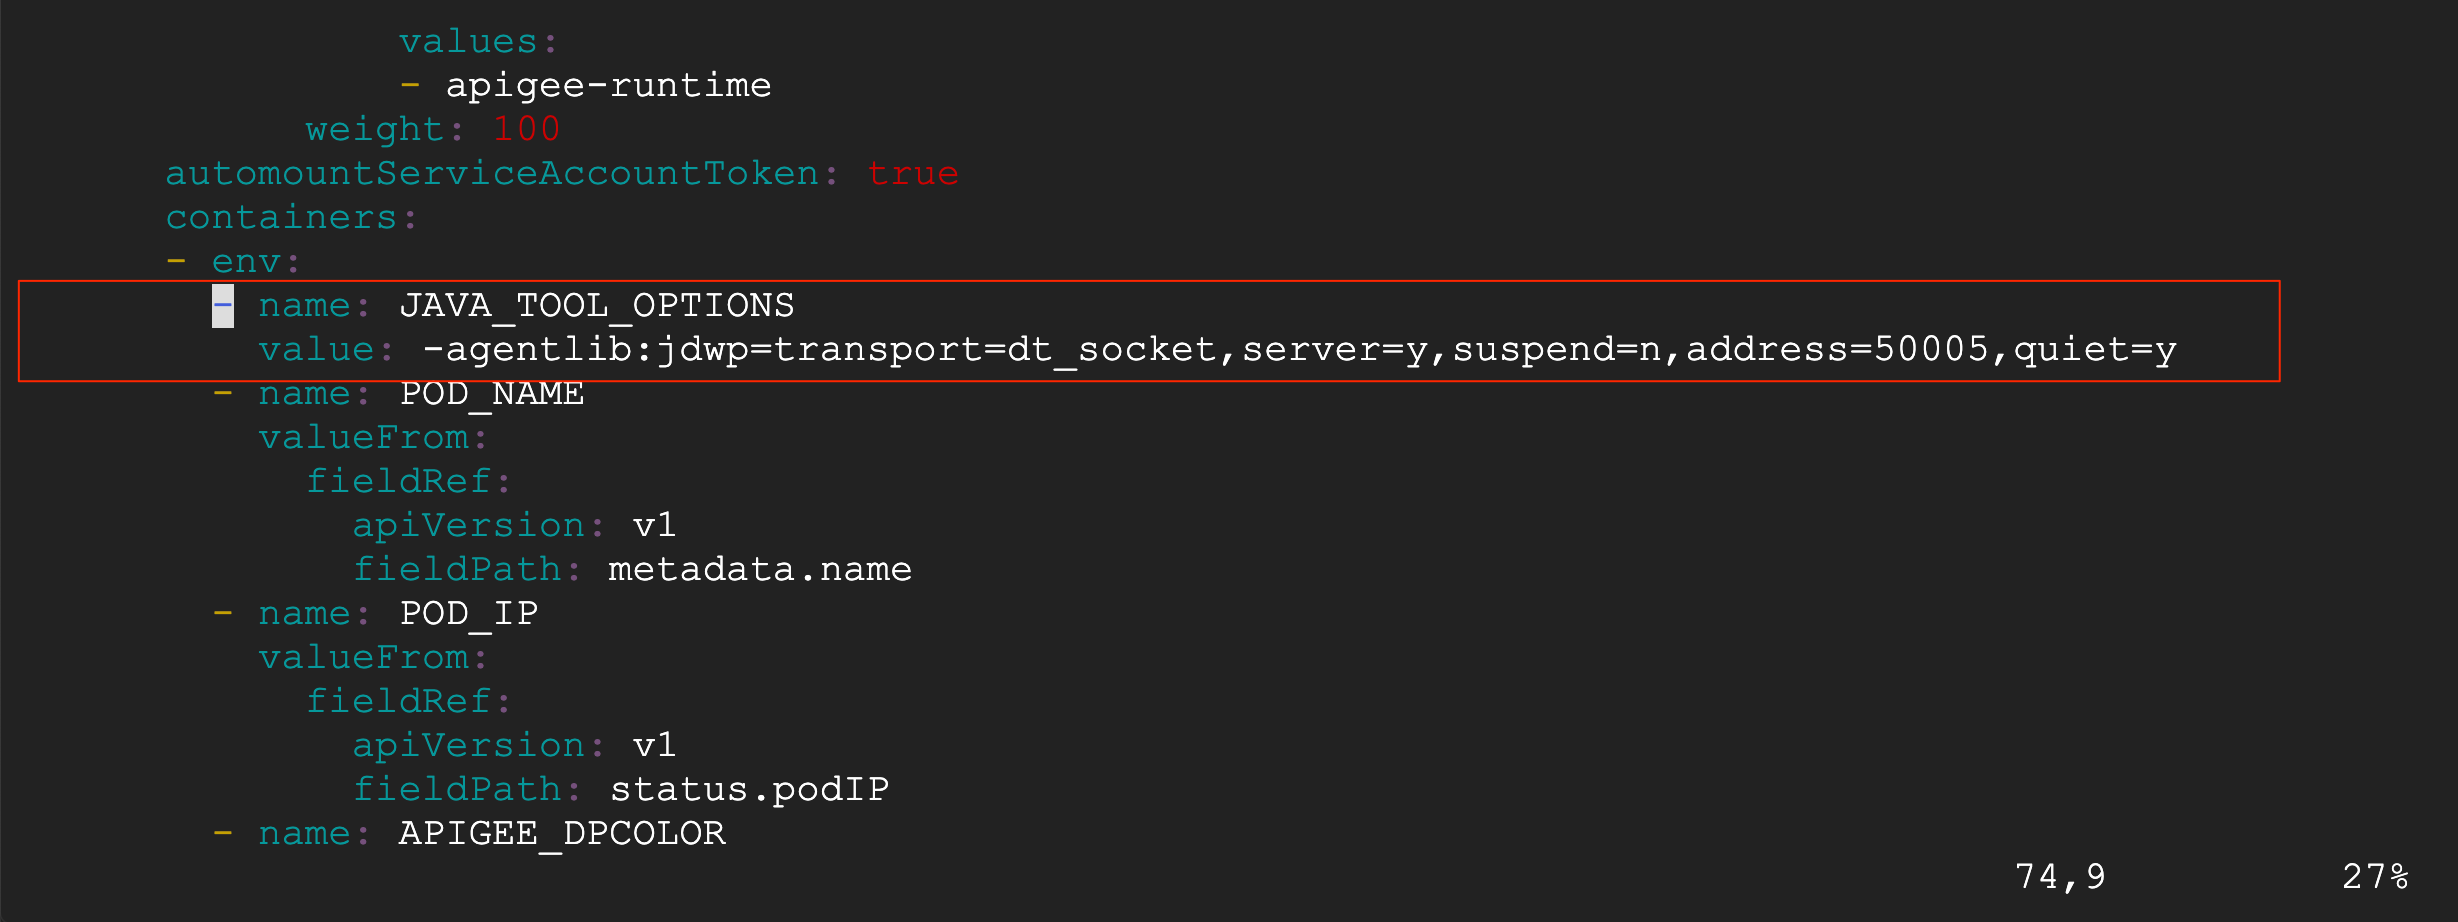
?. Add container environment variable for container name: apigee-runtime at the containers:env: location
        - name: JAVA_TOOL_OPTIONS
          value: -agentlib:jdwp=transport=dt_socket,server=y,suspend=n,address=50005,quiet=y
See the snapshot for reference:
?. Save changes.
?. List apigee runtime pods
kubectl get pods -n apigee
?. Pick up a pod we are going to debug
export POD=$(kubectl get pods -n apigee |grep apigee-runtime |awk 'NR==1{print $1}'); echo $POD
? Delete the pod
kubectl delete pod -n apigee $POD
?. Make a notice of a new one created. For a single pod, the last token of an apigee-runtime pod has changed.
kubectl get pods -n apigee
In a general case, there might be multiple pod instances. We want to work with any one of them.
?. For a convenience, again define a POD variable that holds the name of a remote-debug enabled container
export POD=$(kubectl get pods -n apigee |grep apigee-runtime |awk 'NR==1{print $1}'); echo $POD
?. Verify that the container has required manifest changes
kubectl get pod -n apigee $POD -o yaml
?. Add a label that we will use to help Cloud Code debugger which pod we want to debug.
As debugging is not supported for multiple pods, we want to control explicitly which pod we want to debug. And even if you start with a single pod, situations will arise when will Kubernetes will create other pods as a result of scaling activity. Kuberenetes also will delete pods as part of scaling operations, that why you need to be ready that you might lose a pod you debug.
kubectl label pods -n apigee $POD debug=apigee-runtime
Apigee ALfA Labs site has a lab that creates a JavaCallout policy that implements JSON sanization transformation based on OWASP Java library.
https://apigee.github.io/alfa/edge-dev-javacallout
We are going to use this proxy and debug the Apigee Java Callout.
The final state of the lab is available in a github repository
https://github.com/yuriylesyuk/json-sanitizer
?. To be specific, we are going to use ~/apigee-debug-java-callout directory to store required artefacts.
mkdir ~/apigee-debug-java-callout
cd ~/apigee-debug-java-callout
?. Clone the contents of the json-sanitizer repository
git clone https://github.com/yuriylesyuk/json-sanitizer.git
?. Go to the proxy bundle directory
cd json-sanitizer
?. Define ORG and ENV variables as appropriate and deploy the proxy bundle
export ORG=<apigee-hybrid-org>
export ENV=<apigee-hybrid-env>

./deploy-hybrid.sh
The proxy with java callout jar file is now deployed.
As we are going to debug a specific container, we want to send a curl request against it directly. Starting from Hybrid 1.4.0, an apigee-runtime container has a curl command. Therefore we don't need to use any other client, like busyboxplus:curl. For older hybrid versions, that's exactly the option we would recommend.
kubectl exec -it -n apigee $POD -- /bin/bash
?. At the shell, define convenience variables as appropriate for your environment
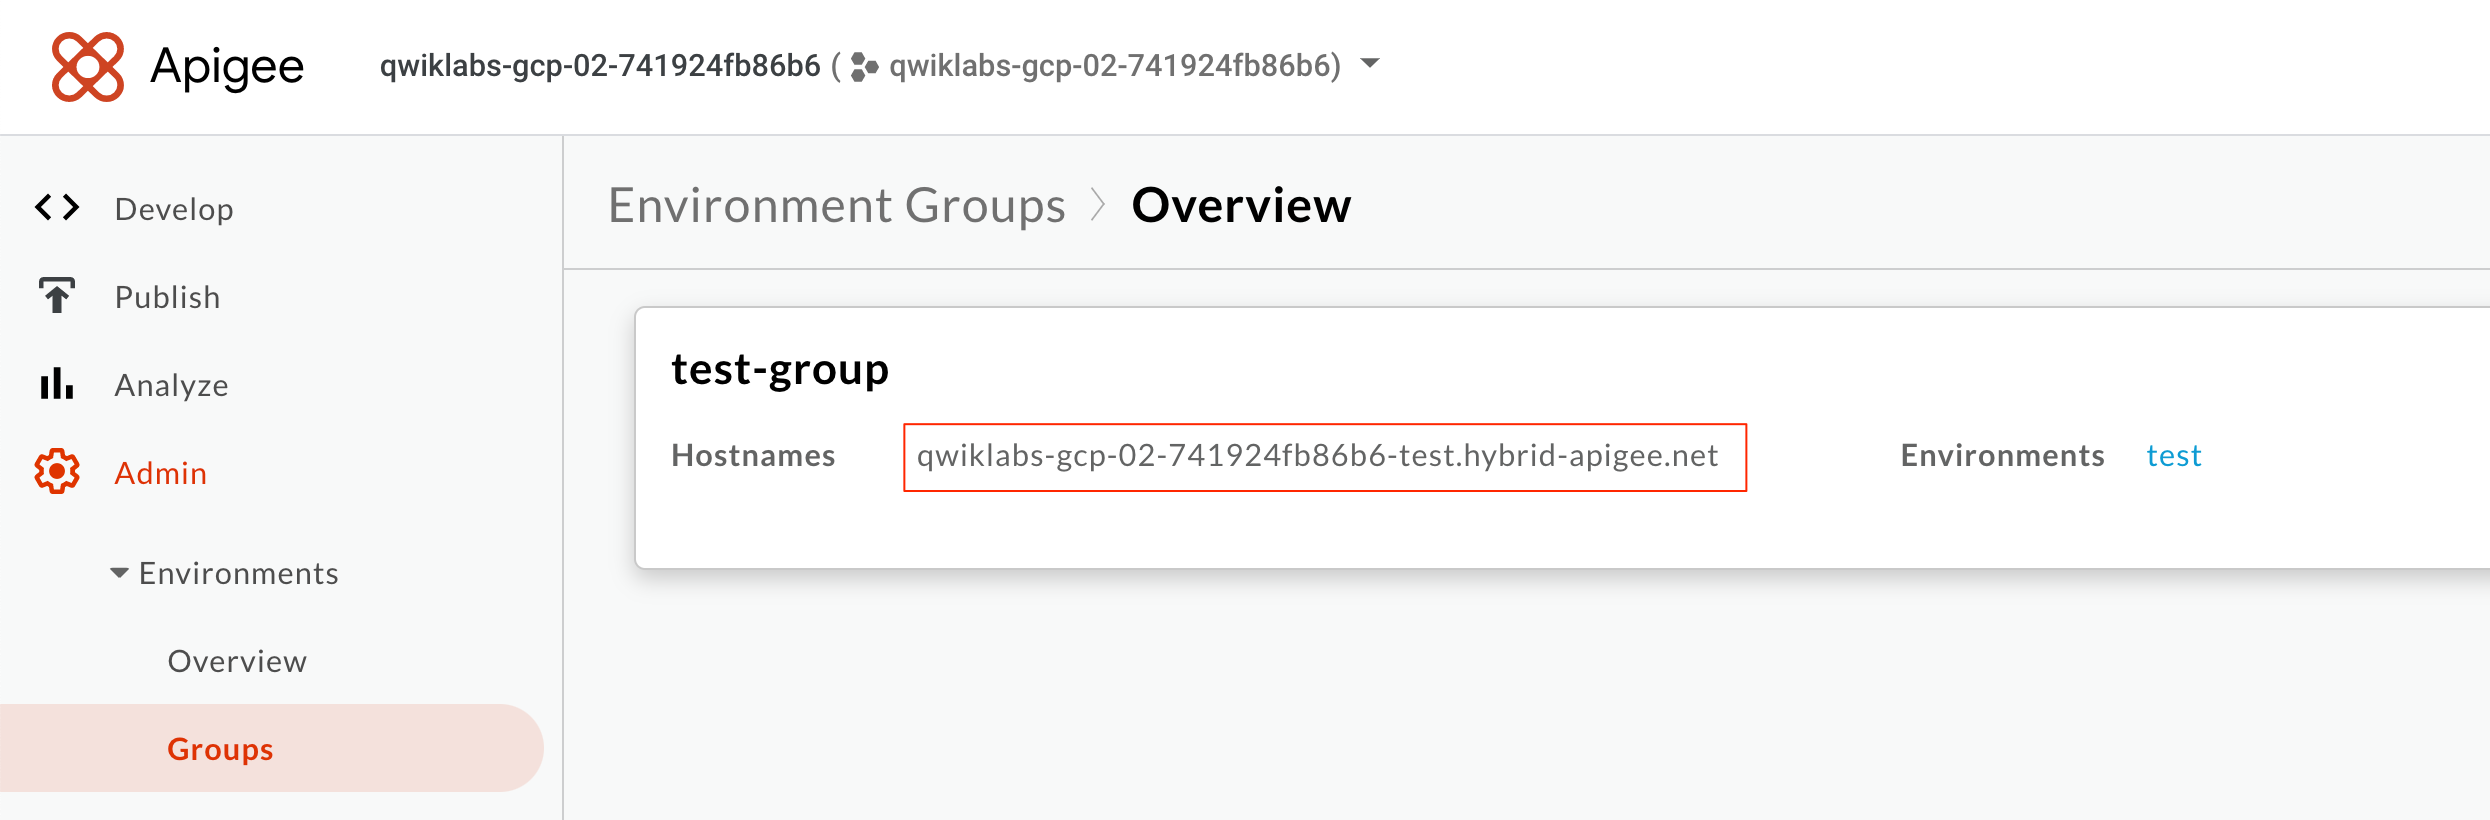
If you have so many environment groups that do not remember their hostnames, look at the Apigee UI under Admin/Environments/Groups. For example:
export RUNTIME_IP=127.0.0.1
export RUNTIME_HOST_ALIAS=<ingress-gateway-hostname>
?. Send a request
We need to tweek the request slightly considering we directly execute it against a runtime container.
As per manifest,
- the service is exposed at 8443 port;
- the IP address is a local host;
- although we can copy a certificate and use --cacert curl option, it is easier just use -k to ignore TLS server check altogether.
curl -k -H "Content-Type: application/json" https://$RUNTIME_HOST_ALIAS:8443/json-sanitizer --resolve "$RUNTIME_HOST_ALIAS:8443:$RUNTIME_IP" --http1.1 --data-binary @- <<EOD
{"xx":"<script>alert(1)</script>", "yy": 'yyy',"ar":[0,,2]}
EOD
Output:
{"xx":"<script>alert(1)<\/script>", "yy": "yyy","ar":[0,null,2]}
?. Of course we can turn the TRACE on and see our request intercepted. Try it. It is a satisfying experience.
?. In a separate browser tab, open Cloud Code Editor
http://ide.cloud.google.com/
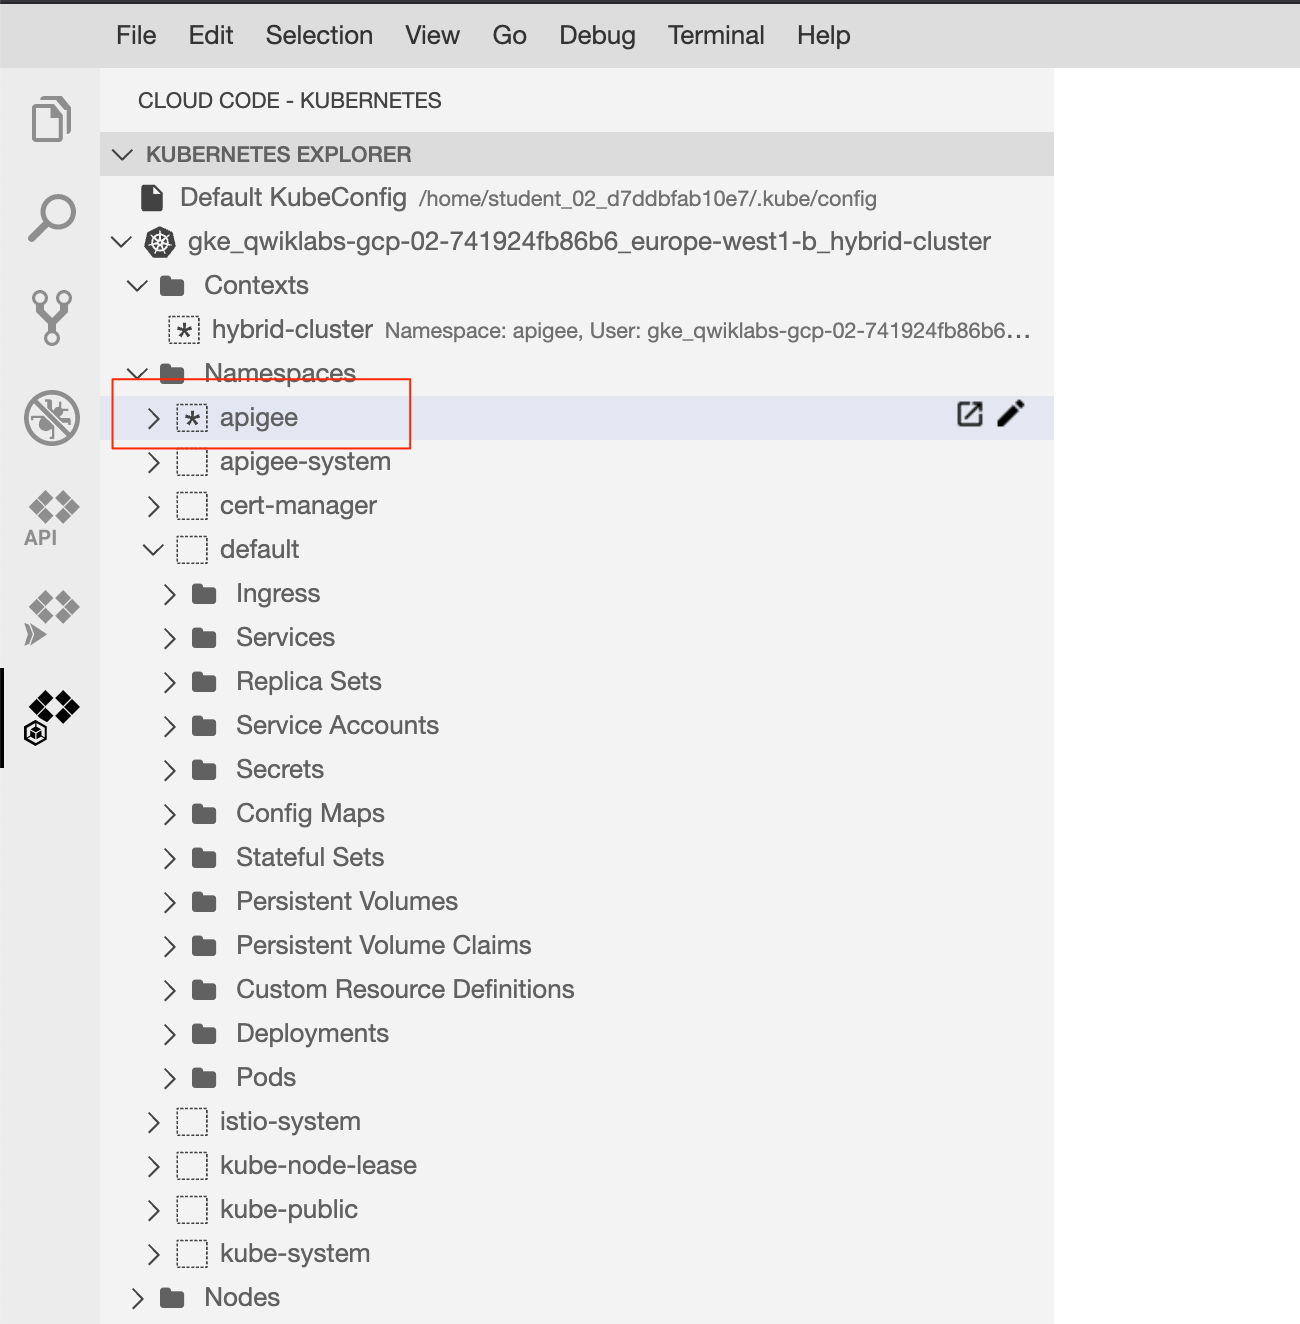
?. Switch to the Cloud Code - Kubernetes tab, In the KUBERNETES EXPLORER pane expand your hybrid cluster, and select apigee namespace as active one, right-click Set as Active Namespace
?. Click on Open Workspace button, select your home directory as a workspace root.
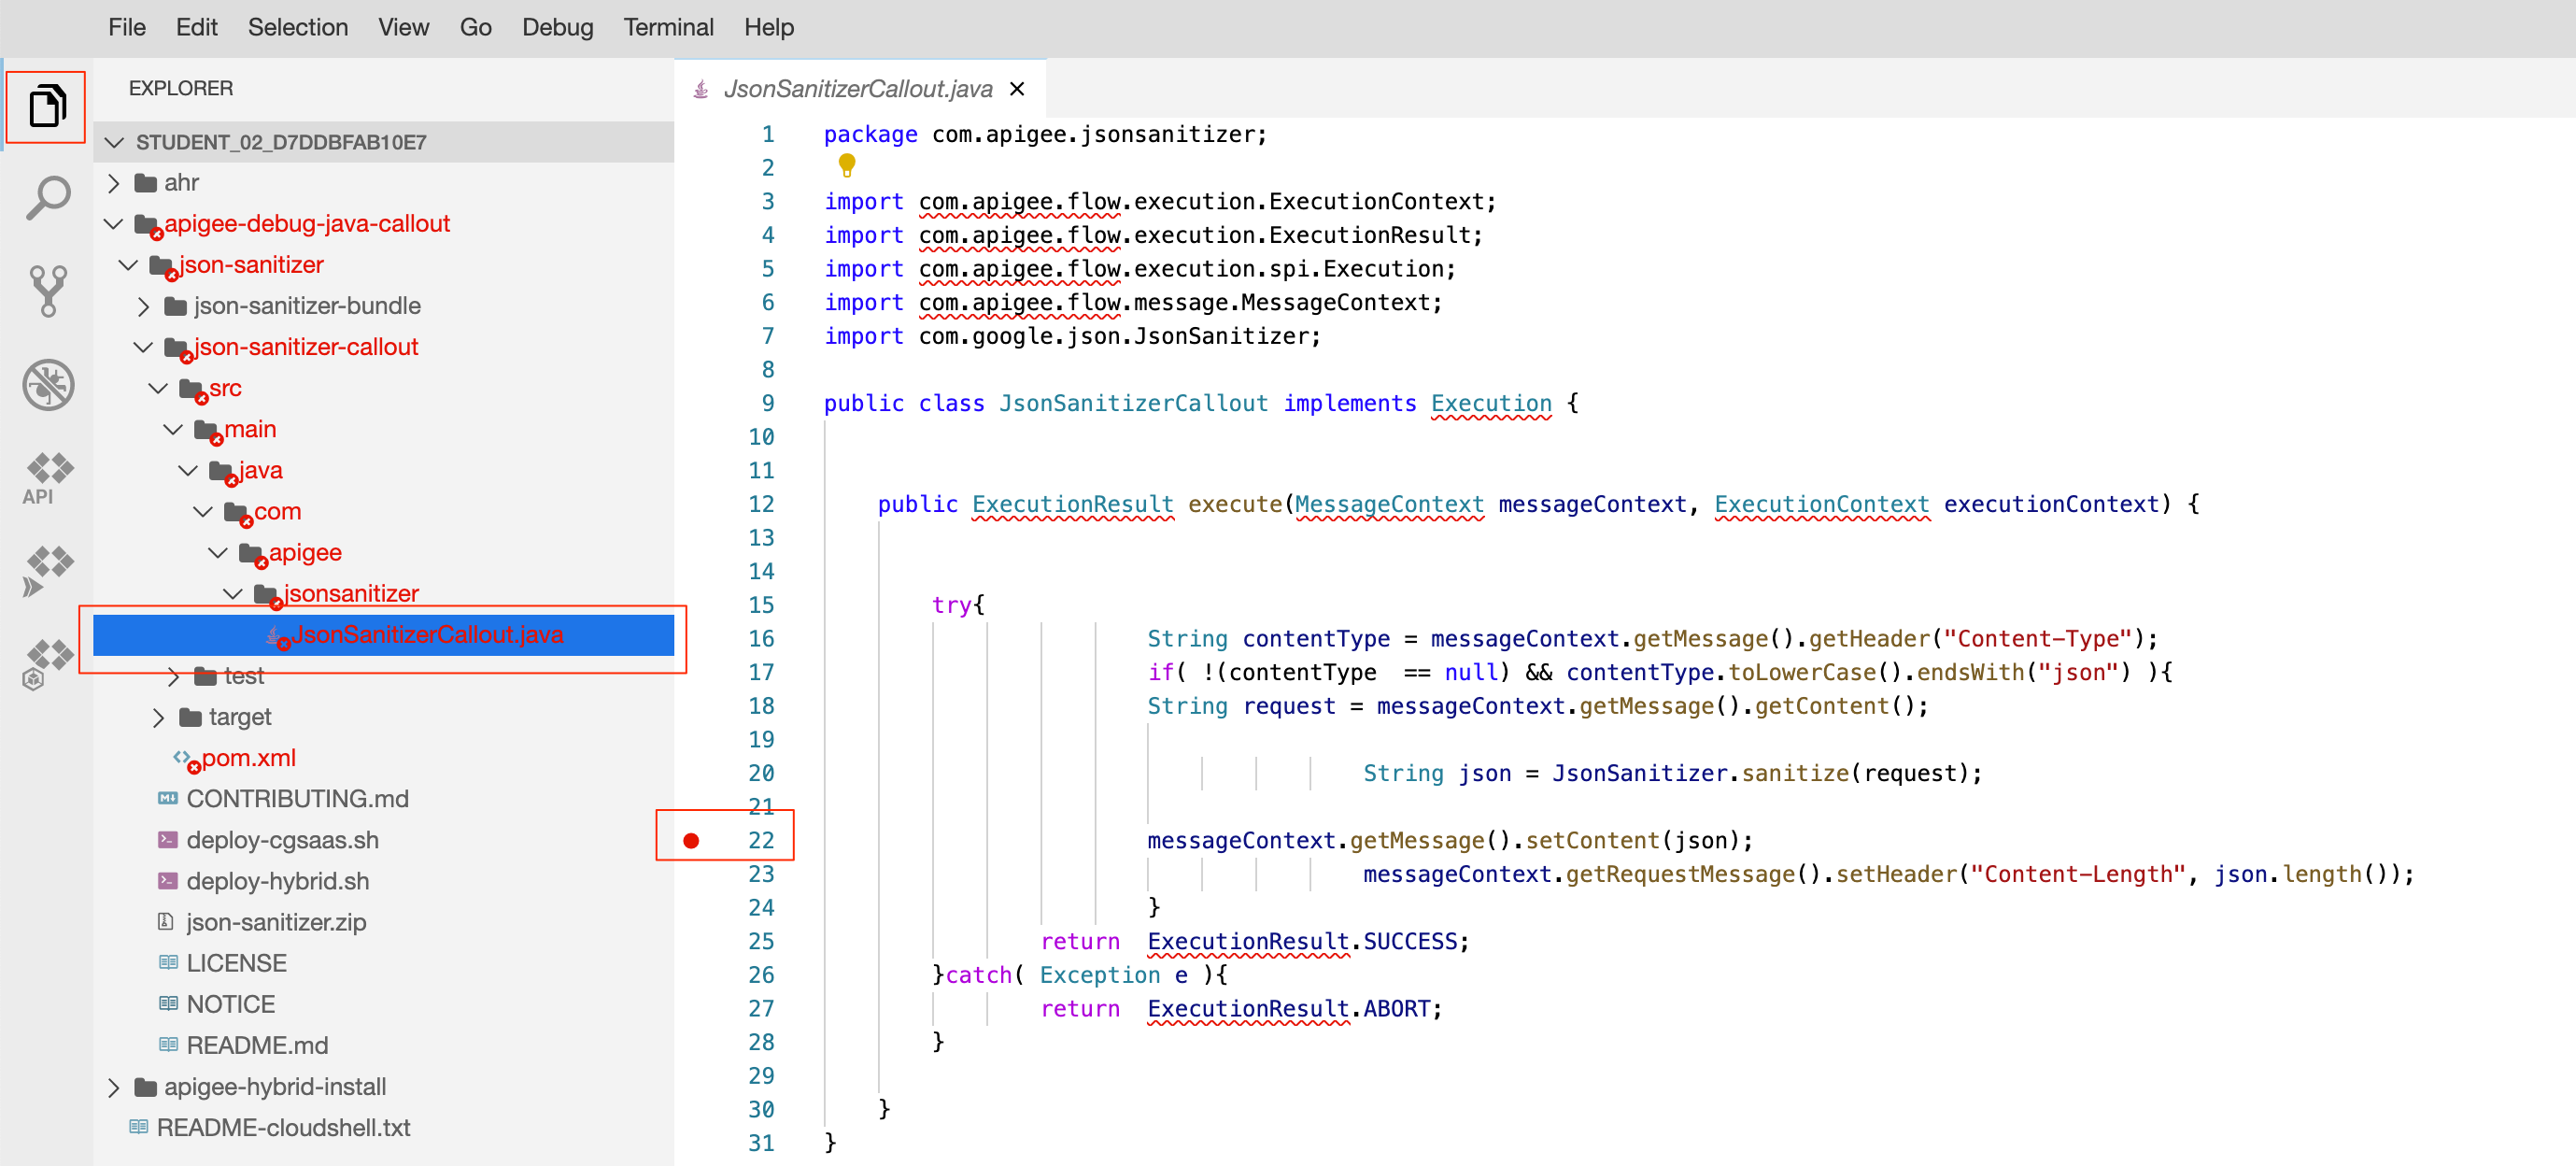
?. Expand file tree explorer until you activate JsonSanitinerCallout.java file
~/apigee-debug-java-callout/json-sanitizer/json-sanitizer-callout/src/main/java/com/apigee/jsonsanitizer directory
?. In the active Explorer pane, put a breakpoint at line 22.
?. Switch to Debug Panel
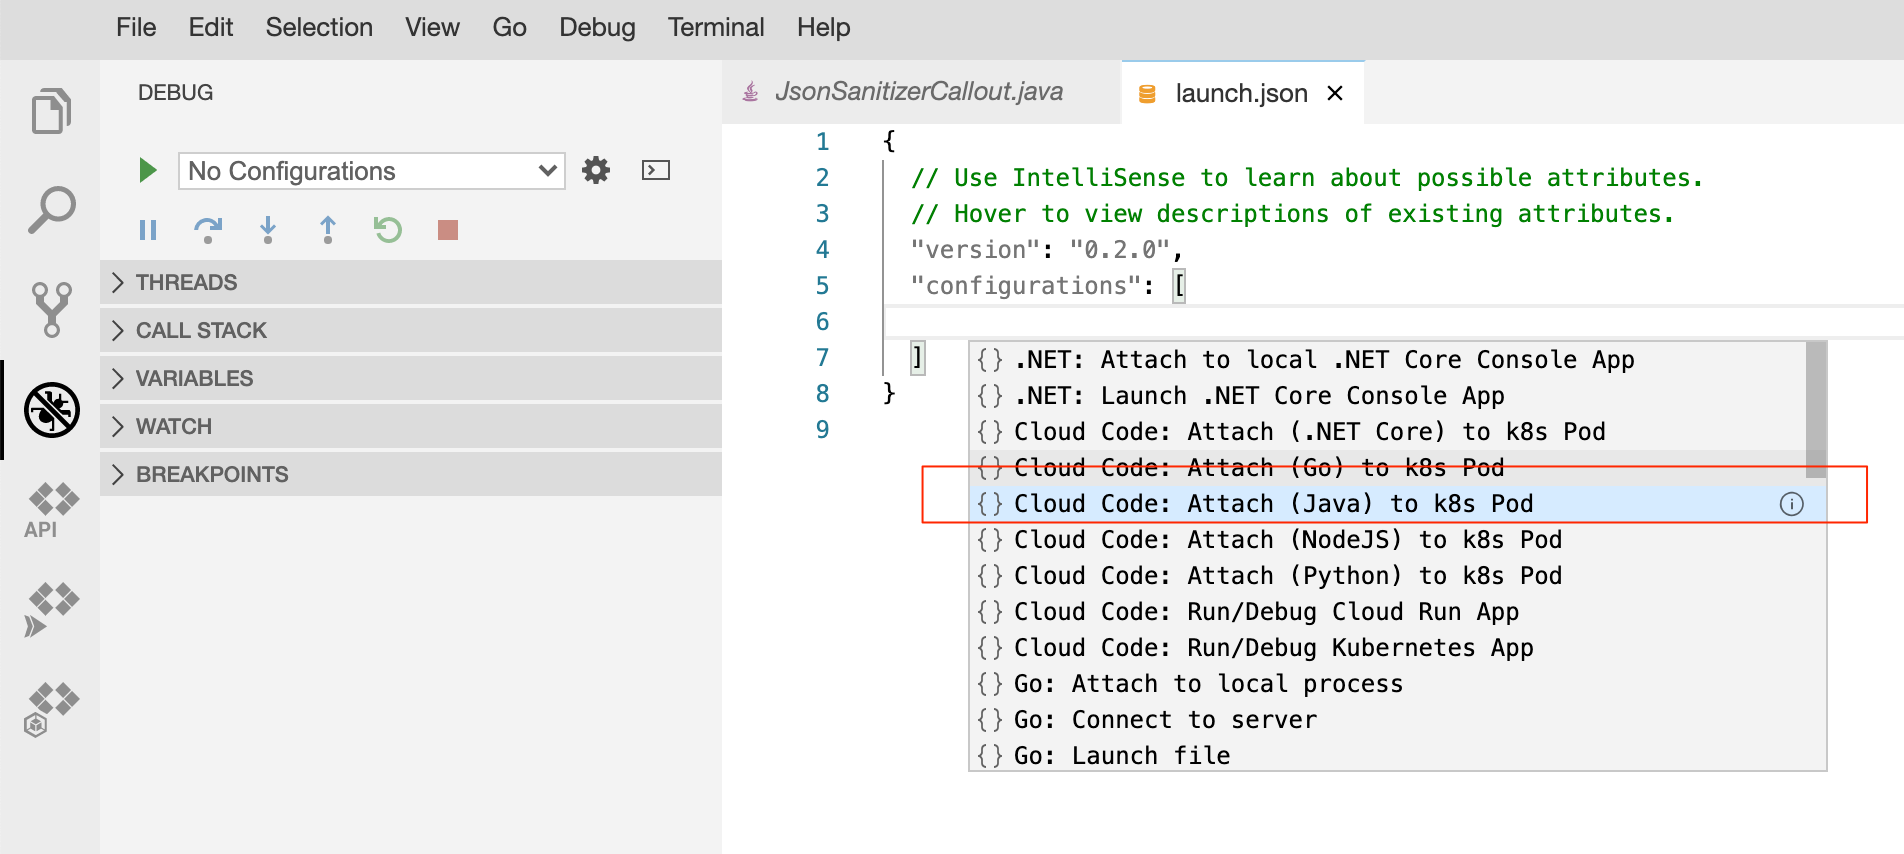
?. Select Add Configuration...

?. Select Cloud Code: Attach (Java) to k8s Pod
?. Edit the launch.json file to finetune a podSelector as follows:
      {
          "name": "Attach to Kubernetes Pod (Java)",
          "type": "cloudcode.kubernetes",
          "request": "attach",
          "language": "Java",
          "debugPort": 50005,
          "podSelector": {
              "debug": "apigee-runtime"
          }
      }
?. Switch to the Debug tab and start the debugging session.

?. Keep an eye on the Output pane. It reflects the fact that Cloud Code now is attached to the running container. You can explor list of threads of the debugged JVM now.

?. Position your ssh and ide windows so that you can them overlapping.
?. In the ssh window, send a curl request to your api proxy.
curl -k -H "Content-Type: application/json" https://$RUNTIME_HOST_ALIAS:8443/json-sanitizer --resolve "$RUNTIME_HOST_ALIAS:8443:$RUNTIME_IP" --http1.1 --data-binary @- <<EOD
{"xx":"<script>alert(1)</script>", "yy": 'yyy',"ar":[0,,2]}
EOD
You are hitting breakpoint now.
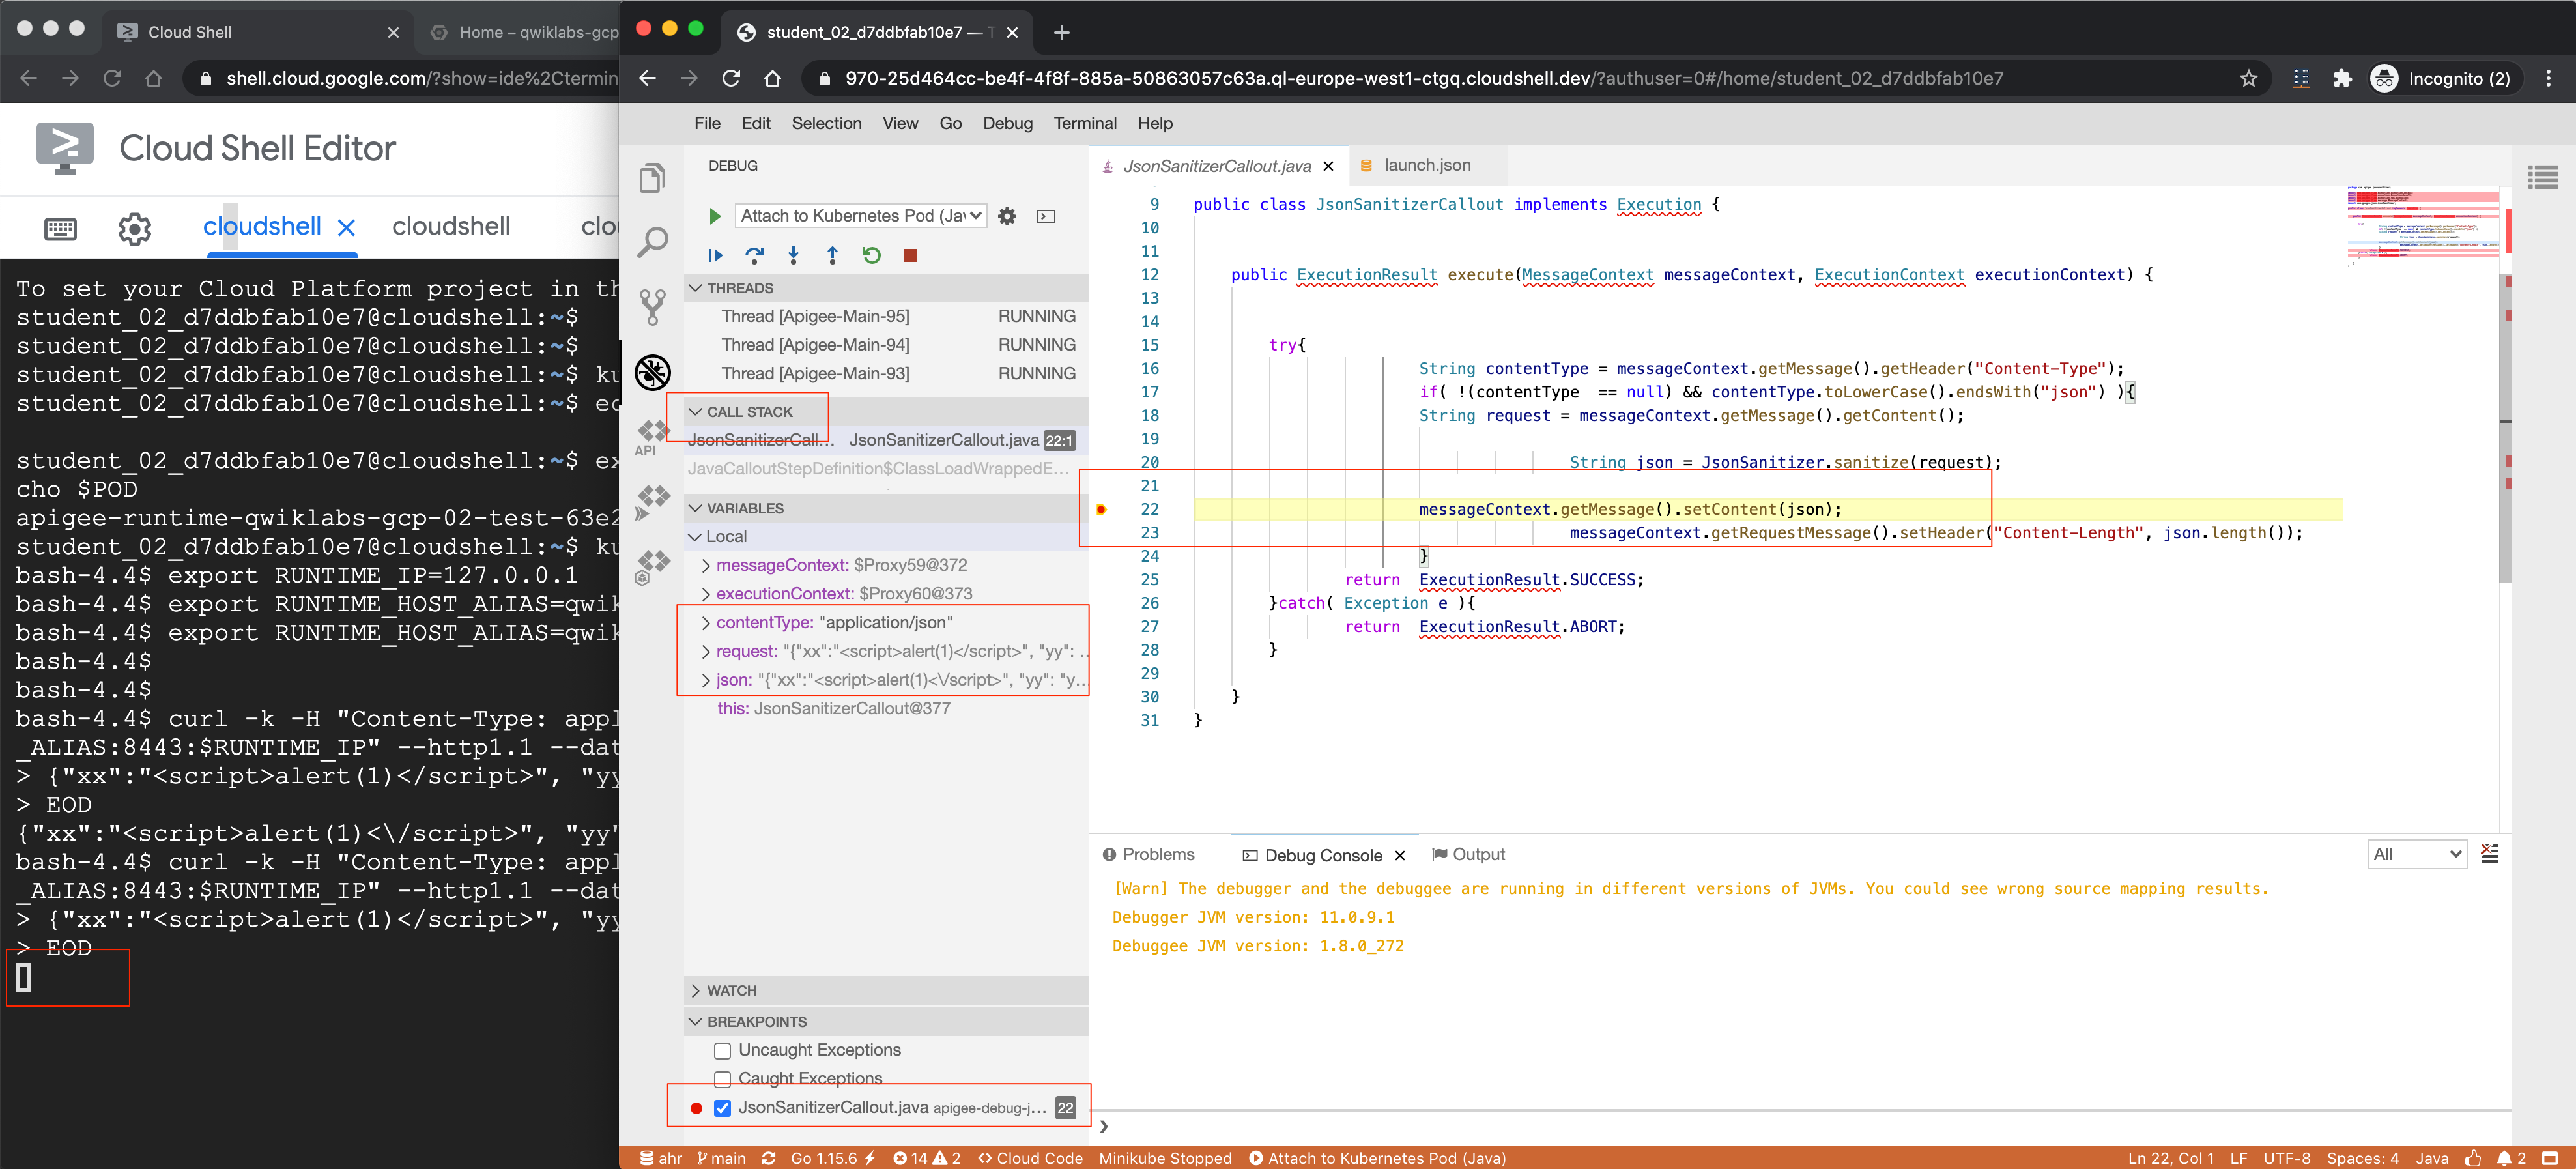
Observe:
- Call Stack;
- Local Values;
- etc...
?. Click on Continue button or press F5 to continue excecution. Or help yourself with F10/Step Over or other debugger commands.
- TADA: Apigee Hybrid Container Traffic Analysis with tcpdump for Target Requests
- TADAA: Cloud Code IDE Java Callout Debugging
- Hybrid Ingress Walkthrough 1.5
- Hybrid CRD Objects Diagram 1.3.2
- List of Components for Air-gapped Deployments
- GKE/EKS Multi-cloud Small Topology 1.4 [single-project] | AHR Profile Quick Start
- Single-Zone Cluster, Small footprint 1.1
- Multi-Zone Cluster, Large footprint 1.1
- Multi-Region Cluster, Large footprint 1.1
-
 Private Cluster
-
 Performance Testing: distGatling
- Delete Hybrid Installation
- Hybrid Ingress Walkthrough 1.3