treeclimbR is an algorithm to pinpoint the optimal data-dependent resolution for interpreting hierarchical hypotheses.
The algorithm is described in more detail in the following paper:
Huang R, Soneson C, Germain PL, Schmidt TSB, Mering CV, Robinson MD: treeclimbR pinpoints the data-dependent resolution of hierarchical hypotheses. Genome Biology 22(1):157 (2021).
treeclimbR can be installed from Bioconductor (release 3.19 onwards) via
if (!require("BiocManager", quietly = TRUE))
    install.packages("BiocManager")

BiocManager::install("treeclimbR")A detailed vignette outlining the main functionality is available here.
Basic example (more details here)
In this example application, we first generate a random tree with 100 leaves, with each leaf representing an entity (e.g., a microbial species). Then we sample counts (abundances) of these entities in each sample from a multinomial distribution. In total, there are 40 samples (20 assigned to group A and the other 20 to group B). 18 entities are randomly selected to display differential abundance between the groups (and will have their counts multiplied by 2 in group A).
Before running treeclimbR, we expand the leaf-level count matrix to also encompass internal nodes, by summing the counts for all the corresponding leaves.
Next, we perform a Wilcoxon rank sum test on each node in the tree to obtain P-values and directions of change.
Details of the analysis are available here.
The question is now whether it is beneficial to interpret parts of the tree on a level higher up in the tree than the leaves - this would be the case if there are subtrees where all nodes and leaves change consistently in the same direction.
In this situation, we can summarize the signal on the root level of that subtree, which will reduce the length of the result list and improve the interpretability.
The optimal aggregation level can vary across the tree, and will be inferred from the data.
Thus, treeclimbR will propose a range of aggregation 'candidates', corresponding to different values of a threshold parameter t.
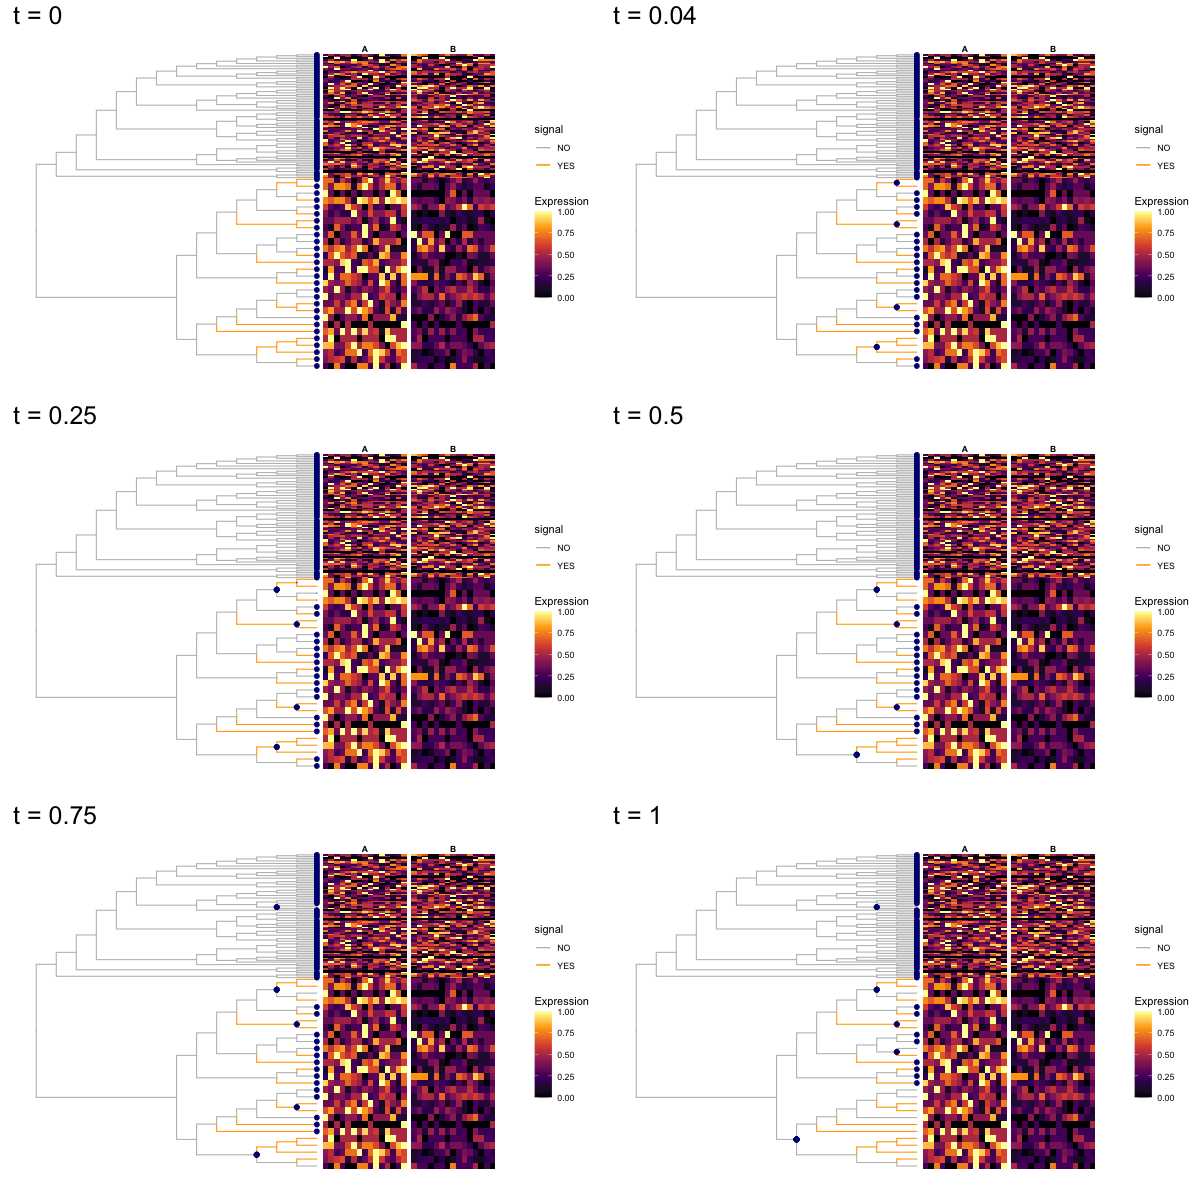
These candidates are shown in the animation below.
Note that as t increases, the aggregation happens further up the tree.
Orange branches correspond to branches with a true differential signal, and blue circles indicate the aggregated nodes for a given threshold value.
The heatmap shows the abundances of entities (rows) across the samples (columns) split by group.
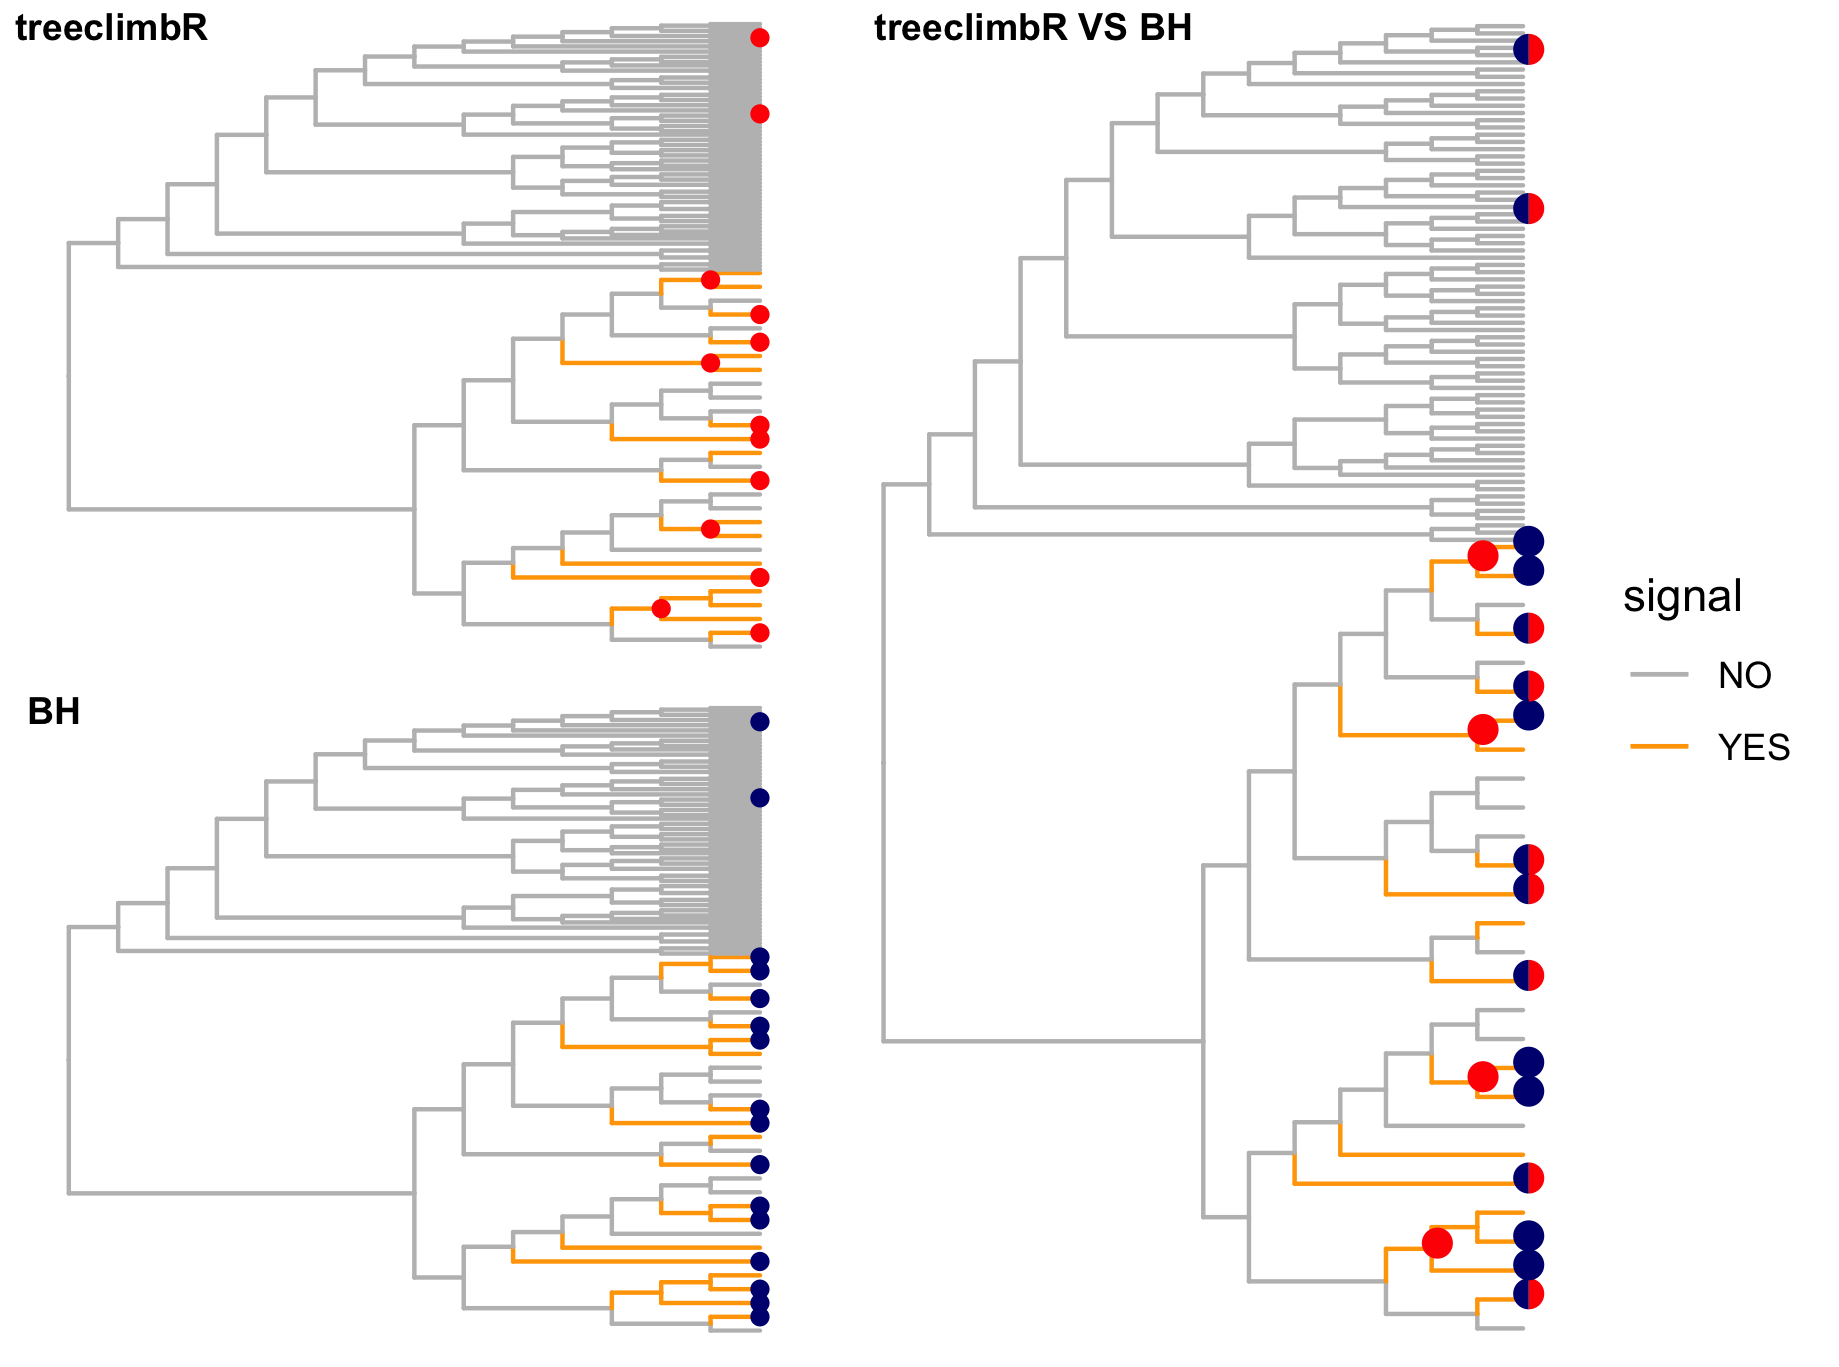
The trees below compare the nodes that are identified as significantly differentially abundant with treeclimbR for the optimal value of t (in red) to the leaves that are found to be significant (at an adjusted p-value threshold of 0.05) after applying a multiple hypothesis testing correction using the Benjamini-Hochberg method to the leaf-level results only (in blue).
Other simulation scenarios (more details here)
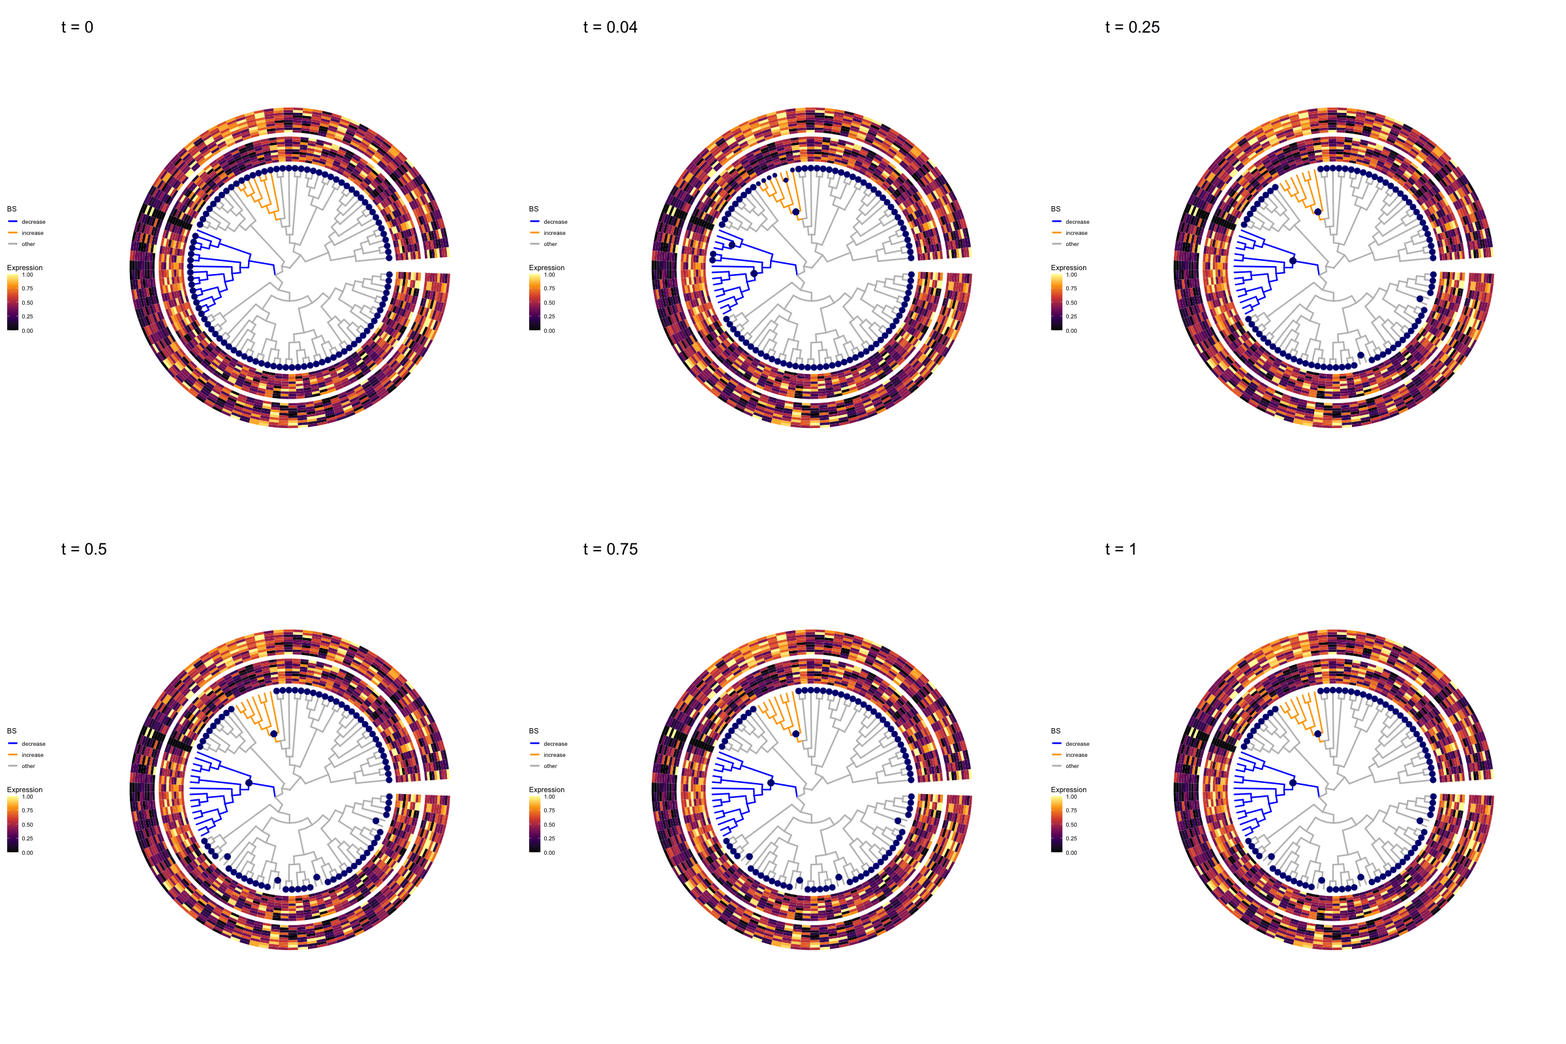
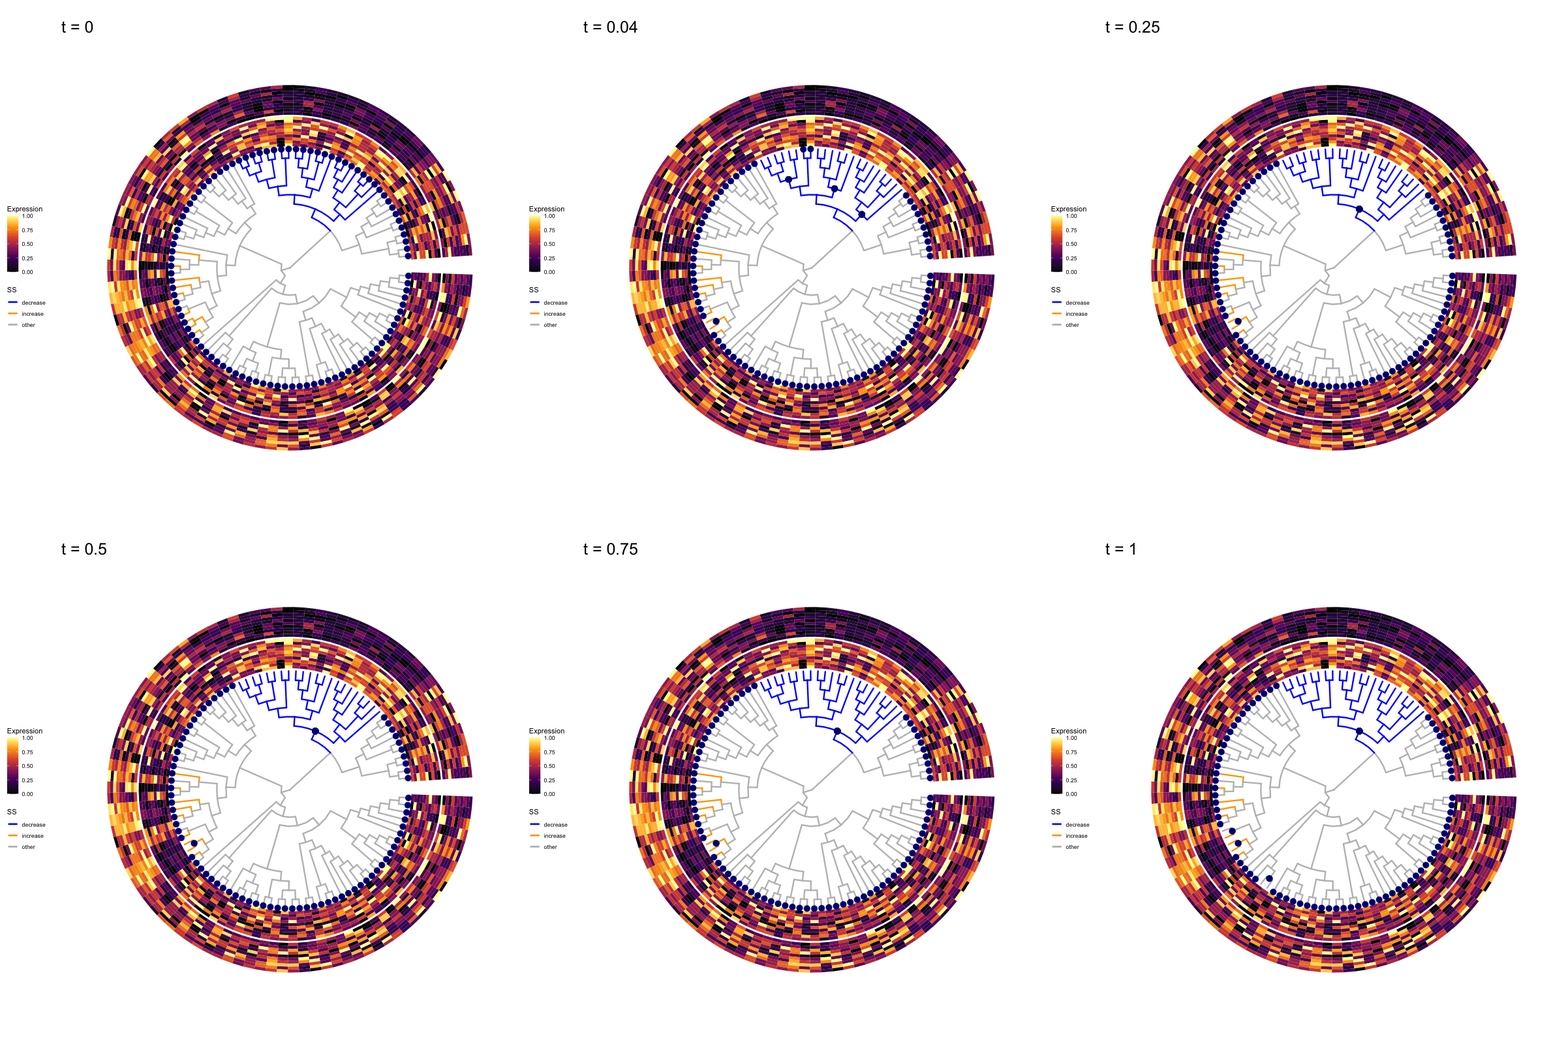
The animations below show the identified candidates under other simulation settings. Orange branches represent 'positive' signal (higher abundance in group B compared to group A), and blue branches represent 'negative' signal (lower abundance in group B compared to group A).
Additional examples of applying treeclimbR to different types of data can be found here.


