This is a layout function for creating paths in D3 where (unlike the native d3.svg.line() element) you need to apply specific aesthetics to each element of the line.
The original use case was trails with decaying opacity to represent movement: here's a sample image: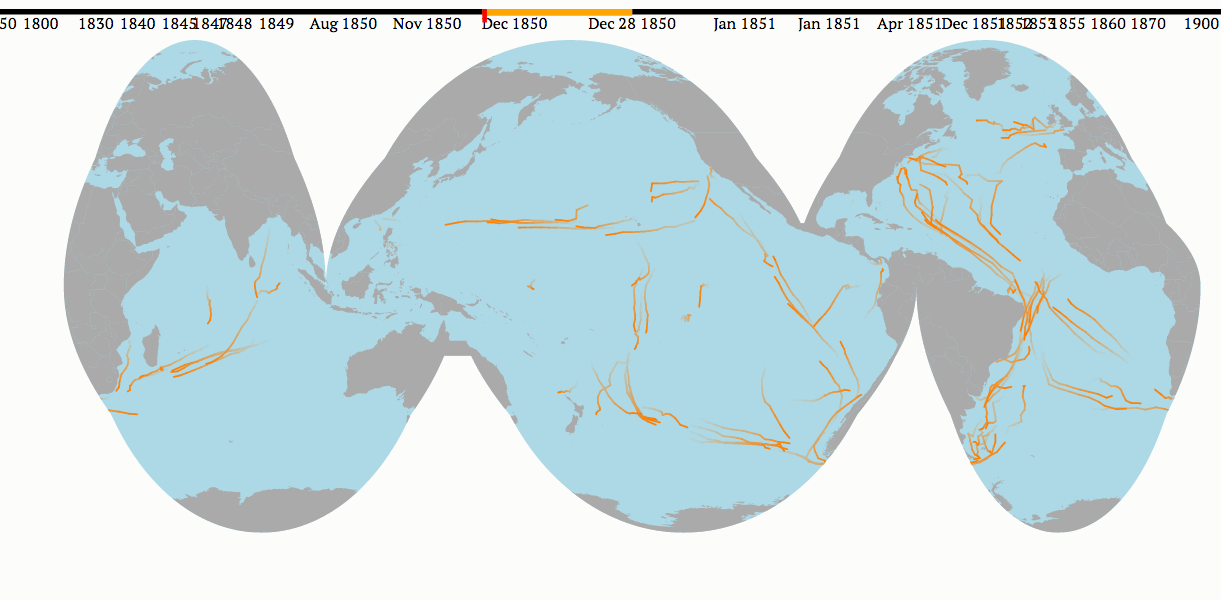
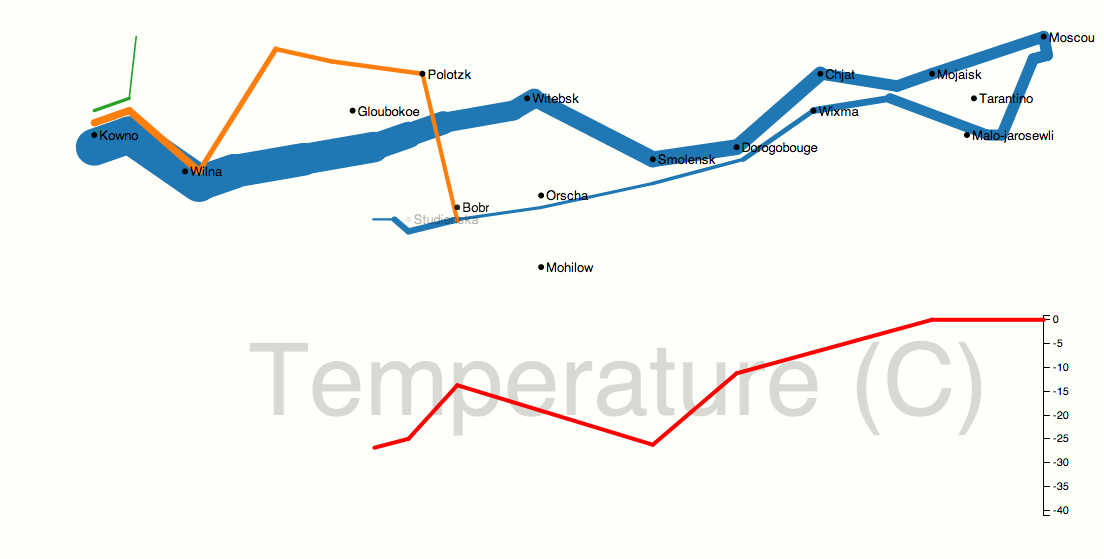
For a classical example, see how variable-width, staggered entry lines make it possible to reproduce Minard's famous Napoleon map in motion. Here's a screenshot, although the whole point is the animation.
For a more straightforward demo of staggered entry (see this demo of a random walk).
Features include:
- Controls to define multiple groups of simultaneous lines by setting
grouping. - Options to return data either with
x1,x2,y1, andy2elements to use with svg lines or with acoordinatesobject to use with geoprojections by settingcoordType. - Inbuilt methods to easily define
opacityin the data as an evaporating trail in time like the frames in my maps of shipping routes. - Control over sorting.
- Access to both points in the bound data, so that appearance of a segment can be defined by data about the destination point, the origin, or some interaction of them.
You instantiate it by calling the function: once parameters are set, run the layout() method to get values back.
A bare bones example might be:
trail = d3.layout.trail().coordType('xy')

new = trail.data(whatever).layout()

paths = svg.selectAll("line").data(new)

paths.enter()
.append('line')
.attr("x1",function(d) {return d.x1})
.attr("y1",function(d) {return d.y1})
.attr("y2",function(d) {return d.y2})
.attr("x2",function(d) {return d.x2})
Create a trail object
trail = d3.layout.trail()
Set (or with no arguments, return) the data to be plotted. Each object in the return values will correspond to two consecutive points in this array.
Set (or with no arguments, return) a function used to specify the x and y values for each point.
By default, it returns simply [x,y] for the data:
positioner = function(datum) { return [datum.x,datum.y] }
You can also drop in any map projection as the positioner.
Set (or with no arguments, return) the format of positions for the return values. Can be either
"xy", in which case you'll getx1,x2,y1, andy2elements suitable for use with svg lines, or"coordinates", in which case the objection will get acoordinateselement consisting of an array of points so you can simply create a d3.geo.path() element. (Useful if you want to preserve great circle arcs for your paths, for instance; in this case the positioner should return lat and lon, not the projected values, so you don't project them twice.)
Set (or with no arguments, return) the grouping
Set (or with no arguments, return) the function used to order the points.
If not set, points will be ordered in the direction they went in.
And then set the parameters
Set (or with no arguments, return) a function that returns how to access the time data. (Must be numeric: dates not yet supported).
Set (or with no arguments, return) the current time (ie, that for which opacity should be 1); all times after this will be dropped from the returned set.
Set (or with no arguments, return) the number of time units to be displayed: The opacity of segments ending at trail.currentTime() - trail.decayRange() will be zero, and all earlier segments will not be displayed