Skip to content
New issue

Have a question about this project? Sign up for a free GitHub account to open an issue and contact its maintainers and the community.

By clicking “Sign up for GitHub”, you agree to our terms of service and privacy statement. We’ll occasionally send you account related emails.

Already on GitHub? Sign in to your account

Add example app: pivot chart maker #5894

Merged
merged 15 commits into from
Mar 14, 2017
Merged

Add example app: pivot chart maker #5894

merged 15 commits into from
Mar 14, 2017

Conversation

mmowers
Copy link
Contributor

@mmowers mmowers commented Feb 20, 2017

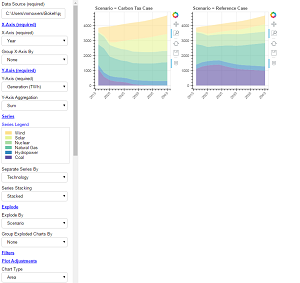
This bokeh app creates pivot charts from data, similar to Excel's pivot chart functionality, but with the additional ability to explode into multiple pivot charts.

@bryevdv
Copy link
Member

bryevdv commented Feb 20, 2017

Hi @mmowers thanks for the PR! Regarding the CI test failures there are just a few edits needed to satisfy the linter:

>       assert len(errors) == 0, "Code quality issues:\n%s" % "\n".join(errors)
E       AssertionError: Code quality issues:
E         File contains trailing whitespace: examples/app/pivot/README.md, line 41.
E         File contains trailing whitespace: examples/app/pivot/README.md, line 55.
E         File does not end with a newline: examples/app/pivot/README.md, line 82
E         File does not end with a newline: examples/app/pivot/downloads/.gitignore, line 4
E         File does not end with a newline: examples/app/pivot/main.py, line 377
E         File does not end with a newline: examples/app/pivot/templates/index.html, line 19
E         File does not end with a newline: examples/app/pivot/templates/scripts.js, line 62
E         File does not end with a newline: examples/app/pivot/templates/styles.css, line 79
E         File starts with more than 1 empty line: examples/app/pivot/theme.yaml, line 1
E       assert 9 == 0
E        +  where 9 = len(['File contains trailing whitespace: examples/app/pivot/README.md, line 41.', 'File contains trailing whitespace: exam...pp/pivot/main.py, line 377', 'File does not end with a newline: examples/app/pivot/templates/index.html, line 19', ...])

@@ -0,0 +1 @@

Copy link
Member

Choose a reason for hiding this comment

The reason will be displayed to describe this comment to others. Learn more.

If there aren't any customizations made in this file, it can just be omitted entirely.

Copy link
Contributor Author

Choose a reason for hiding this comment

The reason will be displayed to describe this comment to others. Learn more.

Thanks, done.

# Ignore everything in this directory
*
# Except this file
!.gitignore
Copy link
Member

Choose a reason for hiding this comment

The reason will be displayed to describe this comment to others. Learn more.

This seems unnecessary

Copy link
Contributor Author

Choose a reason for hiding this comment

The reason will be displayed to describe this comment to others. Learn more.

I have this gitignore file because users are able to download csv files to this folder.

wdg['y_major_label_size'].on_change('value', update_sel)
wdg['circle_size'].on_change('value', update_sel)
wdg['bar_width'].on_change('value', update_sel)
wdg['line_width'].on_change('value', update_sel)
Copy link
Member

Choose a reason for hiding this comment

The reason will be displayed to describe this comment to others. Learn more.

since these are all getting the same callback, it might be a little more economical in terms of code to use a loop, somethign like:

for name in widget_names:
    wdg[name].on_change('value', update_sel)

Copy link
Contributor Author

Choose a reason for hiding this comment

The reason will be displayed to describe this comment to others. Learn more.

Thanks, done.

Modeled,ID,gas,2024,2753007.082
Modeled,ID,gas,2026,2782479.991
Modeled,ID,gas,2028,2917963.431
Modeled,ID,gas,2030,
Copy link
Member

Choose a reason for hiding this comment

The reason will be displayed to describe this comment to others. Learn more.

This may be a bit large to check into the repo directly. We should consider putting it in bokeh.sampledata and using it from there (and using the mtcars data from there as well)

Copy link
Contributor Author

Choose a reason for hiding this comment

The reason will be displayed to describe this comment to others. Learn more.

I've reduced the size of this csv to 6 KB, and removed cars.csv. Let me know if that is sufficient.

PLOT_HEIGHT = 300
PLOT_FONT_SIZE = 10
PLOT_AXIS_LABEL_SIZE = 8
PLOT_LABEL_ORIENTATION = 45
Copy link
Member

Choose a reason for hiding this comment

The reason will be displayed to describe this comment to others. Learn more.

These could go in theme.yaml I think

Copy link
Contributor Author

Choose a reason for hiding this comment

The reason will be displayed to describe this comment to others. Learn more.

These variables are just used as defaults for the widgets. But the styling itself is coming from the widget values, not directly from these variables. Let me know if you have another idea of how to do this. In the meantime, I've removed theme.yaml.

@bryevdv
Copy link
Member

bryevdv commented Feb 20, 2017

I've left some initial review comments. I think there are some other things we can do like add a screenshot and link to the top level README

@mmowers
Copy link
Contributor Author

mmowers commented Feb 23, 2017

Thanks @bryevdv! I've added a commit to address your comments.

@bryevdv
Copy link
Member

bryevdv commented Feb 23, 2017

@mmowers getting closer! First, there was an upstream dependency change that caused our unit tests to all start failing. You will need merge/rebase on master to get those green again.

After your lastest commit, there are still some (new) linter issues to fix:

__________________________________ test_files __________________________________
    @pytest.mark.quality
    def test_files():
        errors = collect_errors()
>       assert len(errors) == 0, "Code quality issues:\n%s" % "\n".join(errors)
E       AssertionError: Code quality issues:
E         File starts with more than 1 empty line: examples/app/pivot/theme.yaml, line 1
E       assert 1 == 0
E        +  where 1 = len(['File starts with more than 1 empty line: examples/app/pivot/theme.yaml, line 1'])
tests/test_code_quality.py:90: AssertionError
_________________________________ test_flake8 __________________________________
    @pytest.mark.quality
    def test_flake8():
        chdir(TOP_PATH)
    
        proc = Popen(["flake8"], stdout=PIPE, stderr=PIPE)
        out, err = proc.communicate()
    
>       assert proc.returncode == 0, "Flake8 issues:\n%s" % out.decode("utf-8")
E       AssertionError: Flake8 issues:
E         ./examples/app/pivot/main.py:57:166: E501 line too long (166 > 165 characters)
E         ./examples/app/pivot/main.py:60:166: E501 line too long (178 > 165 characters)
E         ./examples/app/pivot/main.py:80:166: E501 line too long (178 > 165 characters)
E         ./examples/app/pivot/main.py:321:166: E501 line too long (168 > 165 characters)
E         
E       assert 1 == 0
E        +  where 1 = <subprocess.Popen object at 0x7f95b4b9a9b0>.returncode
tests/test_flake8.py:16: AssertionError

I do think we need to figure out what to do about the large CSV. One option would be to have a download script or function that will fetch the CSV files the first time the app is run (or make a warning that instructs how to download them)

Also I think my comment about the README was too vague, apologies. I think the app dir should still have a standalone readme (i.e. not linking to an external one). I was suggesting that your new app be added and linked from the README one level up in examples/app: https://github.com/bokeh/bokeh/tree/master/examples/app

@mmowers
Copy link
Contributor Author

mmowers commented Feb 24, 2017

Thanks @bryevdv! I'll try to get these changes done tomorrow. One clarification before I do: I updated the csv file and now it is 6 KB. I'm not sure you saw that because the comment is collapsed as it is associated with an outdated file. I'm more than willing to add a function to automatically fetch the csv when the app is initially loaded, but wanted to make sure you were aware of its updated size before I make the change. Thanks again!

@mmowers
Copy link
Contributor Author

mmowers commented Feb 26, 2017

Hi @bryevdv , I've pushed some updates. The csv file is now down to 2K, so hopefully that's small enough (let me know if it isn't). For the examples/app readme, the png needs to be uploaded to http://bokeh.pydata.org/static/. I have the PNG here: https://github.com/mmowers/superpivot/blob/master/pivot.PNG. Thanks again!

@bryevdv
Copy link
Member

bryevdv commented Feb 27, 2017

@mmowers It think 2k is probably an OK size. I will upload the image to the pydata site this week. It looks like the test failure was spurious, so I've restarted it. Apart from that I just want to have a change to check out the branch and run the example directly, which I should be able to get to in the next few days.

@mmowers
Copy link
Contributor Author

mmowers commented Feb 28, 2017

@bryevdv ,
Thanks, great to hear! Let me know if you have any questions.

@bryevdv
Copy link
Member

bryevdv commented Mar 2, 2017

Hi @mmowers I am overwhelmed with some other tasks right now. If you can resize the image to be the same width as the existing thumbnails in the apps README that would be a huge help actually.

@mmowers
Copy link
Contributor Author

mmowers commented Mar 3, 2017

Hi @bryevdv ,
I've updated the width to 300px.
Let me know anything else I can do to help.
Thanks!

@bryevdv
Copy link
Member

bryevdv commented Mar 3, 2017

Hi @mmowers I have uploaded the thumbnail to this location:

http://bokeh.pydata.org/static/pivot_t.png

I added the _t to the filename to be consistent with the other thumbnails that are already there.

I also checked out the branch and ran it locally. It's very cool! In general my main observation is that it does not actively prevent unusable combinations of parameters, and when a user makes a selection that is not reasonable, then the only indication is an exception printed in the console.

Here are some observations/suggestions, in no particular order:

  • Be opinionated at the start. Pick the first and second columns to be x and y axes and start by showing that chart. I think seeing a chart right away will help people understand what's in front of them more quickly.

  • Since x-axis and y-axis are required, don't make them collapsible. Seeing some controls available right away will also help orient new users.

  • Label or somehow indicated whether the columns in the dropdown are categorical or numeric

  • A header with the app name and a brief description and brief instructions about what to do / what can be done.

  • Actively manage the dropdown list options. It's possible to update the available options so that "unreasonable" options don't show up. E.g. if a column is selected in for the x-axis, it should be removed from the dropdown for y-axis. Check out the one-line nix fuction from this example:

    https://github.com/bokeh/bokeh/blob/master/examples/app/stocks/main.py

    Even just doing this for x- and y- to start would go a very long way, but I can imagine also updating things so that e.g. if a column is selected to be exploded, it's not also in the stacked dropdown.

  • Maybe a default data set with more columns? I know I was harping about data file size. I think we could go up to 10-15k if necessary. But that space is better spent in additional dimensions rather than additional data points. Another reason it seemed quick to run in to "unreasonable" situations was that there were not many columns to choose from.

  • The splitting colors seem too close. It was hard for me to tell there were different shades of blue when I grouped or separated by series. I'd suggest defaulting to a palette that has lots of different and distinguishable hues (maybe Spectral?) Ultimately it might be nice to make the palette configurable.

  • Linked panning/selection brushing across exploded plots

  • Improving plot type heuristics. This might be harder. There are some combinations that don't currently work well. E.g. Area plot type with grouped axis. These could be disallowed, or handled more careful. Later Bokeh core work on nested coordinate systems (for groupings) will probably help this.

I'm definitely not saying all these things need to happen before this example is merged, but I wanted to at least get a record of them. However, we are shooting for the 20th for a release, so if you have any more time to work on this in the next ~2 weeks, I think getting a few of these changes in would add alot of polish. Understand completely if you do not have bandwidth over that time frame. Let me know what you think!

@bryevdv bryevdv dismissed their stale review March 3, 2017 15:37

out of date

@mmowers
Copy link
Contributor Author

mmowers commented Mar 5, 2017

Thanks much @bryevdv for the suggestions! I think I can knock a few of these out before the 20th.

  1. I'm starting with active management of the dropdown list options. In addition to preventing the same column selections across x, x_group, y, series, explode, and explode_group, I'll also remove the series stacking widget and assume stacking by default for area and bar charts, but not for dot and line charts. I think will remove a fair amount of confusion for the user. Sound good?
  2. I'll also add a header and look into changing the color palette. It would be great if I could make palette dynamic to the number of series via some equation, but still not be ugly... Any recommendations on that?
  3. I'd like to allow x-axis and y-axis to be collapsible to save space, but I can initially open them up. How does that sound?
  4. I'm hesitant to pick axes for the user if they're loading their own data, but for the default data I can load an initial widget configuration. So when someone initially fires up the app, charts would be shown. How does that sound?
  5. On the data set and having more columns, I'm definitely open to using a different dataset. Do you have one that you think would work well? I really wanted to find exit polling data for the 2016 presidential election, similar to https://www.nytimes.com/interactive/2016/11/08/us/politics/election-exit-polls.html, where columns would be any number of demographic factors (age range, race, gender, income range, education, state, etc.), and two columns for the result (candidate supported, number of votes). Something like that would be really awesome to visualize, I think. Problem is, you have to pay for this data I think (from Edison Research) and we probably couldn't publish it.

Also wondering, do you or any other Bokeh maintainers have any performance improvement suggestions? I'm wondering if you can see offhand anywhere that the code is significantly under-performing its potential.

Thanks again!

@bryevdv
Copy link
Member

bryevdv commented Mar 5, 2017

  1. That plan sounds great I think that will go a long way!

  2. Bokeh ships with a number of "categorical" palettes, up to 20 colors. I'd say it would be fine to just pick one on the assumption that there won't be more than the palette size number of stackings, etc.

  3. Sounds good as well

  4. I think picking initial axes only for the default data set is also fine.

  5. I don't know a great dataset offhand. There's "autompg" / "mtcars" which is probably familiar but maybe not so interesting. Another idea might some of the Gapminder data sets (or some subset). If there's an especially interesting data set that costs, it might be possible to procure funds to purchase it (up to a point of course) but it would need to be licensed to distribute for that to make sense (so, maybe not likely)

@mmowers
Copy link
Contributor Author

mmowers commented Mar 11, 2017

Hi @bryevdv , I've made the changes we agreed on. Regarding colors, I'm actually using colors from a Spectral palette in bokeh. To make them more clear, I increased opacity from 0.6 to 0.8. Are distinctions clearer now?

Let me know what you think!

@bryevdv
Copy link
Member

bryevdv commented Mar 11, 2017

@mmowers I fetched the branch and took a quick look and the changes are pretty fantastic at a glance. I will take a closer look over the weekend. I don't expect to have many if any comments, thanks for the great example!

@bryevdv
Copy link
Member

bryevdv commented Mar 11, 2017

@mmowers on master I get errors like this when I try to change to a new csv:

2017-03-10 21:52:23,313 error handling message Message 'PATCH-DOC' (revision 1): RuntimeError('Cannot apply patch to 8a55e40a-99b2-45ca-a723-5ac408cc3a3e which is not in the document',)

is this working for you?

Edit: seem to get them with 0.12.4 too.

Edit 2: Oh, it's because there are no default axes selected.

@bryevdv
Copy link
Member

bryevdv commented Mar 11, 2017

Not for now, but a future improvement would be to handle datetime dimensions better, e.g. not turn every date into a categorical coordinate:

screen shot 2017-03-10 at 21 58 56

@mmowers
Copy link
Contributor Author

mmowers commented Mar 11, 2017

@bryevdv , thanks for the datetime note. I haven't yet viewed a csv with dates.

On the error, I noticed it before too, but it didn't seem to prevent anything from working. However, with a large enough data set with many plots that I'm switching out, I'll experience some pretty significant slowdowns during which those errors will continually spawn for a few seconds.

I've added to the instructions at the top of the page, including a note that users need to select x-axis and y-axis after they switch a data source.

I also cleaned up a flake issue and it looks like all checks are good now.

Thanks again!

@bryevdv
Copy link
Member

bryevdv commented Mar 11, 2017

@mmowers OK looks good, I only have one more small ask. The para at the top is pretty monolithic. Do you mind deleting the "Instructions:" at the beginning (it seems evident to me at least that they are instructions without that reminder), and splitting the rest into 2 or 3 paragraphs?

@mmowers
Copy link
Contributor Author

mmowers commented Mar 11, 2017

@bryevdv,
Done, thanks!

@bryevdv
Copy link
Member

bryevdv commented Mar 14, 2017

Going ahead and merging now. FYI this will fail when it is merged due to an unrelated problem (scipy.org is down causing our docs build to fail, this will resolve itself when the scipy.org site is restored.)

Thanks @mmowers !

Sign up for free to join this conversation on GitHub. Already have an account? Sign in to comment
Projects
None yet
Development

Successfully merging this pull request may close these issues.

New App Example: Exploding Pivot Charts
2 participants