Repository navigation
RESIDENT EVIL requiem (PPSA31246) #11599

Replies: 13 comments

Update: the opening cutscene, and where the time goesSame machine (RX 9070 XT, AMD 32.0.31021.1015, Ryzen 7 9800X3D, 32 GB RAM, Windows 11 26200). Tree:
With #11580, current Furthest point: the opening cutscene ("FBI Midwest Field Office"), through to the next area's load. Skipping a shot needs triangle held for about 90 s at these frame rates. Settings: Where the time goes in the cutscene (warm caches, unprofiled,
Tried, as local experiments:
So in this title the per-draw resource build runs for every draw, on two threads in lockstep. Reusing a draw's resource layout with new buffer addresses, and letting indirect draws through the draw pipeline, look like the changes that would matter here. I haven't attempted either. AI-assisted: yes (Claude Code). |
|
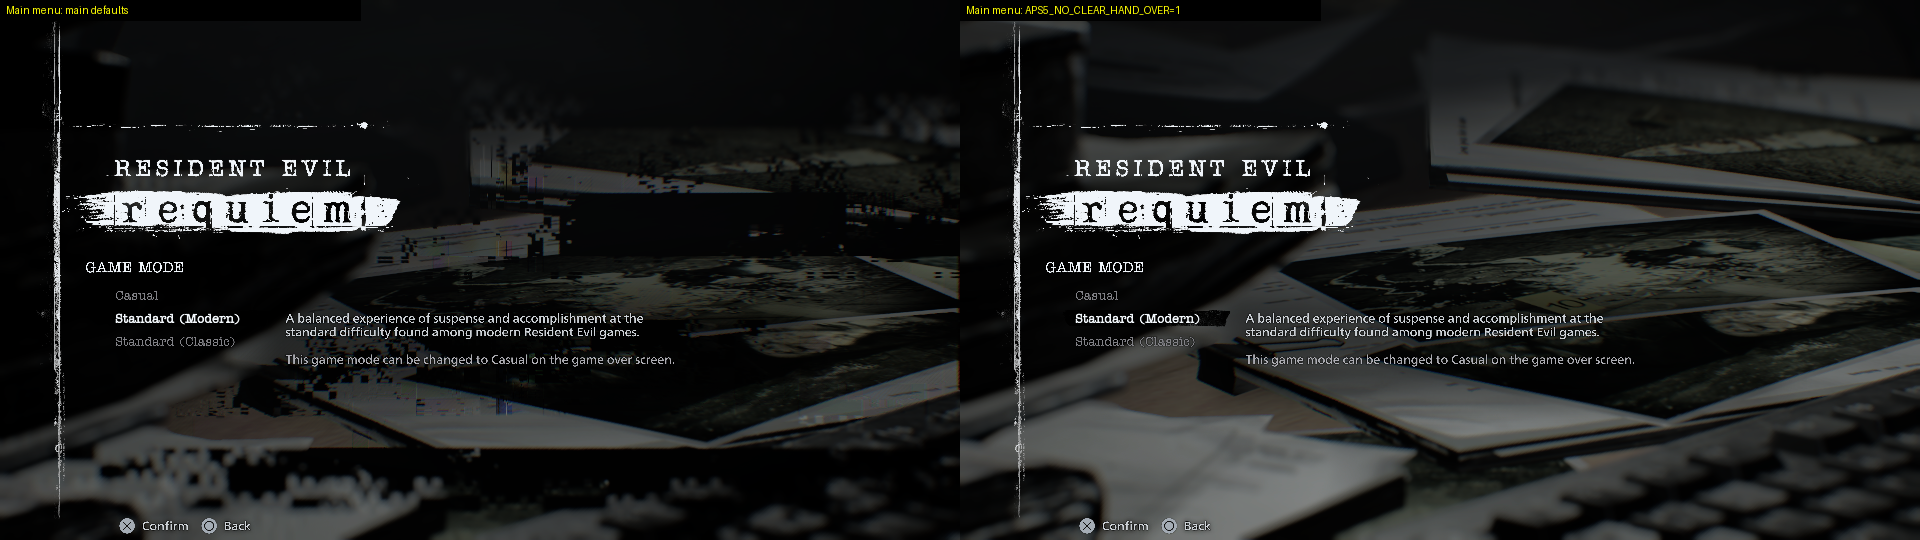
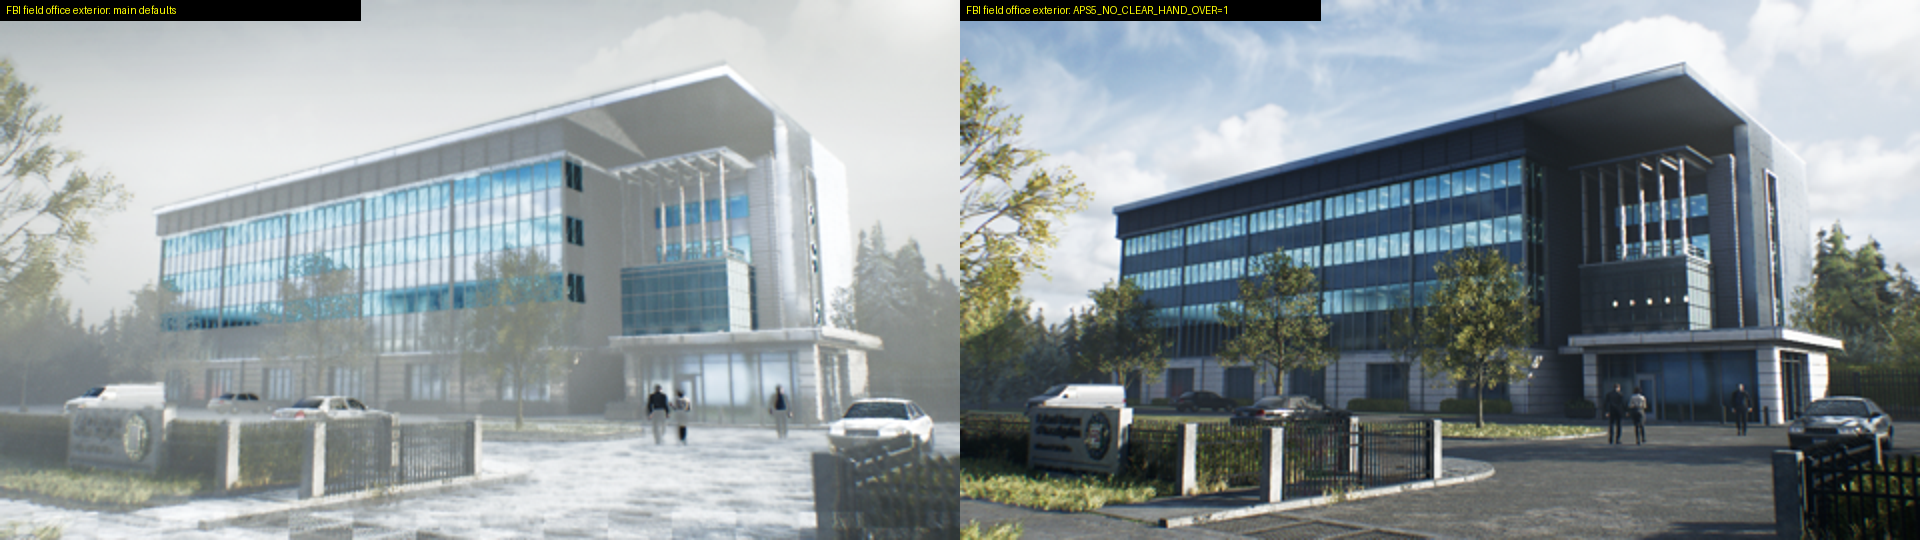
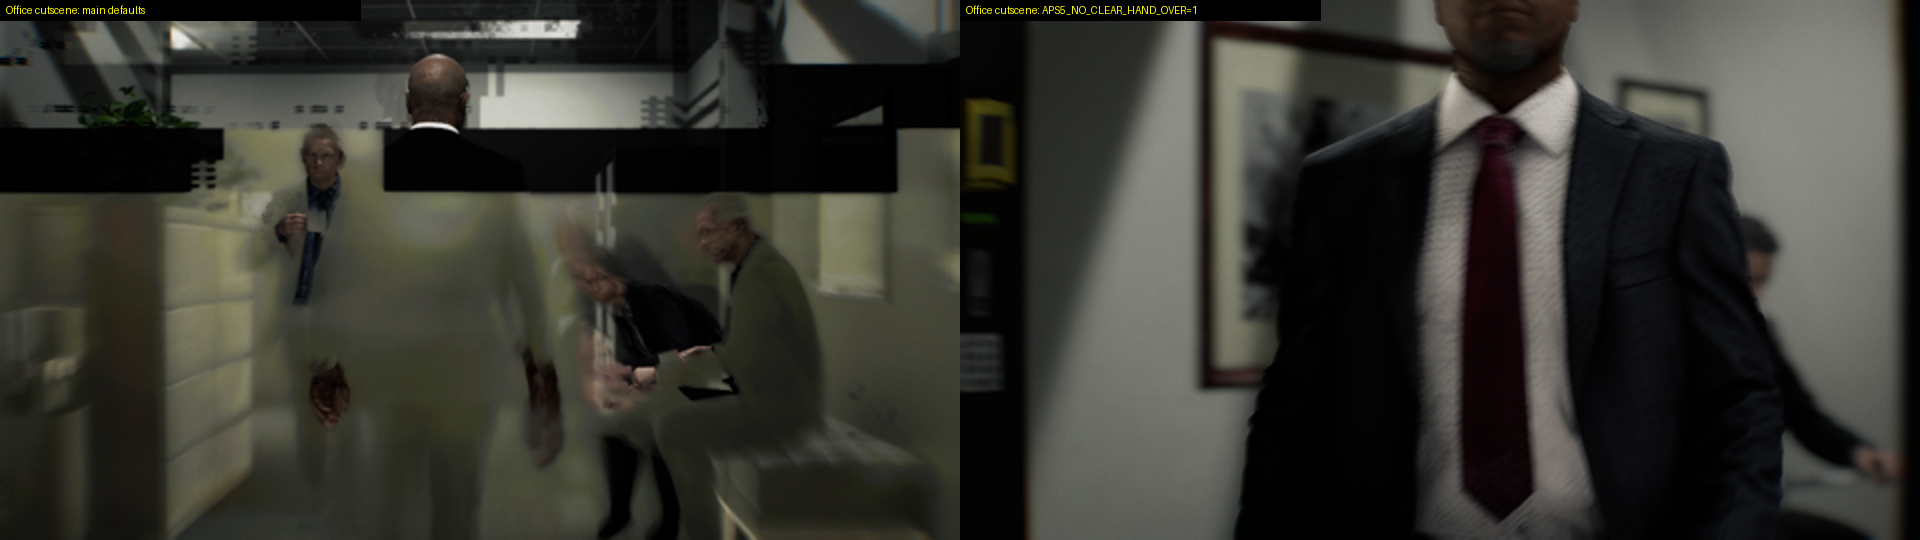
Screenshots from today's run: Main Story > New Game > Standard (Modern), into the opening cutscene, skipped forward by holding triangle. These are the frames the title presented, read back with Main menu. Readable and navigable. There is block corruption in the background on the right. Opening cutscene, FBI Midwest Field Office. The scene renders. Blocks of stale or wrong tiles show in the sky and along the bottom edge. Office cutscene. The characters render, with horizontal smearing on the clothing. Later in the same cutscene. The hands are detailed. Bands and blocks of an older image show through. A conversation in the office, a little later. Not every frame shows artifacts: this one renders cleanly. The blocks and bands look like regions that keep an earlier frame's contents, or are never written. I haven't traced them to a cause yet. Frame times in this run were 1-4.5 s, slower than usual because a build was running on the same machine. #11795 has the CPU-side analysis. AI-assisted: yes (Claude Code). |


|
The block corruption and the white glare both come from the clear-key hand-over (#7427). With How I narrowed it down:
The cutscene pairs are the same dump index from two runs. The cutscene runs on wall-clock time, so the shots can be a few seconds apart, but each pair is the same part of the scene. A correction to my screenshots above: the hazy, snow-like look of the FBI building, the "hands over fire" shot and the long white screens were all the glare, not the scene.
The black bands and stale tiles in the office scenes are gone as well. Settings for this title are now The build is the local tree from the description: AI-assisted: yes (Claude Code). |

|
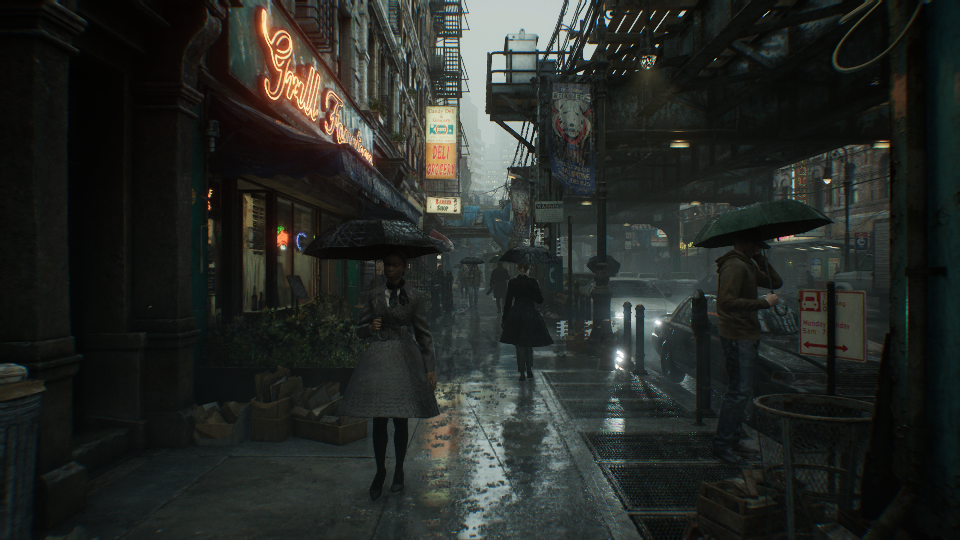
Past the memory wall: with #12074 the title gets through the load after the opening cutscene and reaches the next area, a rainy city street. #9999 is on top, so it renders without the corruption.
Without #12074, that load filled both GPU heaps and aborted on a failed heap-mirror slab allocation ( The build is the same local tree as in my previous comment, plus #12074 and #9999. Settings are Still open:
AI-assisted: yes (Claude Code). |
|
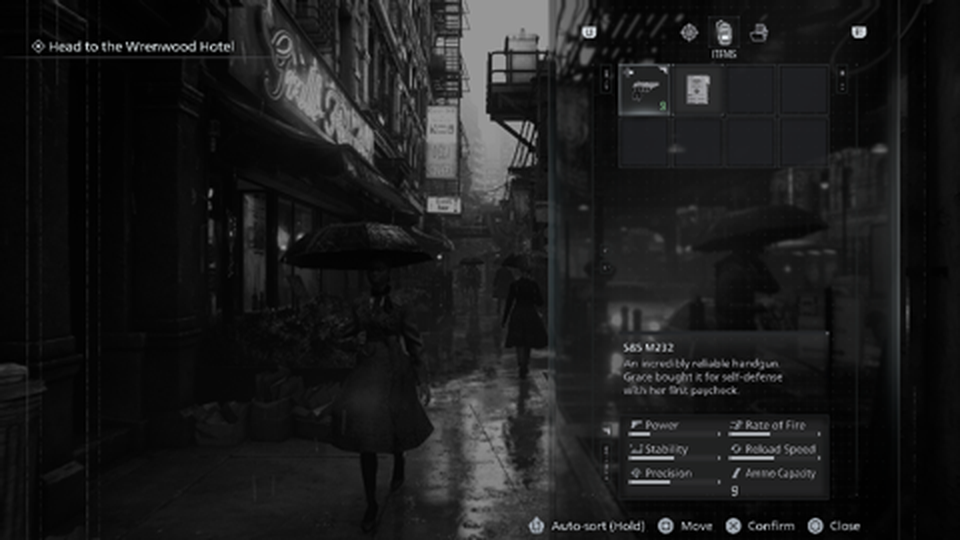
Gameplay reached, with the HUD, then a growing slowdown from texture-cache churn. After the street shot in my previous comment, the title is in player control. The objective "Head to the Wrenwood Hotel" is shown, and the inventory opens with the SBS M232 handgun. This is a frame dump at 480×270, scaled up:
The build is the same as in my previous comments: the local tree with #11357, #12074 and #9999, and The problem: in this area every frame is slower than the last. The median frame time, by time since launch:
What a stack sample of the draw committer shows (
The
Where the memory goes.
With
So the area's sampled working set is somewhere between 3 and 6 GB, and AI-assisted: yes (Claude Code). |
|
Filed the texture-cache churn from my previous comment as #12190, with the stack sample, the AI-assisted: yes (Claude Code). |
Slowdown on the loading card and in the first level: the cause in my 02:45 post was incomplete, and a budget prototypeSame rig as before: RX 9070 XT (16 GB), AMD 26.6.2, Windows 11 26200, Ryzen 7 9800X3D. The play tree is Correction. At 02:45 I said the sampled-texture cache sits at its 2 GB floor because storage images are held over their budget. That is not the main reason.
What uses the device-local heap. I logged every
Prototype (local, not a PR yet): (A) reserve the storage images' actual bytes instead of p50 frame time of the 30 s summary interval. Minutes are counted from the first frame over about 5 s, because the cutscene skips take a different time in each run. One run per build.
The prototype holds 7 to 13 s for about 20 minutes, against 30 to 60 s at default, but it climbs again after that (43 s and then 64 s in the last 3 minutes, at +32 min). The forced 3072 MiB budget stays flat, so something else keeps growing. The heap mirrors are the category that grew in the diagnostic run, so I'll look at them next, before turning A and B into PRs. AI-assisted: yes (Claude Code) |
Follow-up: why the prototype climbs again late, and the bigger cost behind the slowdownDevice-local use was flat in the second half of the prototype run (12.2 to 12.9 GB in use, sampled budget 2.5 to 3.0 GB), so the late climb isn't a memory squeeze, and it isn't the heap mirrors growing. What does track the frame time is how many sampled textures get created. The run's stdout logs one line per
Per 5 minutes, the prototype's distinct texture addresses went from about 730 to about 1,640 at 30 to 40 min, and the creation rate went from 40,000 back up to 390,000. The game's texture working set grew past the larger budget, and the rebuilds came back. Edited: in this run the prototype left the level's loading card for the level itself at about 30 min. That move is the jump in distinct textures, so the late climb is the level's larger texture set bringing the rebuilds back, after the lighter card. The multiplier is the important part. Once the sampled cache is full of textures used in the current present, AI-assisted: yes (Claude Code) |
|
The texture fix from my last two posts is up as draft PR #12575: a texture the full sampled cache refuses is kept for the rest of its present instead of being rebuilt on every lookup. On my integration tree (with an earlier version of it) the first level held 10.5–13.6 s/frame, flat for 45 minutes, against 30–60 s and climbing without it. The clean main-vs-PR A/B is still to come. AI-assisted: yes (Claude Code) |
|
Where the level frame goes (profiling update, Windows / RX 9070 XT, local branch with #12575 and per-entry image-table reuse from #6340) Level frames are about 10–12 s (0.08–0.10 fps). I sampled both driver threads in the first level (
Tried and not helping:
The two threads mostly take turns, because draw recording runs under the global GPU mutex that the worker's own GPU work also needs. Moving work between them doesn't speed the frame up. What would help is less work per draw under the lock: resource resolution, and the roughly 117 sampled textures re-created per second in this level, about 0.66 ms each just to allocate. #9248 (patched user word as push data) would remove the per-record re-materialization. A visual issue to look at separately: in the level, triangle edges show on most meshes (coats, umbrella, faces). |
|
Why requiem's draws never reuse anything across frames (draw cache diagnosis) Nearly every draw builds its resources from scratch: 971,000
So the reuse machinery is there, but its keys include per-frame data. Reuse across frames here needs that per-frame data (moved buffer bases and the values read through them) treated as refreshed inputs rather than as part of the key. The CPU-path indirect draws also need to be cacheable; #9243 does that behind Separately, the refused-texture fix in #12575 now keeps refused textures alive while frames keep using them. That cut sampled-texture rebuilds from about 118k to about 15k per run, but level frames barely changed (10.7–11.4 s against 10.9–12.3 s). |
|
Draw-cache follow-up: #9243 and a local port of #5609 on requiem
Reusing these draws across frames would need the per-frame data behind those pointers treated as refreshed input in general, not just buffer bases. |
|
#9243 + #9248 help requiem by about 10% With #9243 ( #9248 forwards about 2,400–2,600 indirect-record words per 10 s as push data instead of re-materializing the stage. About 1,850–2,000 stages per 10 s are still re-materialized, and about 3,600–3,900 words are refused because the shader reads the patched word as an address or value. Those refused words are the next thing to look at, because the worker that re-materializes them limits the frame here. The draw-cache tests these two touch ( |

Uh oh!
There was an error while loading. Please reload this page.
Existing thread
Title
RESIDENT EVIL requiem (PPSA31246)
Content version tested
01.200.000
AnyPS5 commit
main88795ed with #10935, #10304, #9950, #11199, #11369 and #11485 merged, and the merge of #8898 reverted locally (on currentmainthe title stops at boot; #11580 implements the missing path).System tested
Windows 11 Home 26200, WinLibs GCC 15.2.0 r7 (Release), AMD Radeon RX 9070 XT (AMD 32.0.31021.1015, Vulkan 1.4.349), Ryzen 7 9800X3D
Furthest point
Menu
What is shown
Logos, then the main menu (Main Story, Bonuses, Options, PlayStation Store) at about 5 fps at 3840x2160; pad input works and the menu can be navigated. Parts of the menu background are drawn as black blocks. Main Story > New Game > Standard shows the "requiem" title card, then a black screen while the title keeps drawing and reading data at about 1 fps; gameplay was not reached. One run left there for about 40 minutes stopped on
VK_ERROR_OUT_OF_DEVICE_MEMORY(host imports about 4.5 GB over a 2.7 GB budget).Current blocker
Open pull requests the title needs, in the order it hits them:
guest writes over native multisample depth are not implementedafter the logos)mainsince fix(shader_recompiler): pack format 11_11_10 float image stores in shader #8898, a boot stop:compute shader ...: reads or writes a converted float image with 16-bit data, which is not implemented)Performance: #11485 (menu 214 → about 185 ms per frame). Remaining: the slow story load after New Game and the out-of-memory stop, not yet investigated; the black blocks on the menu background.
How it was run
app.exenext to the title'sapp0/and the builtlibs/, started from that folder. Runs usedAPS5_LOOP_GUARD=100000and a separateANYPS5_SHADER_CACHE_DIR; nothing beyond the usage guide was needed.All reactions