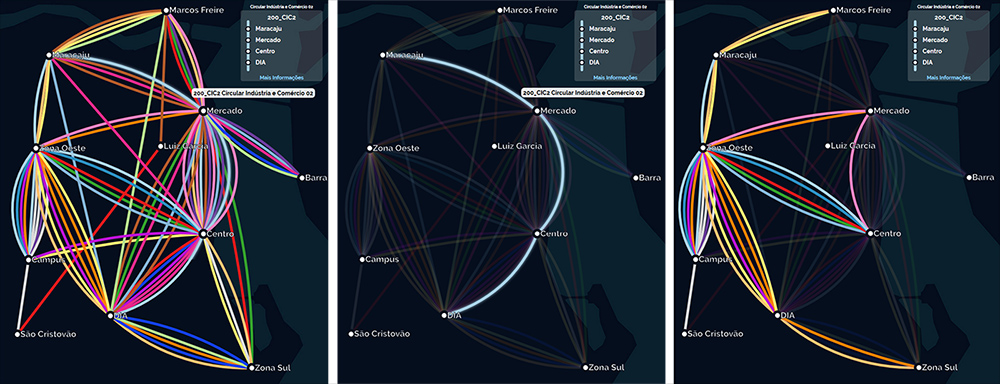
Interactive Data Visualization of Public Bus Transportation connections between bus stations in Aracaju, Sergipe, Brazil.
The public bus transportation network has a great importance in the routine of the major part of the people of Aracaju, Sergipe, Brazil. However, the mobility inside the network is cloudy for those whom has no knowledge about the bus lines' routes.
This project aimed to bring to surface some information insights about the flow of the current city bus network, hoping to clear some questions:
- For each bus line: which bus stations they visit?
- For each bus station: which bus lines visits there? Where can I reach from there? (What other stations?)
- Which bus stations are the most connected ones? Which ones are the less?
Try it now here 👈
The main file dataviz_mapping_aracaju.html is in root/ directory.
css/ : css files
data/ : JSON source data of bus public transportation
etc/: images and other files
- Regional public transportation data retrieved from SMTT Aju (Originally PDF Format).
-
Live demo here as mentioned previously.
-
Locally:
- Download and extract the project
- Open in browser
index.html.- But be aware that CORS issue could happen when try loading JSON/CSS files. If this happen, one solution is changing the loading of the respective files to remote (web URLS instead of local) or in Mozilla Firefox disable it (about:config) to able for preview.
Credits also to some code snippets found on internet that inspired and were adapted:
- Add a dropdown to choose bus line (todo);
- Show bus lines that visit less than 2 stations (no connections) (todo);
Show more info about a bus line selected (url to original pdf)(done);Show a summary visualization of the sequencial station connections when a bus line is selected, in a format similar to this;(done)
