SOFT example
#Enriching network with expression time series from Gene expression omnibus
To follow this example, download the sample data. It contains a Cytoscape session with B. subtilis regulatory network (file "Arrieta-Ortiz-et-al-2015_EV5.cys") from (Arrieta-Ortiz et al. 2015, original source) and expression time series collected under mild potassium acetate stress (file "B.subtilis-expression (GDS5652).soft"; taken from Ter Beek A, Wijman JG, Zakrzewska A, Orij R et al. 2015, original source).
You can either watch a video tutorial, or follow the steps below.
-
Open the session ("Arrieta-Ortiz-et-al-2015_EV5.cys").
-
Go to
File -> Import -> Data Series -> From SOFT file(SOFT is the file format used by Gene Expression Omnibus - see the specification for more details).
-
Choose the "B.subtilis-expression (GDS5652).soft" from the sample data directory.
-
The SOFT file import dialog is shown.

-
Fill in the basic information:
- Name of the data series (let's say "Expression KCH3COOH")
- We want to import as "Time series" - this means that both the data and the indices (column names) are numbers. If we had measurements in multiple conditions (e.g. several treatments vs. control) we would use "Named numeric series" where the indices (column names) are text (strings).
- We want to map the series to our network so we keep the checkbox on.
-
Import the correct columns. Note that we have two columns containing gene identifier, so we uncheck "Import all columns" and uncheck the "ID_REF" column to not import it.

-
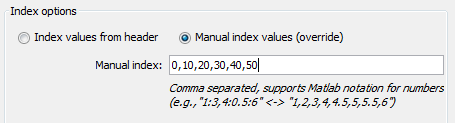
Time series require the indices (column names) to be numbers, but the indices in the data are strings (e.g., "GSM1328826"), so we need to provide manual index values. We see in the column descriptions, that the samples correspond to 0 - 50 minutes, so we give "0,10,20,30,40,50" or "0:10:50" (equivalent Matlab notation) to give proper values.
-
Click "OK" to import. The series has been imported, but it is not connected to any network. Now, we see the "Map data series" dialog that lets us create such a mapping.

-
We choose the "net-child" as our target network. We want to map the nodes (as nodes represent genes). The mapping uses a column in the node table to contain a foreign key into the data series. We want to keep the default (create new column).
-
The only thing that remains is to determine how the mapping is actually chosen. We can match the row names of the series to a column that contains the names (in the same format). In our case this is the "geneName" column.
-
We're done! Know when you show the "Data series visual" panel (bottom), and click on a node or an edge, you se the expression profile of the corresponding genes.
[[examples-img/import_soft_final.png|alt=final state]]
The session with the time series imported and mapped is saved as "Arrieta-Ortiz-et-al-2015_EV5_SOFT_final.cys" in the sample data.