Tabular example
#Enriching network with expression time series from .CSV/.TSV file
To follow this example, download the sample data. It contains a Cytoscape session with B. subtilis regulatory network (file "Arrieta-Ortiz-et-al-2015_EV5.cys") from (Arrieta-Ortiz et al. 2015, original source) and expression time series collected during germination (file "B.subtilis-germination (GSE6865).tsv"; slightly reformatted from Keijser, B.J. et al. 2007, original source).
-
Open the session ("Arrieta-Ortiz-et-al-2015_EV5.cys").
-
Go to
File -> Import -> Data Series -> From tabular file (.csv,.tsv, etc.) ....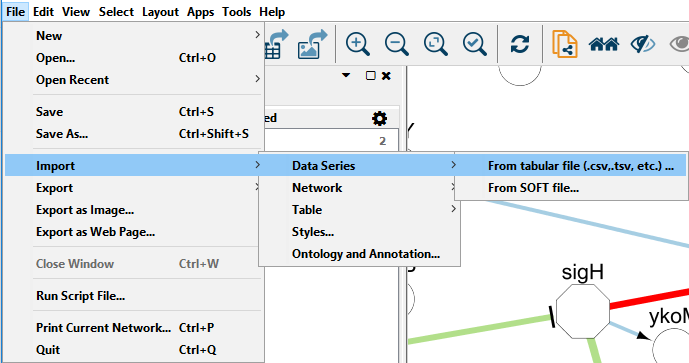
-
Choose the "B.subtilis-germination (GSE6865).tsv" from the sample data directory.
-
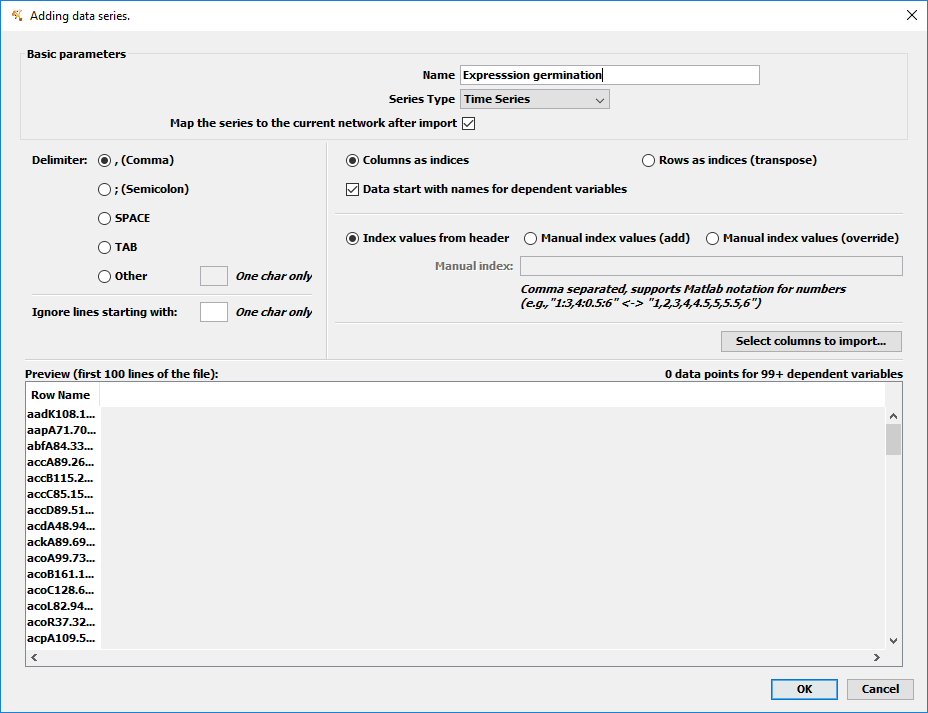
The tabular file import dialog is shown.
-
Fill in the basic information:
- Name of the data series (let's say "Expression germination")
- We want to import as "Time series" - this means that both the data and the indices (column names) are numbers. If we had measurements in multiple conditions (e.g. several treatments vs. control) we would use "Named numeric series" where the indices (column names) are text (strings).
- We want to map the series to our network so we keep the checkbox on.
-
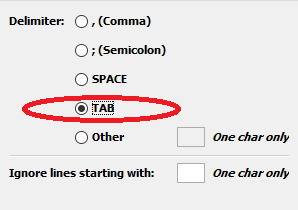
We need to check the correct delimiter ('TAB').
-
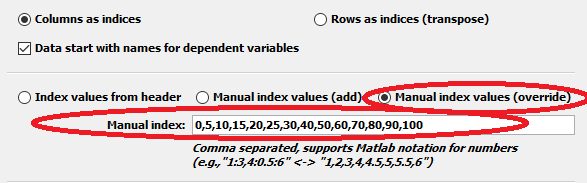
Time series require the indices (column names) to be numbers, but the indices in the data are strings (e.g., "GSM177105"), so we need to provide manual index values. Checking the description of the data provided by the authors, the time points corresponding to individual columns are "0,5,10,15,20,25,30,40,50,60,70,80,90,100" all minutes. We can shorten it with Matlab notation as "0:5:30,40:10:100". We check "Manual index (override)" (the "add" option is useful when the file has no header of its own).
-
Click "OK" to import. The series has been imported, but it is not connected to any network. Now, we see the "Map data series" dialog that lets us create such a mapping.
-
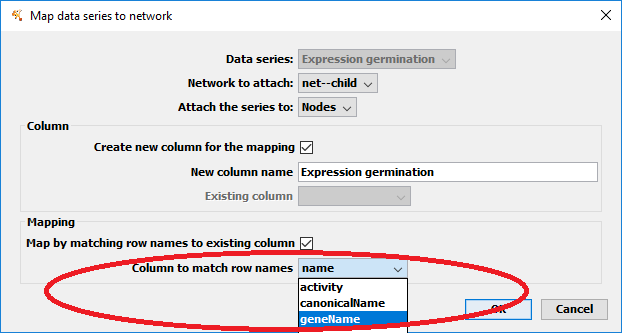
We choose the "net-child" as our target network. We want to map the nodes (as nodes represent genes). The mapping uses a column in the node table to contain a foreign key into the data series. We want to keep the default (create new column).
-
The only thing that remains is to determine how the mapping is actually chosen. We can match the row names of the series to a column that contains the names (in the same format). In our case this is the "geneName" column.
-
We're done! Know when you show the "Data series visual" panel (bottom), and click on a node or an edge, you se the expression profile of the corresponding genes.
[[examples-img/import_tsv_final.png|alt=final state]]
The session with the time series imported and mapped is saved as "Arrieta-Ortiz-et-al-2015_EV5_TSV_final.cys" in the sample data.