graphviz2dtrace creates monitoring scripts in the DTrace D
scripting language from automata specifications written in
Graphviz dot notation. It is best thought of as a backend to
LamaConv which lets you associate the atomic
propositions in your LTL formulas with DTrace probe specifications to create monitoring scripts.
This allows you to leverage the thousands of instrumentation points provided by DTrace (including DTrace's dynamic instrumentation facilities, of course) without having to master the D scripting language.
Currently, graphviz2dtrace only works with monitor automata adhering to LTL3
semantics.
graphviz2dtrace was developed as part of my MsC in Informatics at
the University of Oslo in 2016: "Leveraging DTrace for Runtime Verification" (forthcoming).
graphviz2dtrace requires docopt and PyGraphviz
to run.
A demonstration screencast is available on Vimeo.
Runtime verification with graphviz2dtrace proceeds in three steps:
-
Decide on a verification property, express it in LTL and use LamaConv to produce an LTL3 monitor.
-
Find a way to map the atomic propositions in the LTL formula with DTrace probe specifications (with optional predicate expressions). Express this mapping in a JSON file.
-
Feed the automaton and the mapping to
graphviz2dtraceto produce the monitoring script.
Suppose we are implementing a stack in C supporting the standard operations push and pop. Suppose also that the stack has a function for reporting if the stack is empty or not. The complete C program is available here.
Suppose we want to ensure that if the stack is pushed to and eventually found empty, at least one pop event must have occurred. We can specify the property as follows:
[]((push && <>empty) -> (!empty U pop))
Having specified the property, we can create a corresponding monitor automaton with LamaConv:
rltlconv "LTL=[]((push && <>empty) -> (!empty U pop)),ALPHABET=[push,pop,empty]" --formula --moore --min --dotThis invocation produces this dot script, which encodes the following automaton:
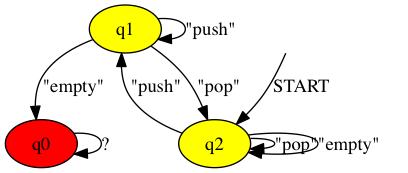
If the automaton enters the red state q0, it has detected a violation of the property.
To create a monitoring script for this automaton, we need to associate the atomic propositions in the LTL formula - push, pop and empty - with DTrace probe specifications. Let us associate the pop proposition with the event that the function popis returned from. Using the DTrace pid provider we can detect every time pop is returned from with the probe expression pid$target::pop:return. Similarly, we
can associate the push proposition with the event that the push function is being called using the probe expression pid$target::push:entry. Finally, we can associate the empty proposition with the event that the empty function returns 1 (which in C semantics is interpreted as true). We express this with a DTrace probe expression like so: pid$target::empty:return/arg1 == 1/
We encode our mapping in a JSON file as follows:
{
   "empty": "pid$target::empty:return/arg1 == 1/",
   "pop": "pid$target::pop:return",
   "push":"pid$target::push:entry"
}
We can then feed the automaton and the mapping to graphviz2dtrace to produce a monitoring script:
$ graphviz2dtrace -m mapping.json automaton.dotThe resulting script is written to STDOUT, and can be easily redirected to a file.
Suppose the stack program in question (available here) is compiled into a binary named stack, and that it has
the following erroneous implementation of the push function, which forgets to increment
the buffer index after adding a new element:
void push(int number, int * i)
{
    buffer[*i] = number;
}

int empty(int * i)
{
    return *i == 0;
}
Notice also that the empty function simply checks if the current
buffer index is 0. In other words, this implementation violates the
property we specified above, since it is possible to report empty
after a push even though no pop has occurred.
Let us use our newly generated monitor to detect this violation. We create a test input to the stack program that we expect will incite the error:
PUSH 1
EMPTY
PUSH 2
The most straightforward way of attaching our monitor to the running
stack program is to use our monitor to start the program with DTrace's
-c flag. We feed the input test case incite_error.txt to the program and get
the following interaction:
$ sudo ./monitor.d -c ./stack < incite_error.txt
PUSHED 1
YES
PUSHED 2
REJECTED
As we can see, the monitor reports REJECTED.
Let us patch up the stack program and run the monitor again. We fix the push function like so:
void push(int number, int * i)
{
    buffer[*i] = number;
    *i += 1;
}
We compile the new fixed program as stack-wpushfix and run the test case again:
$ sudo ./monitor.d -c ./stack < incite_error.txt
PUSHED 1
NO
PUSHED 2
INCONCLUSIVE
As we can see, the verdict is INCONCLUSIVE.
Suppose the stack program shown above is already running with PID 1575. We can then attach
the monitor to this process by using the DTrace -p flag:
$ sudo ./monitor.d -p 1575Suppose we knew that the stack program was running with PID 1575 and that a push had already occurred.
We could then attach the monitor and set the automaton in the state corresponding to q1 shown in the automaton above.
All graphviz2dtrace-generated scripts come with a comment showing which internal numeric code each
state has been given. For the stack monitor discussed above, the mapping looks like this:
/*
q0 mapped to 1
q1 mapped to 2
q2 mapped to 0
*/
To force the automaton to start in q1, we simply provide 2 on the first available command
line slot:
$ sudo ./monitor.d -p 1575 2Scripts produced by graphviz2dtrace are susceptible to race conditions on the
automaton's state variable whenever two probes can fire at the same time and are not
differentiated by an appropriate predicate expression.