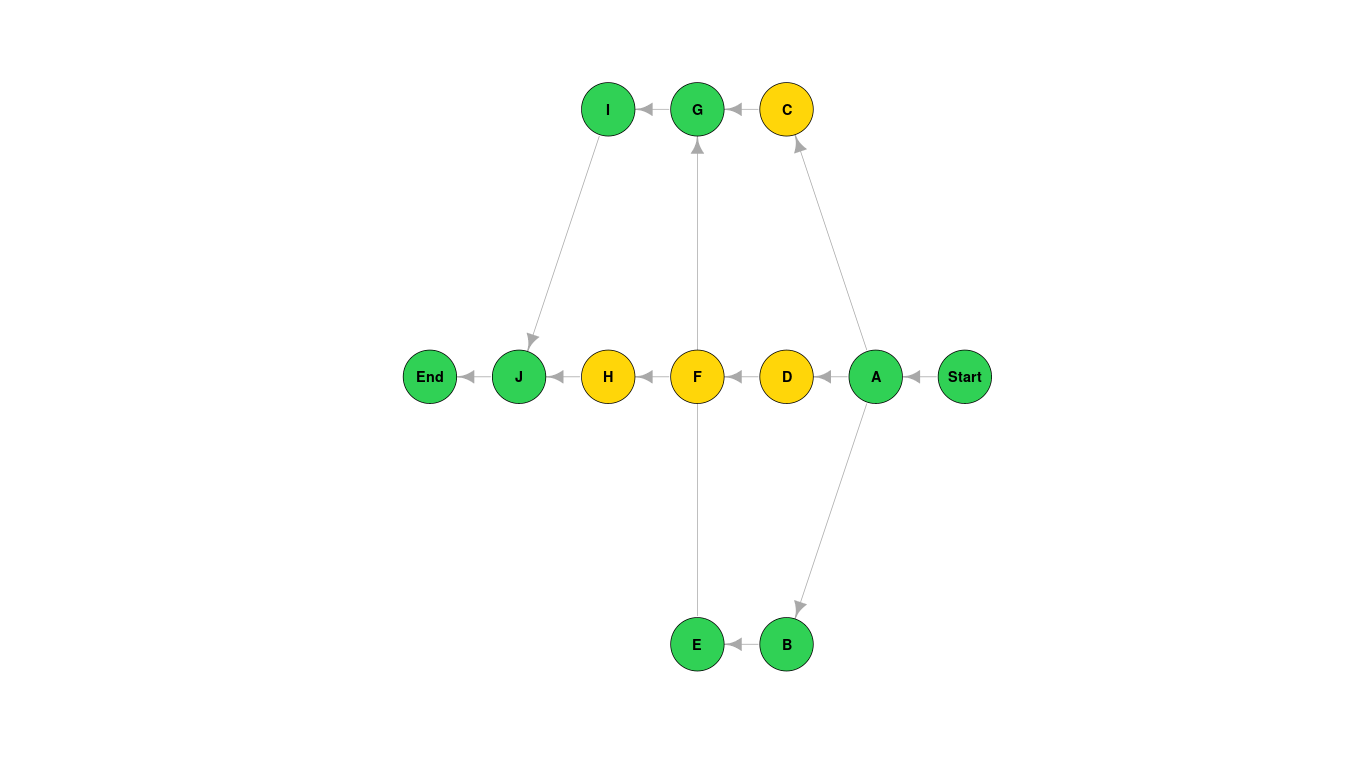
This is a R program that takes an activity table whether it is a CPM or a PERT and and proccess it to find the critical path (along with some other calculations in the PERT method )
The Project Evaluation and Review Technique (PERT) and Critical Path Method (CPM) were developed by management scientists to help organizations with planning, scheduling and controlling large projects,such as building a new hospital orlaunching a newproduct.
large projects has serie sof interdependent activities that take time to complete,require funds and resources, such as time andlabor.
Interdependence means that activities follow a given sequence orprecedence relationship -some activities cannot start until others are completed.
Steps :
- Step 1. Identify theactivities
- Step 2. Determine activity relationships (immediate predecessors of eachactivity)
- Step 3. Estimate activity completion times andcosts
- Step 4. Construct an activitynetwork
- Step 5. Execute a forward pass to determine earliest start and earliest finish times for each activity, and project completion time
- Step 6. Execute a backward pass to determine latest start and latest finish times for each activity
- Step 7. Identify activity slack (length of time an activity can be delayed without delaying the project completiontime)
- Step 8. Find the activities with zero slack; these are critical activities and make up at least one critical path
- Step 9. Use information from Steps 5 -8 to develop the activity schedule for the project.
- Step 10. Find project completion time variance and conduct probability analysis, suchas the probability of meeting a customer target completion time, under the condition of uncertainty in activity times.
- Step 11. Consider time-cost tradeoffs
- Step 10. Implement, monitor and control the project.
The critical path method, or critical path analysis, is an algorithm for scheduling a set of project activities. It is commonly used in conjunction with the program evaluation and review technique.
Steps :
-
takes an activity table with each activity's titel, immediate predecessor(s) and time and stores it into a graph
-
using a modified Breadth First Search algorithm to traverse the graph to find the forward and backward path
-
in the forward path it calculates the ES (Early Start time) and EF (Early Finish time ) of each activity
-
in the backward path it calculates the LS (Late Start time ) and LF (Late Finish time ) of each activity
-
calculate the slack value of each activity
ES (Early Start Time) = maximum value of "EF" for all the activities it depends on
EF (Early Finish Time) = ES + Activity time
LF (Late Finish Time) = minimum value of "LS" for all the activites that depends on this activity LS (Late Start Time ) = LF - Activity time
S (Slack Value) = LS - ES of each activity, if it's zero then this activity is in the critical path -
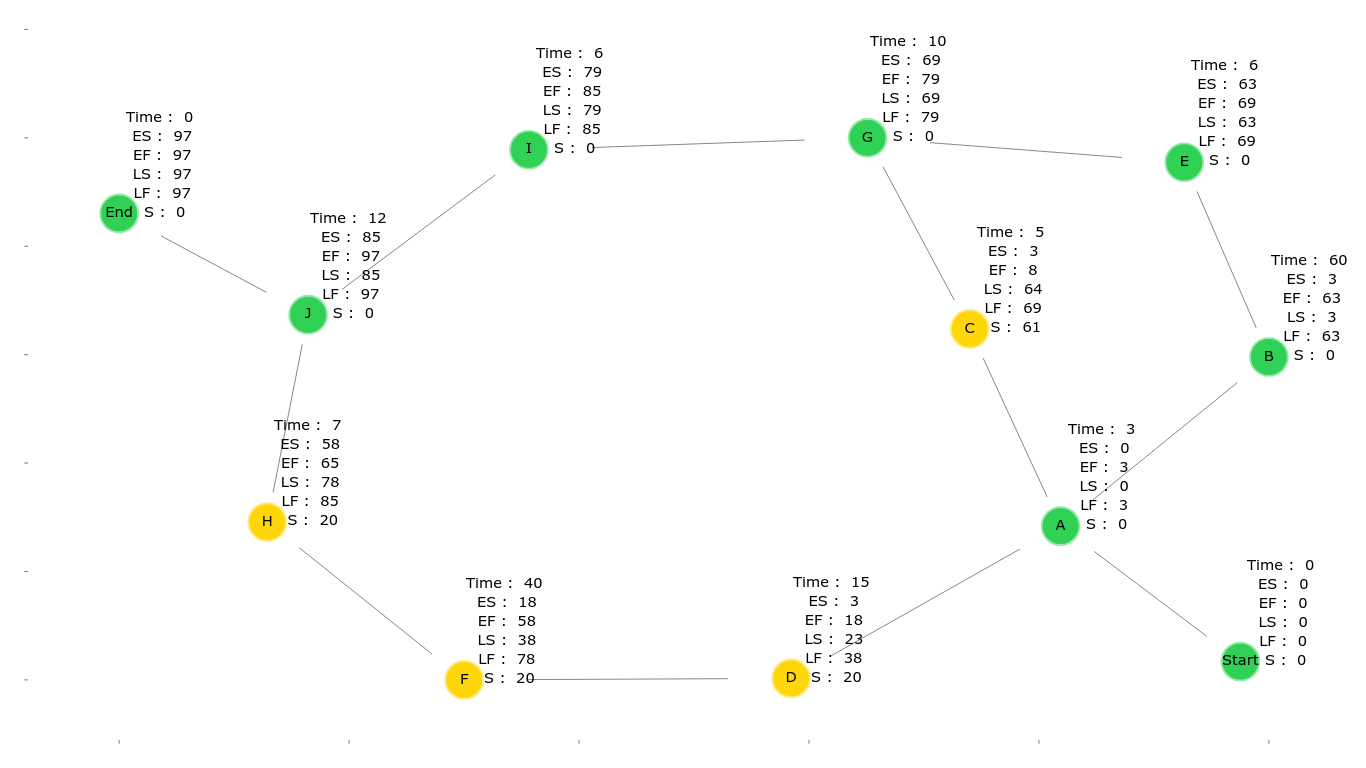
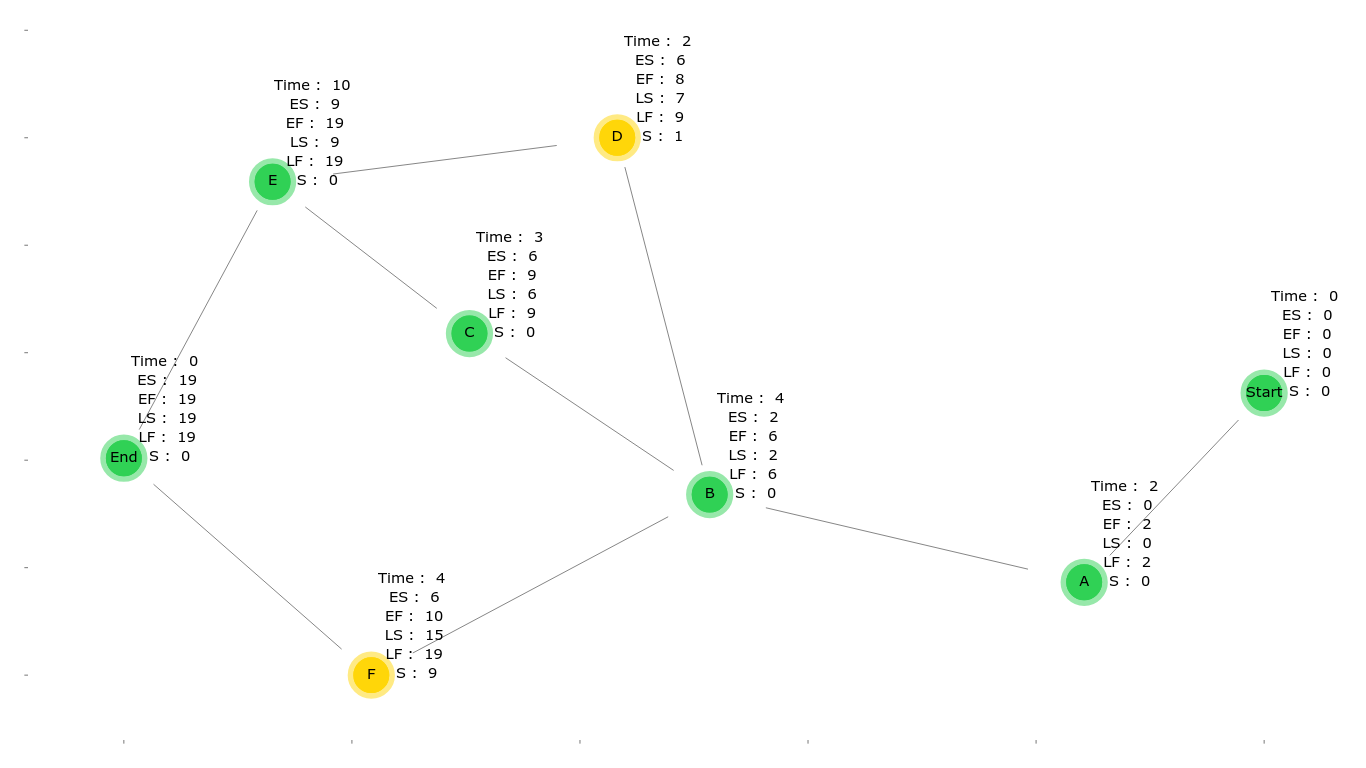
draws a plot showing the graph, the attributes for each node and the critical path (green nodes),
Here is Some Sample Tests And It's Output
| Activity | Title | Immediate Predecessors | Activity Time |
|---|---|---|---|
| A | Identify market need | - | 3 |
| B | Conduct R&D | A | 60 |
| C | Design packaging | A | 5 |
| D | Select product size | A | 15 |
| E | Conduct product test | B | 6 |
| F | Install production process | D | 40 |
| G | Perform market analysis | C E | 10 |
| H | Production startup | F | 7 |
| I | Make modifications | G | 6 |
| J | Market product | H I | 12 |
| Activity | Title | Immediate Predecessor | Activity Time |
|---|---|---|---|
| A | High-level analysis | - | 7 |
| B | Selection of hardware platform | A | 7 |
| C | Installation and commissioning of hardware | B | 14 |
| D | Detailed analysis of core modules | A | 14 |
| E | Detailed analysis of supporting modules | D | 14 |
| F | Programming of core modules | D | 14 |
| G | Programming of supporting modules | E | 21 |
| H | Quality assurance of core modules | F | 7 |
| I | Quality assurance of supporting modules | G | 7 |
| J | Core module training | C H | 1 |
| K | Development and QA of accounting reporting | E | 7 |
| L | Development and QA of management reporting | E | 7 |
| M | Development of Management Information System | L | 7 |
| N | Detailed training | I J K M | 7 |
| Activity | Title | Immeediate Predecessors | Activity Time |
|---|---|---|---|
| A | "TEST" | - | 2 |
| B | "TSET" | A | 4 |
| C | "TEST" | B | 3 |
| D | "TEST" | B | 2 |
| E | "TEST" | C D | 10 |
| F | "TEST" | B | 4 |
| Activity | Title | Immediate Predecessors | Activity Time |
|---|---|---|---|
| A | "TEST" | - | 3 |
| B | "TEST" | A | 60 |
| C | "TEST" | A | 5 |
| D | "TEST" | A | 15 |
| E | "TEST" | B | 6 |
| F | "TEST" | D | 40 |
| G | "TEST" | C E | 10 |
| H | "TEST" | F | 7 |
PERT is a scheduling technique that was specifically designed by the Navy in 1958for projects with uncertain activitytimes.
Steps :
- Takes an activities table as follow (Activity - Title - Immediate Predecessor - Optimistic Time - Most probable Time - Pessimistic Time )
- Finds the Expected Time for each activity by : expected_time(a) = ( Optimistic Time + 4 * Most probable Time + Pessimistic Time ) / 6
- Finds the variance of each activity by : variance(a) = (Pessimistic Time - Optimistic Time ) ^ 2 / 36
- sends the modified table to CPM function to find the critical path
- Find mean which is the sum of Expected Times of critical path activities
- Finds the total variance which is the sum of Variance o critical path activities
- Finds the standard deviation which is the square root of variance
- Finds the probabilty to finish the project on a specific Time
Here is Some Sample Tests And It's Output
| Activity | Immediate Prodecessor | Optimistic Time | Most probable Time | Pessimistic Time |
|---|---|---|---|---|
| A | - | 6 | 9 | 12 |
| B | A | 3 | 4 | 11 |
| C | A | 2 | 5 | 14 |
| D | B-C | 4 | 6 | 8 |
| E | C | 1 | 1.5 | 5 |
| F | E | 5 | 6 | 7 |
| G | D | 7 | 8 | 15 |
| H | B | 1 | 2 | 3 |
|              Task     |    ans     |
| -------------------   | ---------- |
|              Variance | 7.22222222 |
|    Standard Deviation | 2.68741925 |
| Propability on 26 day | 4.9%       |


