This is a project about noise levels. Specifically the recorded noise levels on the San Francisco subway system commonly referred to as BART. I wanted to find a way to express these sounds visually and to turn it into a real-time mobile BART experience. BART riders would share the experience and suffer from extreme noise levels and variation of frequency. I divided this project up into a few main areas:
- dB Level Recordings (how loud is loud)
- Sound Map Design
- Mobile Experience by @seacloud9
- App Communication
- Deployment
- Wifi & Delivery
- tl;dr DEPLOY
I recorded hours of sound. You can read more about the "why" at my Medium article here. In short, I ended up with an array of sound levels measurements exactly 1 second apart. Below is a 10 second data sample from an 8 min trip between Embarcadero and West Oakland recording.
| Place | Date | Time | Value | Unit |
|---|---|---|---|---|
| 140 | 6/1/2016 | 22:22:20 | 85.6 | dB |
| 141 | 6/1/2016 | 22:22:21 | 88.5 | dB |
| 142 | 6/1/2016 | 22:22:22 | 88.6 | dB |
| 143 | 6/1/2016 | 22:22:23 | 95.7 | dB |
| 144 | 6/1/2016 | 22:22:24 | 96.9 | dB |
| 145 | 6/1/2016 | 22:22:25 | 100.6 | dB |
| 146 | 6/1/2016 | 22:22:26 | 127.6 | dB |
| 147 | 6/1/2016 | 22:22:27 | 129.2 | dB |
| 148 | 6/1/2016 | 22:22:28 | 118.5 | dB |
| 149 | 6/1/2016 | 22:22:29 | 96.7 | dB |
Here are a dozen or so recording runs in Google Sheets providing sound data. I've included a garage door test as well.
You can take this data and map the magitudes to a 2D map using this Cartesian data. This XY was used for the mapping as well as the dynamically generated BART line splines and may be found in the bart.js file. These splines were the path for the particle emitters as well.
| Stop | X | Y | X (Normalized) | Y (Normalized) |
|---|---|---|---|---|
| Pittsburg/Bay Point | 852 | 962 | 0.852 | 0.962 |
| North Concord/Martinez | 796 | 928 | 0.796 | 0.928 |
| Concord | 729 | 887 | 0.729 | 0.887 |
| Pleasant Hill/Contra Costa Centre | 669 | 851 | 0.669 | 0.851 |
| Walnut Creek | 602 | 810 | 0.602 | 0.81 |
| Lafayette | 540 | 773 | 0.54 | 0.773 |
| Orinda | 478 | 735 | 0.478 | 0.735 |
| Rockridge | 416 | 697 | 0.416 | 0.697 |
| MacArthur | 376 | 650 | 0.376 | 0.65 |
| 19th St/Oakland | 375 | 618 | 0.375 | 0.618 |
| 12th St/Oakland City Center | 373 | 587 | 0.373 | 0.587 |
| West Oakland | 281 | 544 | 0.281 | 0.544 |
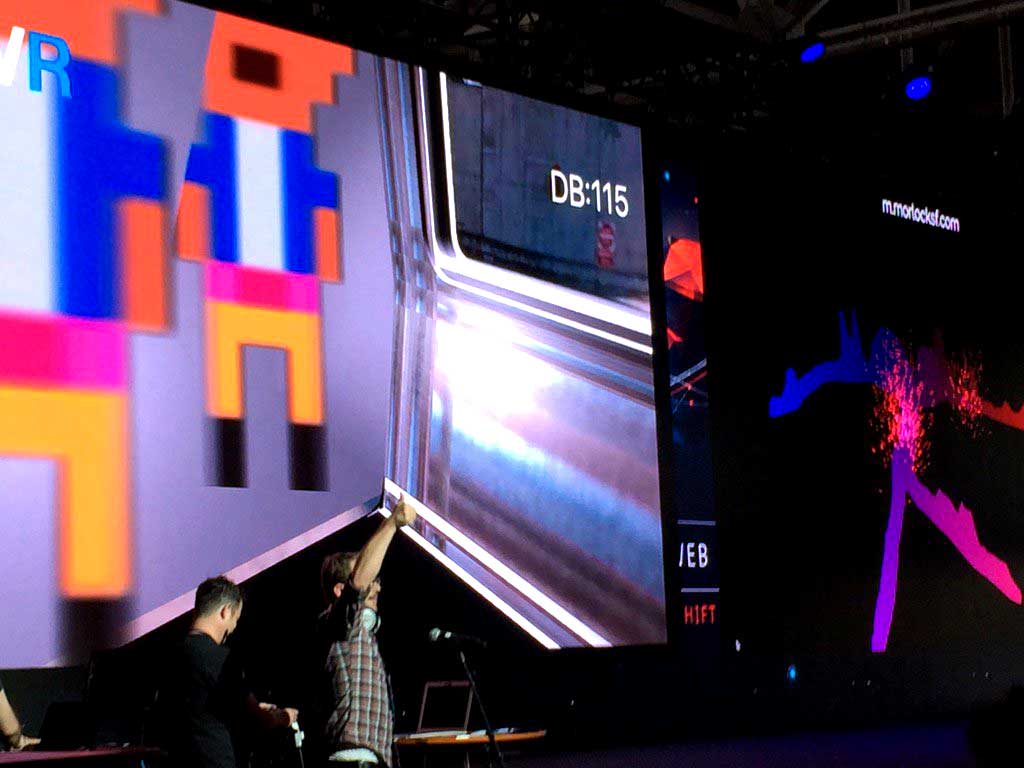
Plot the sound and locations to create a depth map. There are many ways to do this, I'd suggest using Python or JavaScript. Extrude the depth map using Maya to create this very depressing aural mesh: 
Check out his writeup here.
Our app was composed of two major communcation requirements. Control to Clients and Clients to Clients. That second realtionship is the scariest to consider.
- recorded dB levels every second
- avg-freq @ 60 fps
- manual interrupts (e.g. BART arrives at a start or visualization activates)
- position at 60 fps
- rotation @ 60 fps
- NOTE: control is a client as well
Surge is great! && FREE! It deployes to the AWS CDN.
npm install -g surgesurge app.... [deployed domain]surge rider/www... [mobile deployed domain]surge helpto learn more
If you want to deploy via CircleCI, you can follow their instructions to add a Surge Token and Login. I've included a circle.yml file for you already.
More-so than most applications, this one works best in low-latency/high-bandwidth delivery. We crossed our fingers, you may have to as well. Ideally, have your users download any large files before the presentation.
To use the code. You'll need to:
- Create a free firebase account
- copy() the FB URL.io after setup
- Paste into two places
- Somehow launch
app&&rider/wwwlocally or on a server. - Connect to the
applocation and click the play button in the bottom left. This initiates communcation to therider/wwwclient.