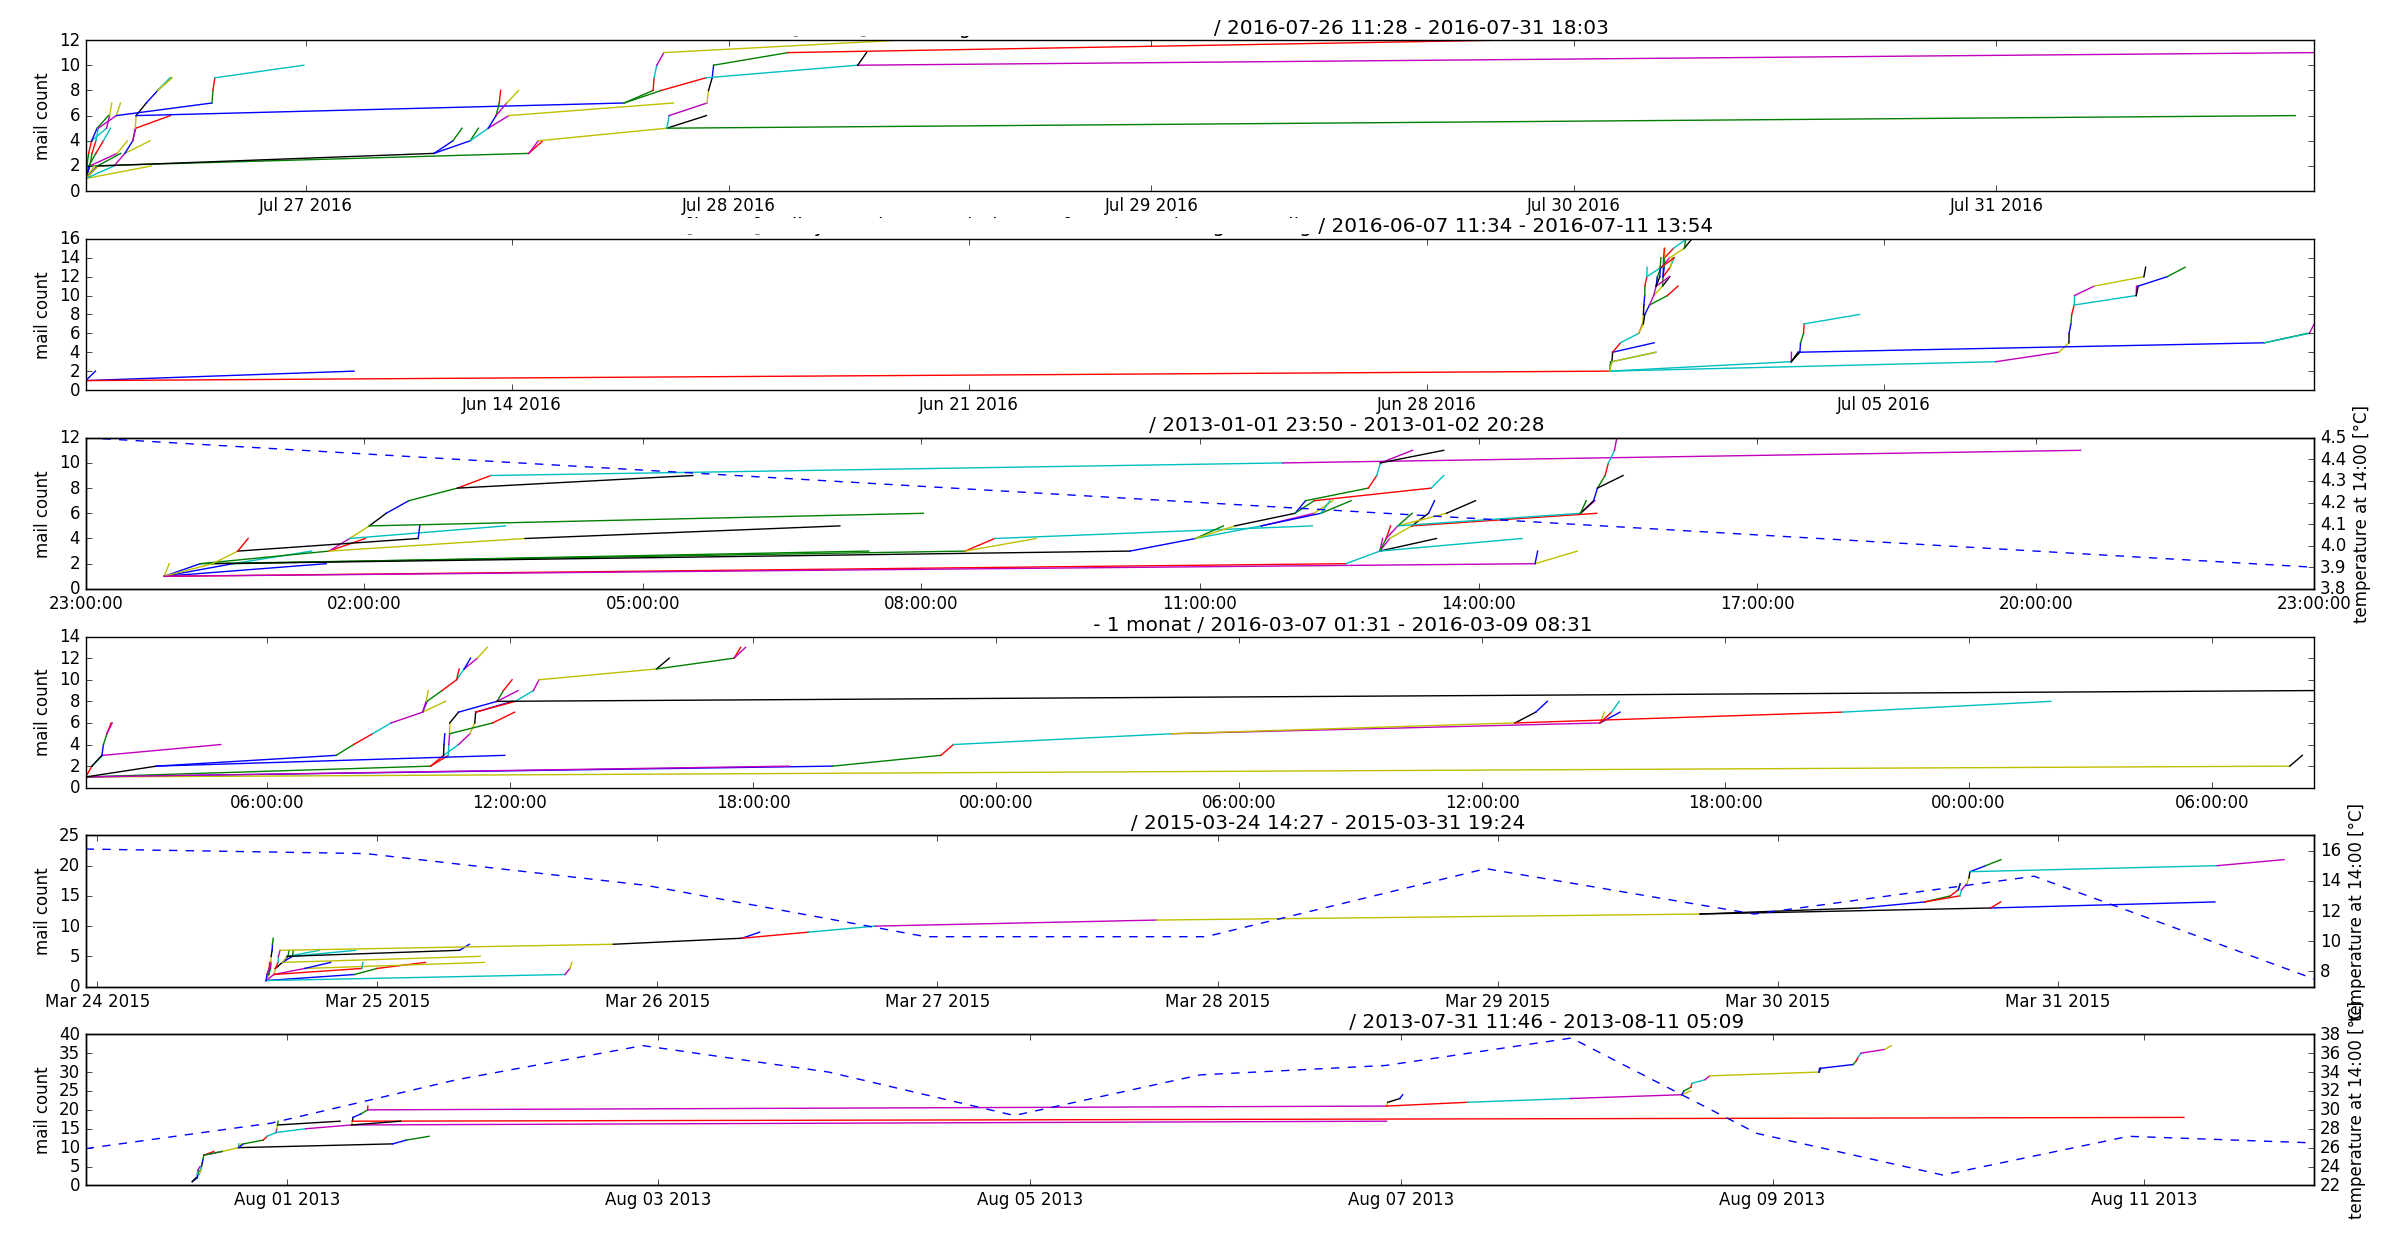
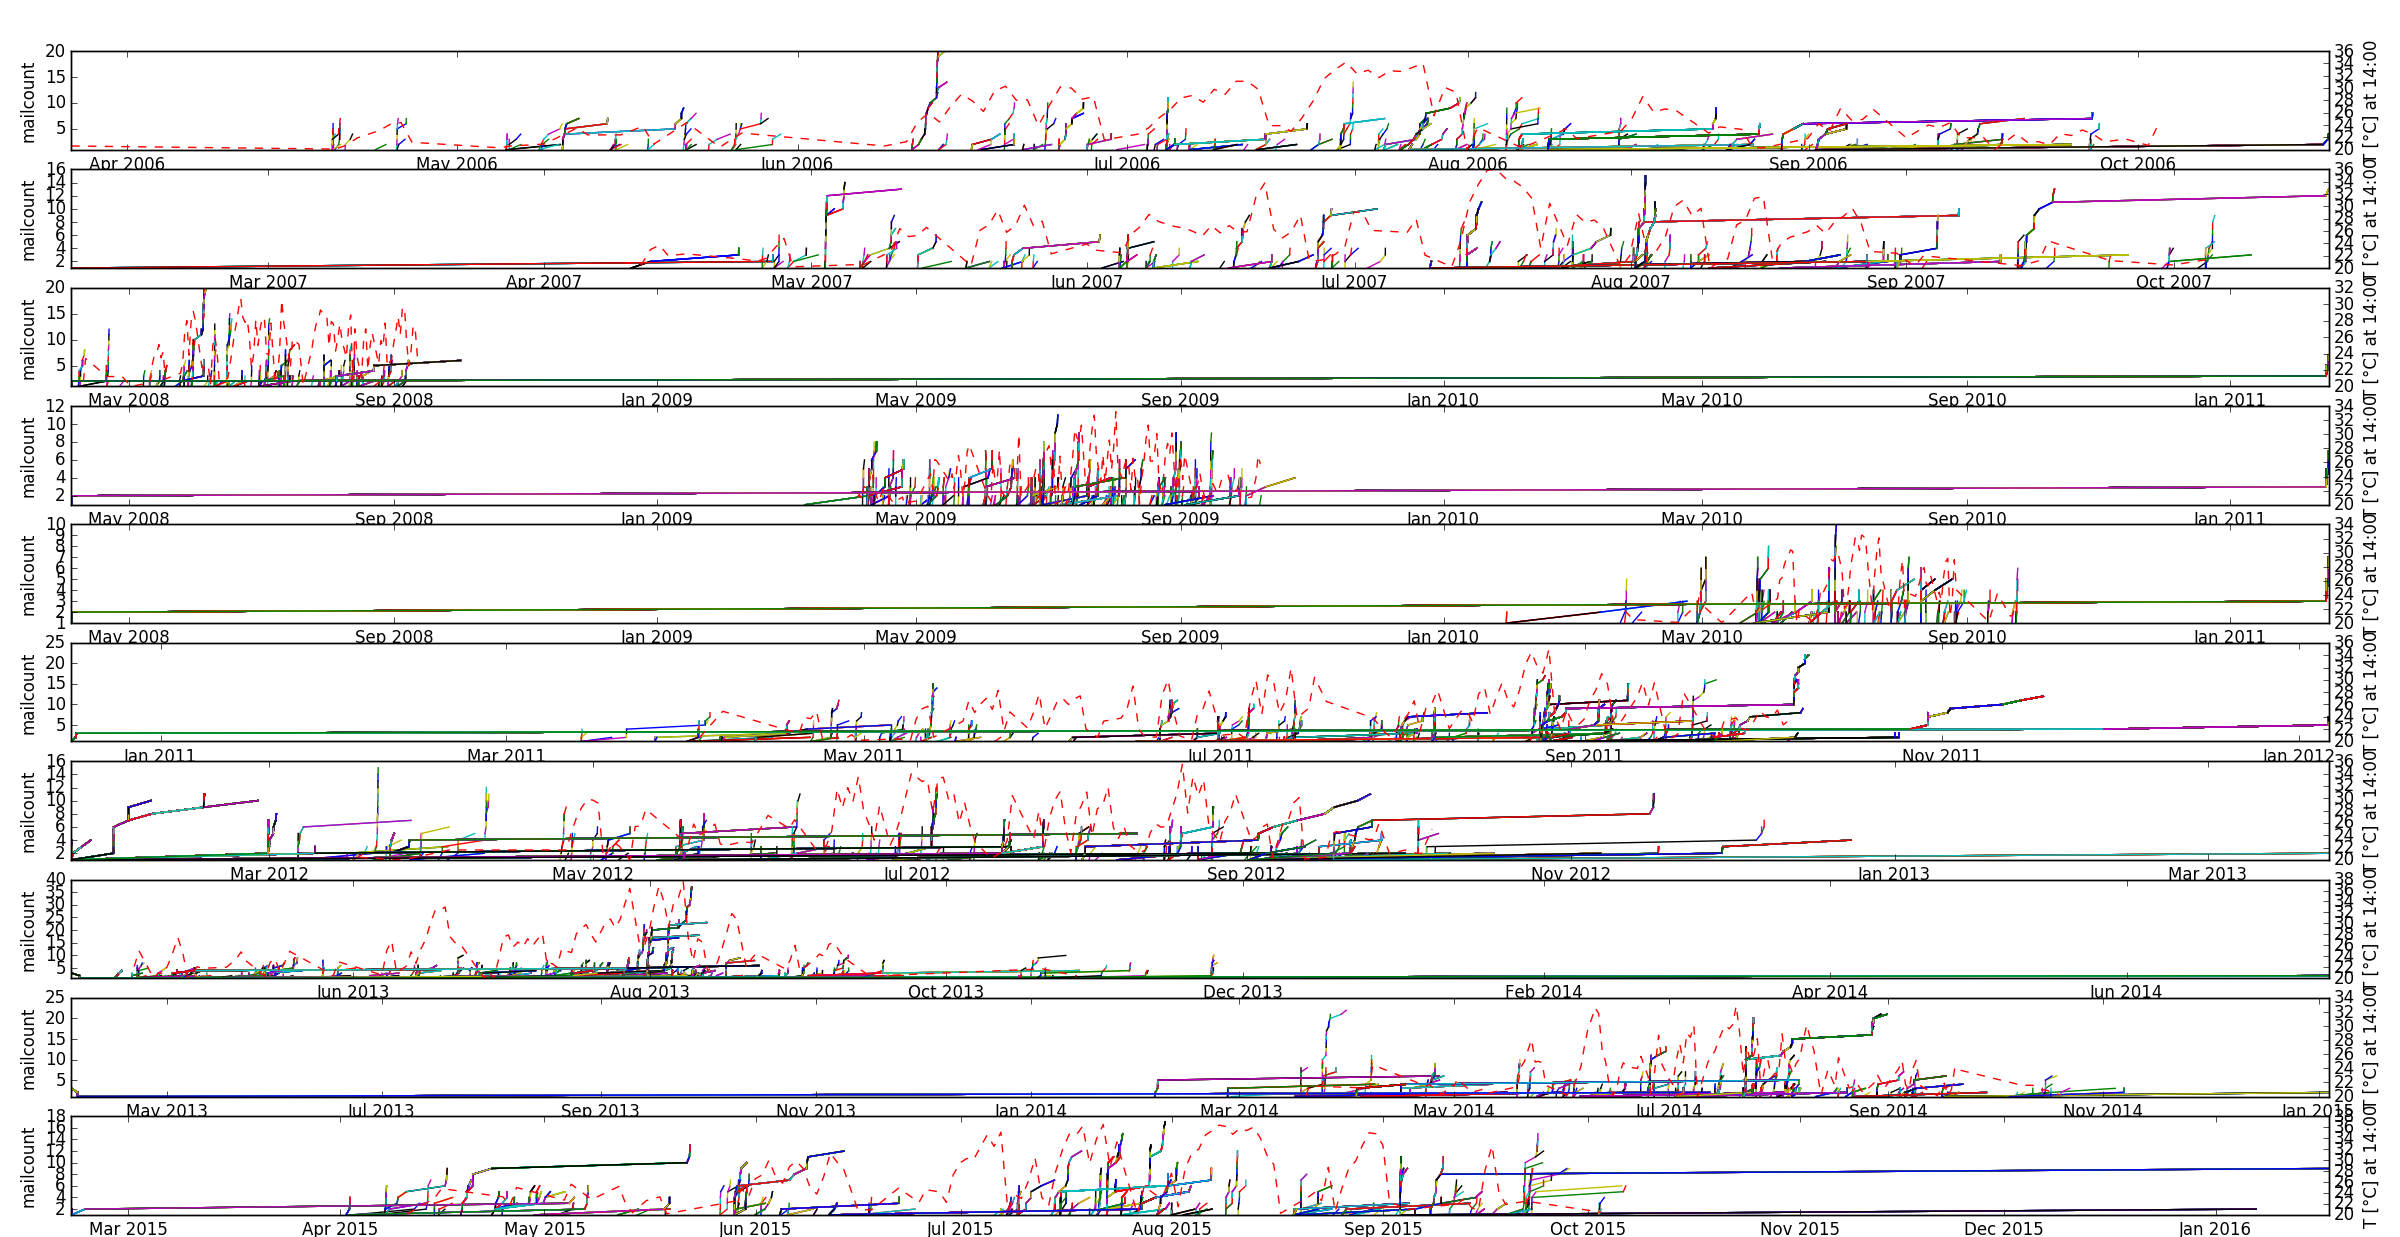
Plot thread structure and temperature graph for mailinglists. This is work-in-progress!
10 years of reading and participating in metalab's internal mailing list.
beautiful soup matplotlib/pyplot pandas pytz
create your config.cfg based on config.cfg.example download.py downloads the mailinglist and concats it into a single file
analyze.py creates the graph/s. please change the values according to your mailinglist.
Currently, only "ZAMG Jahrbuch" is supported. Get them at https://www.zamg.ac.at/cms/de/klima/klimauebersichten/jahrbuch (austria only)
MIT

