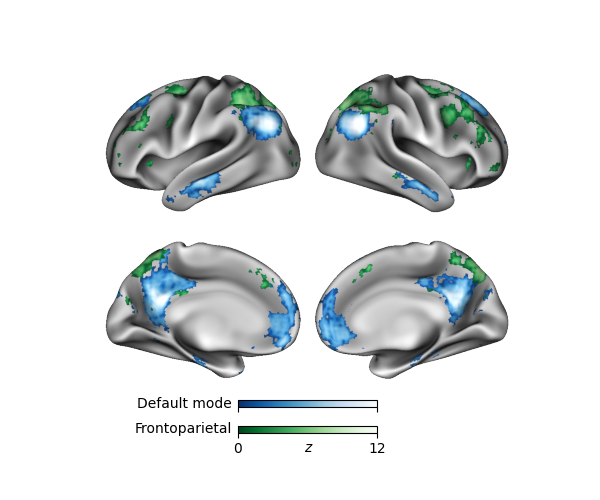
surfplot is a flexible and easy-to-use package that makes publication-ready brain surface plots. Users can easily set the plot views and layout, add multiple data layers, draw outlines, and further customize their figure directly using matplotlib.

Example Neurosynth association maps; see Example 1
At its core, surfplot is simply a high-level interface to Brainspace's excellent surface plotting and manipulation capabilities, which are built on top of Visualization Toolkit (VTK). Surfaces are rendered with Brainspace and then embedded into a matplotlib figure for easy integration with typical plotting workflows. A big thank you to the Brainspace developers for making this package possible.
surfplot is designed around common use-cases for surface plotting and popular surface plotting software (e.g., Connectome Workbench). surfplot also provides some additional utility functions to streamline the plotting process.
Follow the Installation Instructions to install surfplot, and then check out the Tutorials and Examples to learn how to get up and running! Refer to the API reference for complete documentation.
Please cite the following if you use surfplot:
Gale, Daniel J., Vos de Wael., Reinder, Benkarim, Oualid, & Bernhardt, Boris. (2021). Surfplot: Publication-ready brain surface figures (v0.1.0). Zenodo. https://doi.org/10.5281/zenodo.5567926
Vos de Wael R, Benkarim O, Paquola C, Lariviere S, Royer J, Tavakol S, Xu T, Hong S-J, Langs G, Valk S, Misic B, Milham M, Margulies D, Smallwood J, Bernhardt BC. 2020. BrainSpace: a toolbox for the analysis of macroscale gradients in neuroimaging and connectomics datasets. Communications Biology. 3:103. https://doi.org/10.1038/s42003-020-0794-7
This codebase is licensed under the 3-clause BSD license. The full license can be found in the LICENSE file in the surfplot distribution.
If you encounter problems or bugs with surfplot, or have questions or improvement suggestions, please feel free to get in touch via the Github issues.