Working implementation of Perception Engines software that uses machine perception to generate abstract visuals representing categories. For background see my Perception Engines essay or my more recent paper Shared Visual Abstactions.
Images are generated by "renderers". These generally go into into the "renderer" subdirectory of the classpath and are loaded dynamically. They also generally have a simple numbered version scheme since it is handy to keep old versions around once you have output files that depend on them.
To see a renderer in action, we can run the "render_images" script.
python render_images.pyThis will run the default "lines1" renderer which draws colored lines on the canvas. With no arguments, the lines will be randomly generated and then saved to a templated file. Take note of the printed output file and open it up to see what was created.

A renderer is really just a python file that contains a render function:
# input: array of real vectors, length 8, each component normalized 0-1
def render(a, size):
The numpy array a is a variable list of length 8 vectors and size is
the dimensions of the output image in pixels. The renderer should
generate and return an image. Its very important for the output images
to be identical when size varies. Here are a bunch of different ways to
run render_images with more explicit arguments.
Provide the renderer, random seed, size, and size manually
python render_images.py \
  --renderer lines1 \
  --random-seed 3 \
  --size 600
Now that we are supplying a fixed random-seed, we can test if this matches when scaled
python render_images.py \
  --renderer lines1 \
  --random-seed 3 \
  --size 300
And should change when the random seed is changed
python render_images.py \
  --renderer lines1 \
  --random-seed 4 \
  --size 300
To draw fewer lines, change the length of the input array
python render_images.py \
  --renderer lines1 \
  --random-seed 4 \
  --length 10 \
  --size 300
The output file can be fixed and named with different file formats possible:
python render_images.py \
  --renderer lines1 \
  --random-seed 4 \
  --length 10 \
  --size 300 \
  --outfile outputs/test_length10.jpg
Templated output file names using variables are handy. SEQ will auto-increment when re-run. (run this one a few times to get different versions)
python render_images.py \
  --renderer lines1 \
  --length 10 \
  --size 300 \
  --outfile outputs/test_length10_%SEQ%.jpg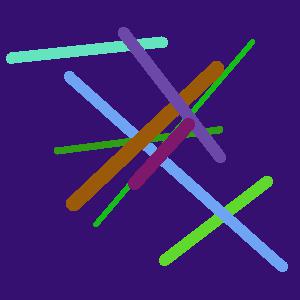


There is a separate scoring system currently based on keras pre-trained ImageNet Challenge models.
If you have an image, response graphs can be generated showing topN responses. By default a stock set of 6 ImageNet models will be used, and the output file will be graph_foo.
python score_images.py \
  --input-glob 'tick.jpg' \
  --target-class tick \
  --do-graphfile
Want to see more graphs? Try all keras imagenet models (currently 18):
python score_images.py \
  --input-glob 'tick.jpg' \
  --target-class tick \
  --networks all \
  --do-graphfile
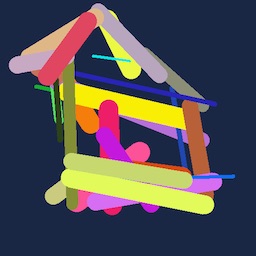
Let's get started by drawing a birdhouse.
python plan_image.py \
  --outdir outputs/birdhouse_1060 \
  --target-class birdhouse \
  --random-seed 1060 \
  --renderer lines1 \
  --num-lines 30
This optimizes a drawing to trigger a label of 'birdhouse' on a default set of four
ImageNet models. After several iterations, there will program will end and save a
parameter file best.npy in the output directory along with a preview called best.png.
You can run it a few times changing the outdir and random-seed to get different results.

When you get one you like, you can use the render_images.py script to redraw it at higher resolution.
python render_images.py \
  --input-glob 'outputs/birdhouse_1080/best.npy' \
  --outbase best_1920.jpg \
  --renderer lines1 \
  --size 1920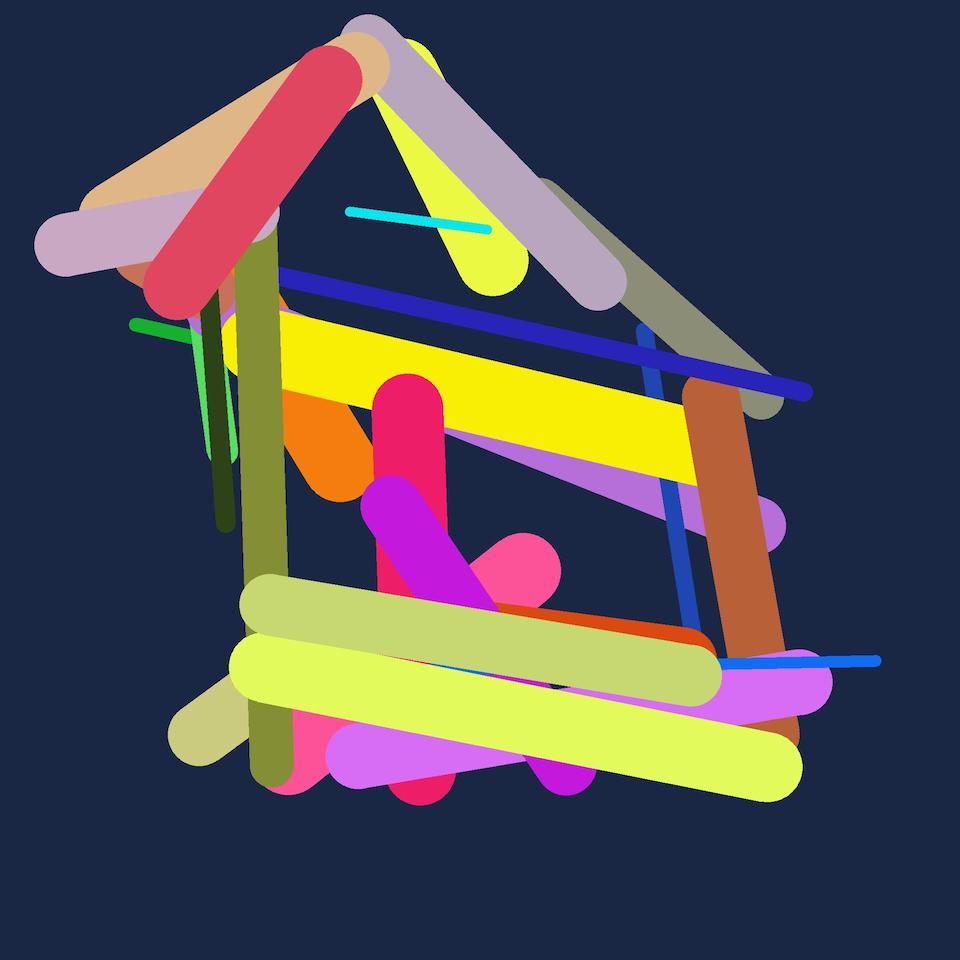
Here we use input-glob to provide the inputs (wildcards are allowed), and instead
of outfile we use outbase which saves the named file in the same directory location
as the input file.
How well does this result generalize to other networks? To test that we can run on all ImageNet networks. It's also helpful to highligh the four networks which were used in "training" this image, and that group has the nickname "train1".
python score_images.py \
  --input-glob 'outputs/birdhouse_1080/best_1920.jpg' \
  --train1 train1 \
  --target-class birdhouse \
  --networks all \
  --do-graphfile
Wow - this result generalizes really well to other network architectures. The first networks in yellow were used to make this image, but all of the other networks also give strong top1 results. But does this result also generalize to other training sets?
If you have google vision and aws credentials setup correctly you can additionaly test this image against their public APIs (and specify the target label). And here we also specify the graphfile-prefix explicitly which changes the output filename.
python score_images.py \
  --input-glob 'outputs/birdhouse_1080/best_1920.jpg' \
  --train1 train1 \
  --networks train1,aws:+birdhouse,goog:+birdhouse \
  --target-class birdhouse \
  --graphfile-prefix graph_apis_ \
  --do-graphfile
The google vision results seem to have nothing to do with birdhouses, just labels for things like illustration and clip art. The amazon rekognition results are also not showing an exact match for birdhouse, though reading the tea leaves we do see there are top5 results for building and the more specific label bird feeder - both of which seem like neighboring concepts.