With this package, users can infer a graph with two types of nodes: 1) for correlated responses (for example, microbial abundances) and 2) for predictors affecting the responses (for example, environmental or experimental conditions).
The advantages of our implementation is that:
- The edges in the graph correspond to conditional dependency (instead of marginal) which agree better with the biological intution behind experiments
- The graph is sparse
- Because the implementation is Bayesian, users can incorporate prior knowledge into the model
The package is on CRAN, so to install it, please use:
install.packages("CARlasso")To install development version from github:
devtools::install_github("YunyiShen/CAR-LASSO")Dependencies: The CAR-LASSO R package depends on the following R packages: Rcpp, RcppArmadillo, RcppProgress, coda, Matrix, igraph, ggraph, and ggplot2.
For more information, please check out the tutorial.
To run a reduced version of the analysis on human gut microbiome in our paper (with less predictors and responses):
library(CARlasso)
gut_res <- CARlasso(Alistipes+Bacteroides+
                        Eubacterium+Parabacteroides+all_others~
                        BMI+Age+Gender+Stratum,
                    data = mgp154,link = "logit",
                    adaptive = TRUE, n_iter = 5000,
                    n_burn_in = 1000, thin_by = 10)
# horseshoe will take a while, as it needs to sample the latent normal too
gut_res <- horseshoe(gut_res)
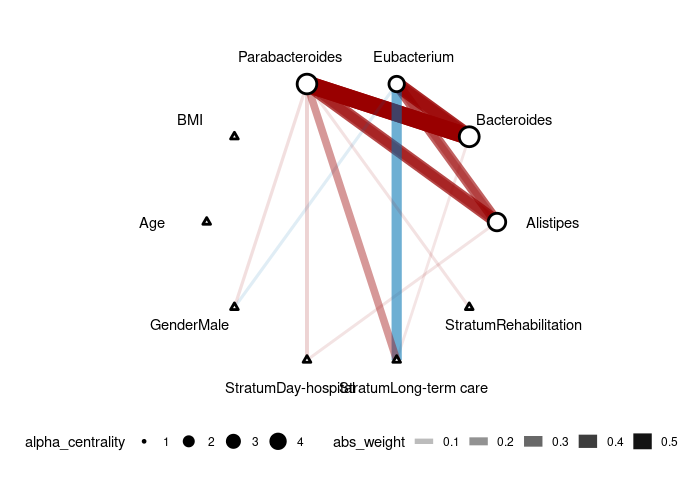
plot(gut_res)
It might take a little while due to the sampling process of the latent normal variable.
We are using the sample human gut microbiome data included in the package (mgp154).
If you want to run this model on your own data, check out the structure of mgp154 to put your data in the same format:
str(mgp154)
head(mgp154)
The color of the edge represents the type of correlation (negative=blue, positive=red) and the width of the edge corresponds to the effect size. Response nodes are represented by circles (in this case, microbes) and predictor nodes are represented by triangles (in this case, age, gender, and stratum).
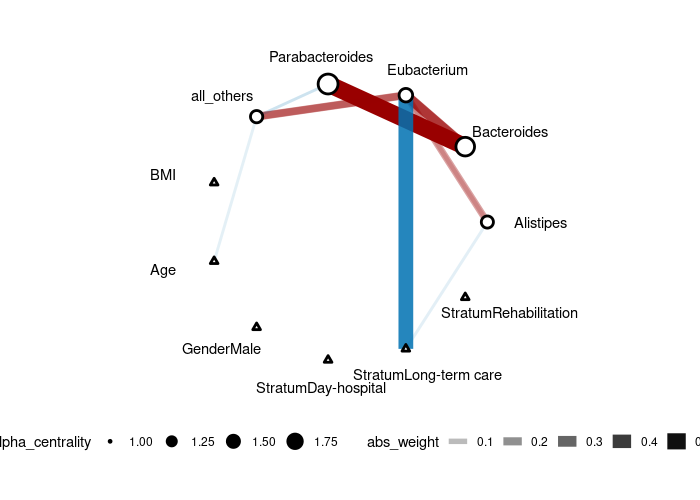
Though we don't recommend treating compositional data as counts, as a illustration, we can run the counting model (link = "log"):
gut_res <- CARlasso(Alistipes+Bacteroides+
                        Eubacterium+Parabacteroides+all_others~
                        BMI+Age+Gender+Stratum,
                    data = mgp154,link = "log",
                    adaptive = TRUE,
                    r_beta = 0.1, # default sometimes cause singularity in Poisson model due to exponential transformation, slightly change can fix it.
                    n_iter = 5000,
                    n_burn_in = 1000, thin_by = 10)
# horseshoe will take a while, as it's currently implemented in R rather than C++
gut_res <- horseshoe(gut_res)
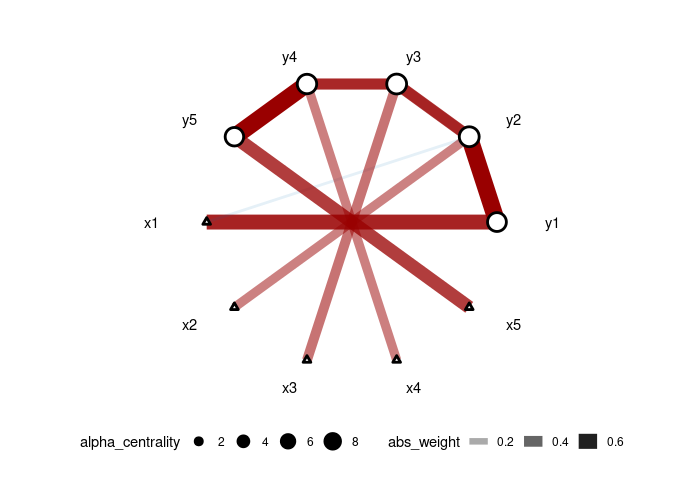
plot(gut_res)We generate data from a 5-node AR1 model where each node has a specific treatment. Then, we use the adaptive version of CAR-LASSO (CAR-ALASSO) to reconstruct such network and plot the result:
set.seed(42)
dt <- simu_AR1(n=100, k=5, rho=0.7)
car_res <- CARlasso(y1+y2+y3+y4+y5~x1+x2+x3+x4+x5, data = dt, adaptive = TRUE)
plot(car_res,tol = 0.05)
# with horseshoe inference
car_res <- horseshoe(car_res)
plot(car_res)Our package also includes functions to fit a standard graphical LASSO, see this page in the tutorial for more details.
If you would like lower level interface of CAR-LASSO, see this page in the tutorial.
Users interested in expanding functionalities in CAR-LASSO R package are welcome to do so. See details on how to contribute in CONTRIBUTING.md.
CAR-LASSO R package is licensed under the GNU General Public License v3.0 license.
If you use the CAR-LASSO R package in your work, we kindly ask that you cite the following paper:
Shen, Y., Solís-Lemus, C. (2020). Bayesian Conditional Auto-Regressive LASSO Models to Learn Sparse Networks with Predictors, arXiv:2012.08397
@article{Shen2020,
  title         = "Bayesian Conditional {Auto-Regressive} {LASSO} Models to
                   Learn Sparse Networks with Predictors",
  author        = "Shen, Yunyi and Solis-Lemus, Claudia",
  month         =  dec,
  year          =  2020,
  archivePrefix = "arXiv",
  primaryClass  = "stat.AP",
  eprint        = "2012.08397"
}
Feedback, issues and questions are encouraged through the GitHub issue tracker.


