This extension makes it easy to inspect data with just a few clicks.
Please leave a ⭐ as motivation if this tool is helpful for you!
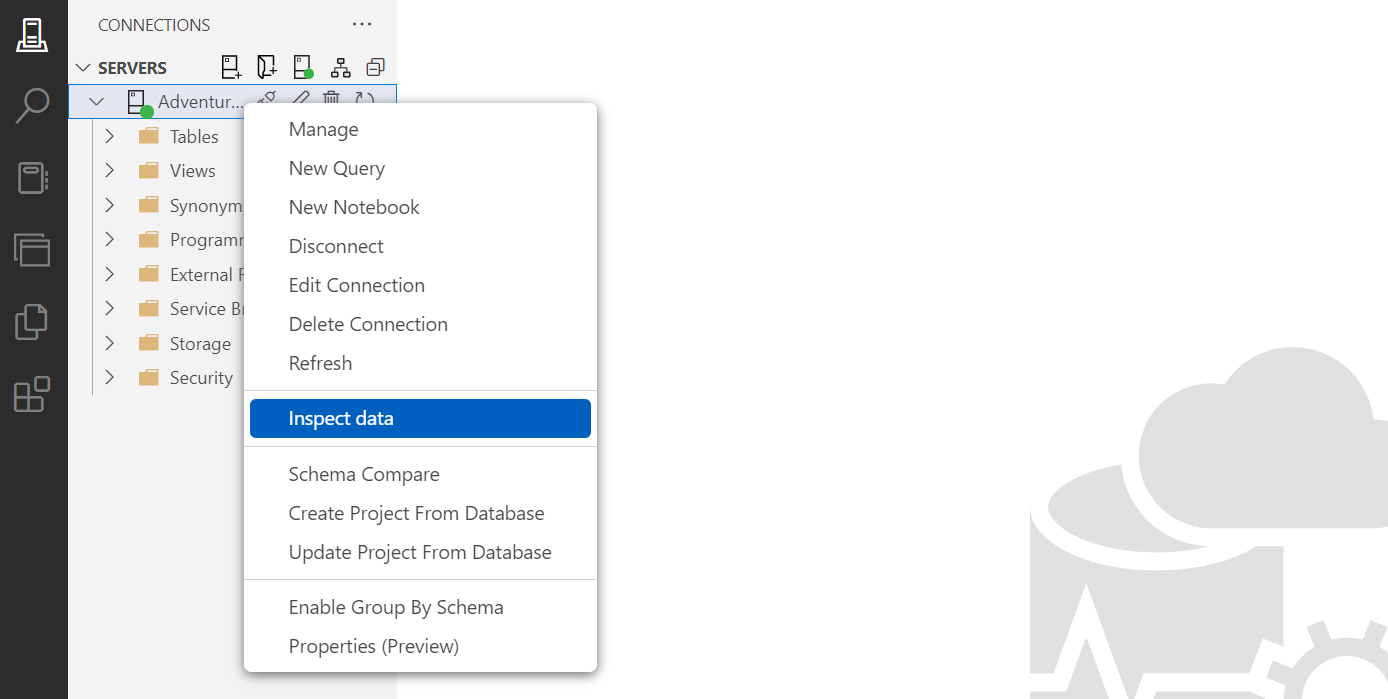
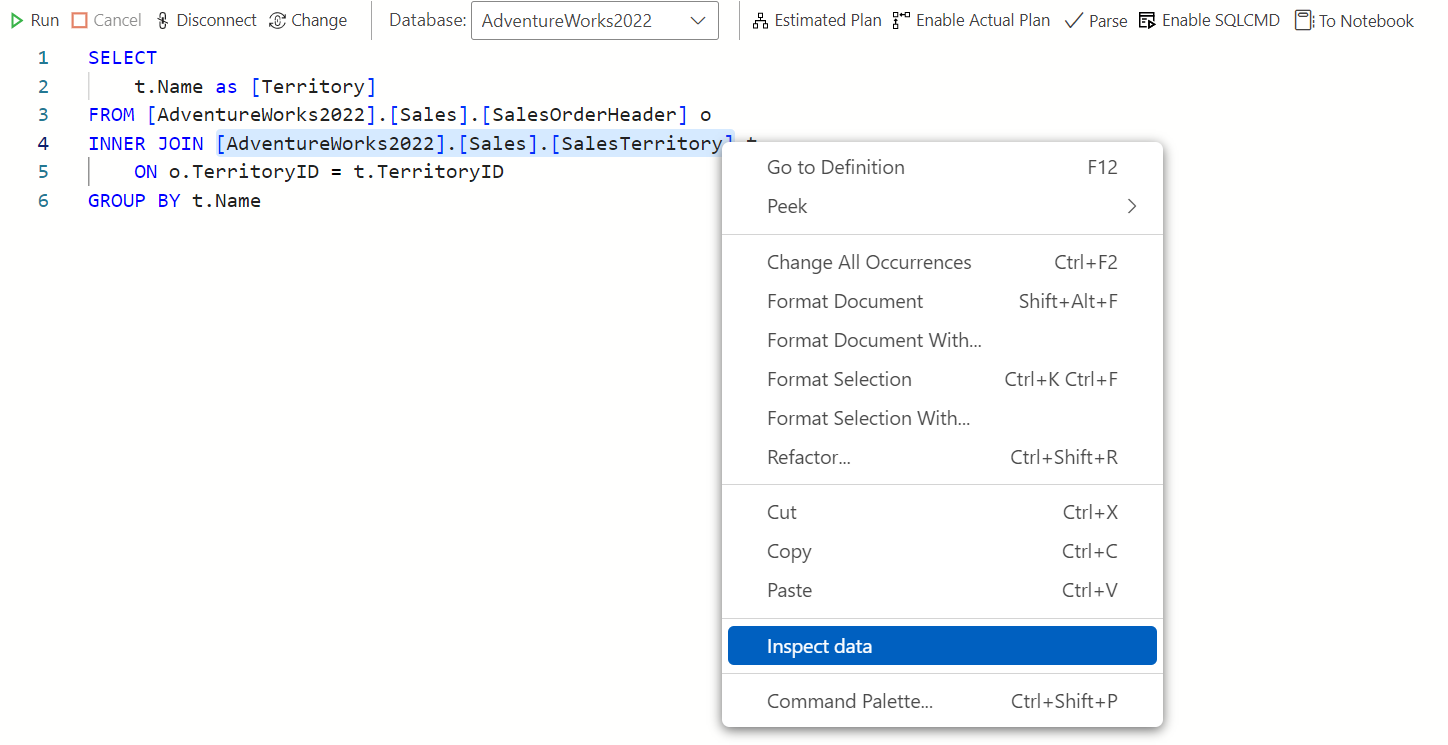
- Start inspecting data from the server explorer or from the query editor.
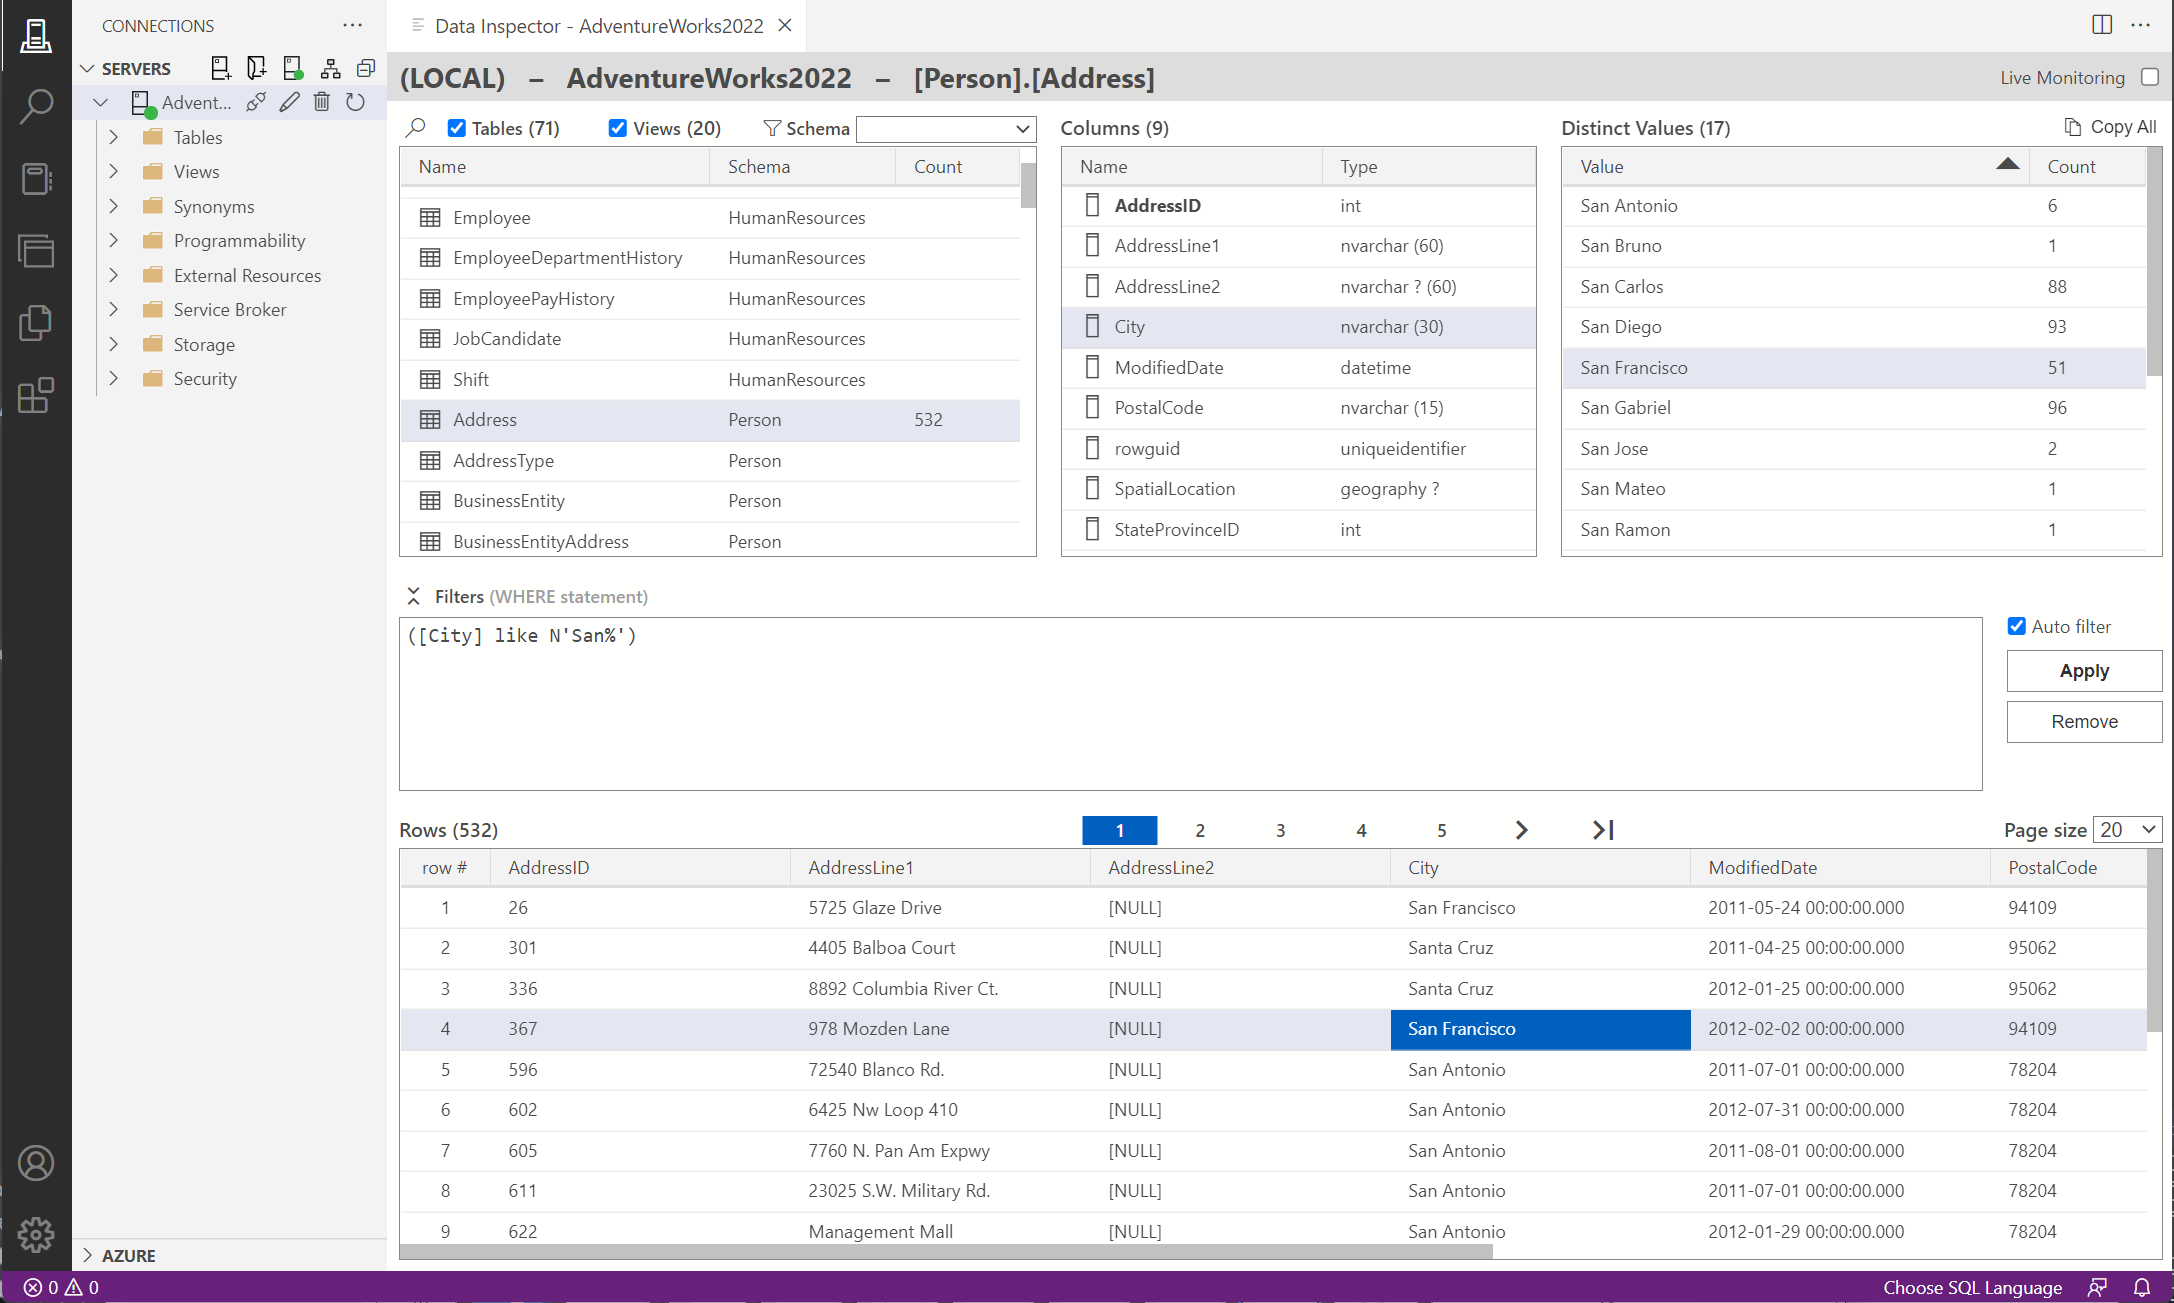
- Shows the list of tables and views of the database.
- Shows the list of columns of the selected table or view.
- Shows all the distinct values of the selected column and their counts.
- Shows the rows of the selected table or view.
- You can filter objects by name and schema.
- You can edit the WHERE clause that will be applied to each query that retrieves data.
- By double clicking on a distinct value, a filter on that value is automatically added in the "Filters" section.
- By double clicking on a row in the table snapshot, a dialog is shown with all the record details.
- Live monitoring mode for periodically refreshing the views.
- Each selectable element can be copied with CTRL+C.
- All distinct values and counts for a column, can be copied in the clipboard. You can then paste the values in Excel for further analysis, for instance.
- Support for Microsoft SQL Server.
- Support for MySQL by installing the extension
Microsoft.azuredatastudio-mysql. - Support for PostgresSQL by installing the extension
Microsoft.azuredatastudio-postgresql.
- Navigate in the server explorer to the database node you want to inspect.
- Right-click on the database node.
- Click on the menu item "Inspect data".
- Select the text that corresponds to the table name or the full qualified table name.
- Right-click on the selected text.
- Click on the menu item "Inspect data".
- The inspector will be opened and it will show immediately tha data of the selected table.
This extension has the some custom settings that let the user to customize the extension behaviour:
- Order columns alphabetically in the columns and the data inspector views.
- Shows primary key columns first in the columns and the data inspector views.
- Default refresh interval in seconds for the live monitoring view.
- The number of rows to show in the data inspector view.
- Show tables in the objects list.
- Show views in the objects list.
The current release will be available through the Extensions Marketplace in Azure Data Studio.
Current and Pre-releases will be available from the Releases tab of the projects repository. Simply download the VSIX of the release you want, and use the Install Extension from VSIX Package option in Azure Data Studio.
See the Change Log for the full changes.
If you find a bug or have an idea to improve this extension please create a new issue in this project.
You are more than welcome to help contribute to this project if you wish, please create a new fork of the main branch, then submit a pull request to the main branch after making your changes.
This project is released under the MIT License


