This project contains a set of python scripts to create and visualize a list of co-occurrences from the output of a UIMA pipeline.
A directory of XMI files containing the following annotations:
- Scope: The scope of the co-occurrences. Ex: Sentence
- Item: The co-occurrences are created from this type of annotations. Ex: Country
- [optional] Event: If specified only scopes containing this annotation will be used to generate the co-occurrences.
The exact UIMA type names can be configured.
- Co-occurrences csv files
- Local web Graph report
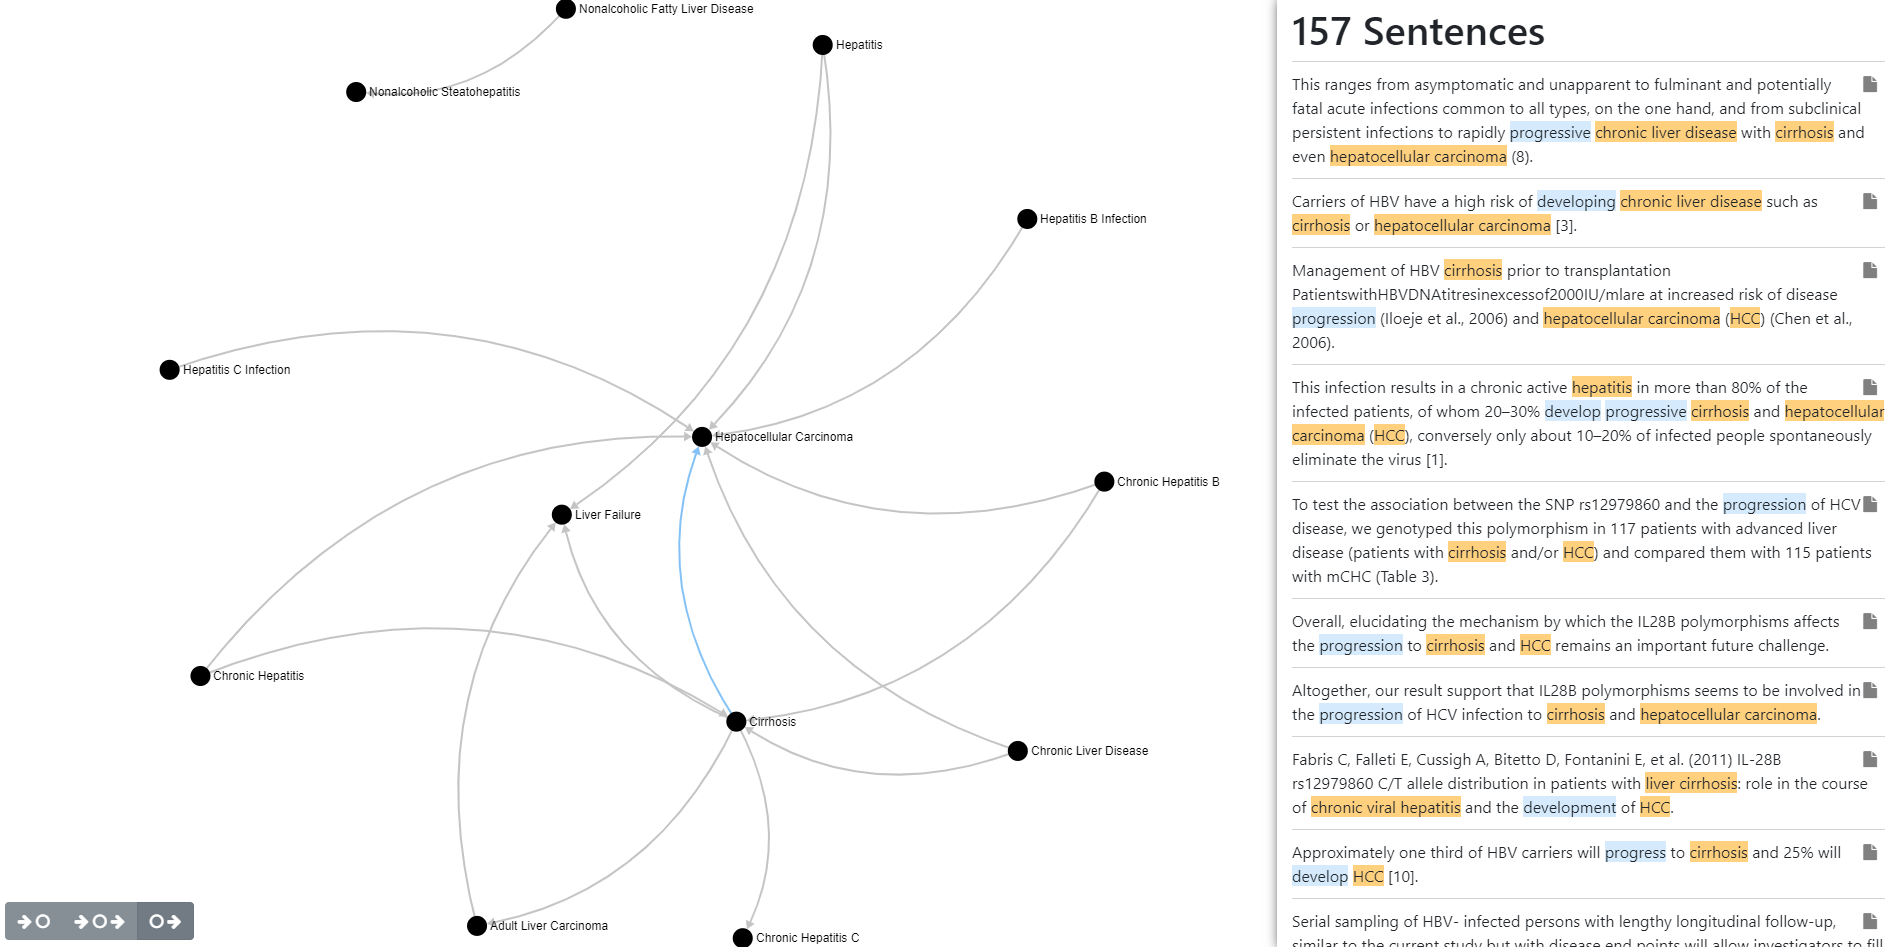
- HTML report displaying the relationship between the co-occurrences and the list of sentences with annotations for a selected relationship.
- Python > 3
- intervaltree>=2.0.0
- tqdm>=4.0.0
- networkx>=1.0
- pandas>=0.20.0
If you're looking to generate similar anntoations, you can use the generic pipeline with your own list of terms.
Update the arguments in 'arguments.py' to suite your environment and annotations.
Usual arguments to update:
- xmi_dir: directory containing the XMI files)
- scope_annotation
- sub_annotations
python 01_extract_scopes_with_subannotations.py
To decouple the process from uima, this step generate for each XMI file a json file containing a list of scopes with their subannotations.
output in 'scopes' directory
Example of a scope file:
[
    {
        "type": "scope",
        "properties": {
            "id": 134,
            "sofa": 12,
            "begin": 3761,
            "end": 3980
        },
        "sub": [
            {
                "type": "item",
                "properties": {
                    "id": 188459,
                    "sofa": 12,
                    "begin": 49,
                    "end": 68,
                    "value": "Chronic Hepatitis B"
                }
            },
            {
                "type": "item",
                "properties": {
                    "id": 188469,
                    "sofa": 12,
                    "begin": 110,
                    "end": 119,
                    "value": "Hepatitis"
                }
            }
        ],
        "text": "Eight patients with acute \r\nand 41 patients with chronic hepatitis B, 16 patients with \r\nchronic non-A, non-B hepatitis, and ten patients with \r\nprimary sclerosing cholangitis (PSC) were studied as dis- \r\nease controls."
    },
    <...>
]python 02_build_cooccurrences.py
Loop through each scope of each document and generate co-occurrences for each pair of inner annotations (item).
Generate:
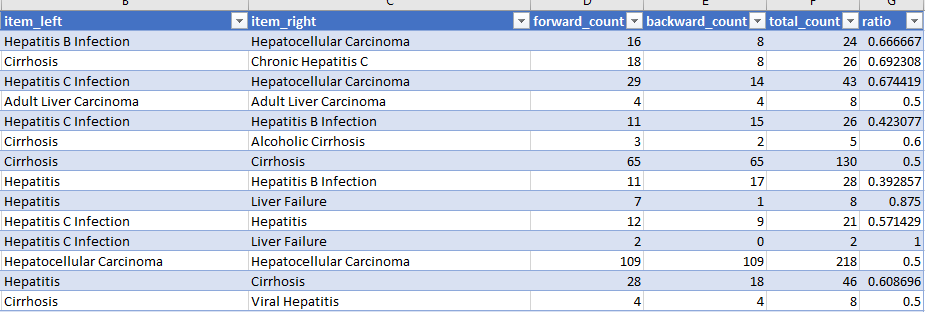
- output/cooccurrences.csv
- item_left, item_right, forward_count, backward_count, total_count, ratio
- output/cooccurrences.scope_ids.pkl
- dictionary of cooccurence map to a list of (doc-id, scope-id) in which the appear
Notes:
- If event is specified, only scope containing the event will be selected
- If a property specified value of it otherwise normalized covered-text
python 03_filter_cooccurrences.py
This steps selects the co-occurrences we want to see in the web report.
File generated:
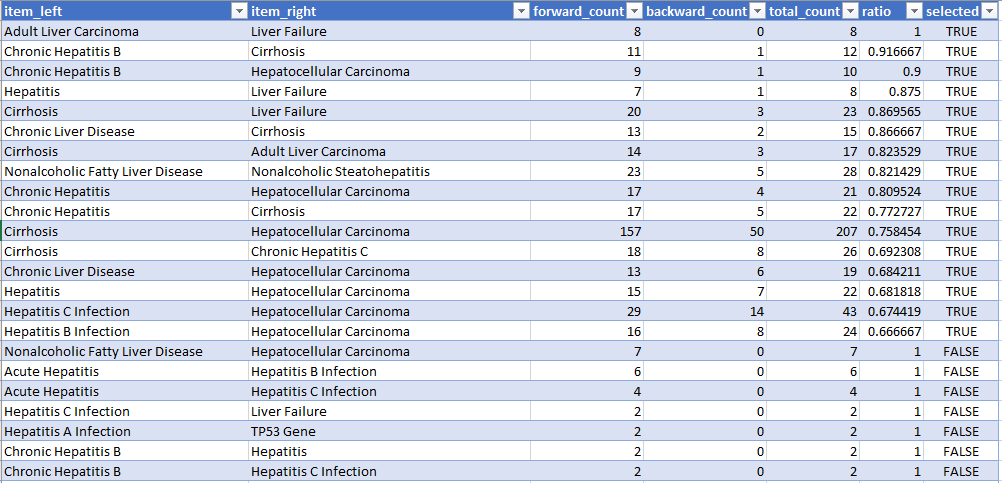
- cooccurrences.selected.csv
It create exactly the same csv file as in the previous step but with an additional column: 'selected'.
The selection process is as follows and the arguments can be changed in arguments.py.
- Filter out co-occurrences where both items are identical
- Filter out based on ratio.
- Filter out based on total count.
You can also select manually the co-occurrences you want to appear in the report.
python 04_create_graph.py
Read the selected co-occurrences and generate the report.
- output/graph/graph.html
In order to generate the list of sentences with annotations, the script will open all the json 'scope' files in which the selected co-occurrences appears.
To view the report, just open the file in your web browser. You need to have internet access. Some of the javascript libraries are referenced using a CDN.
python 04_update_graph_node_pos.py
If you're unhappy with the layout of the nodes, you can run this script, it will only update the position of the nodes without re-generating the data to display the sentences with annotations which can be quite slow.