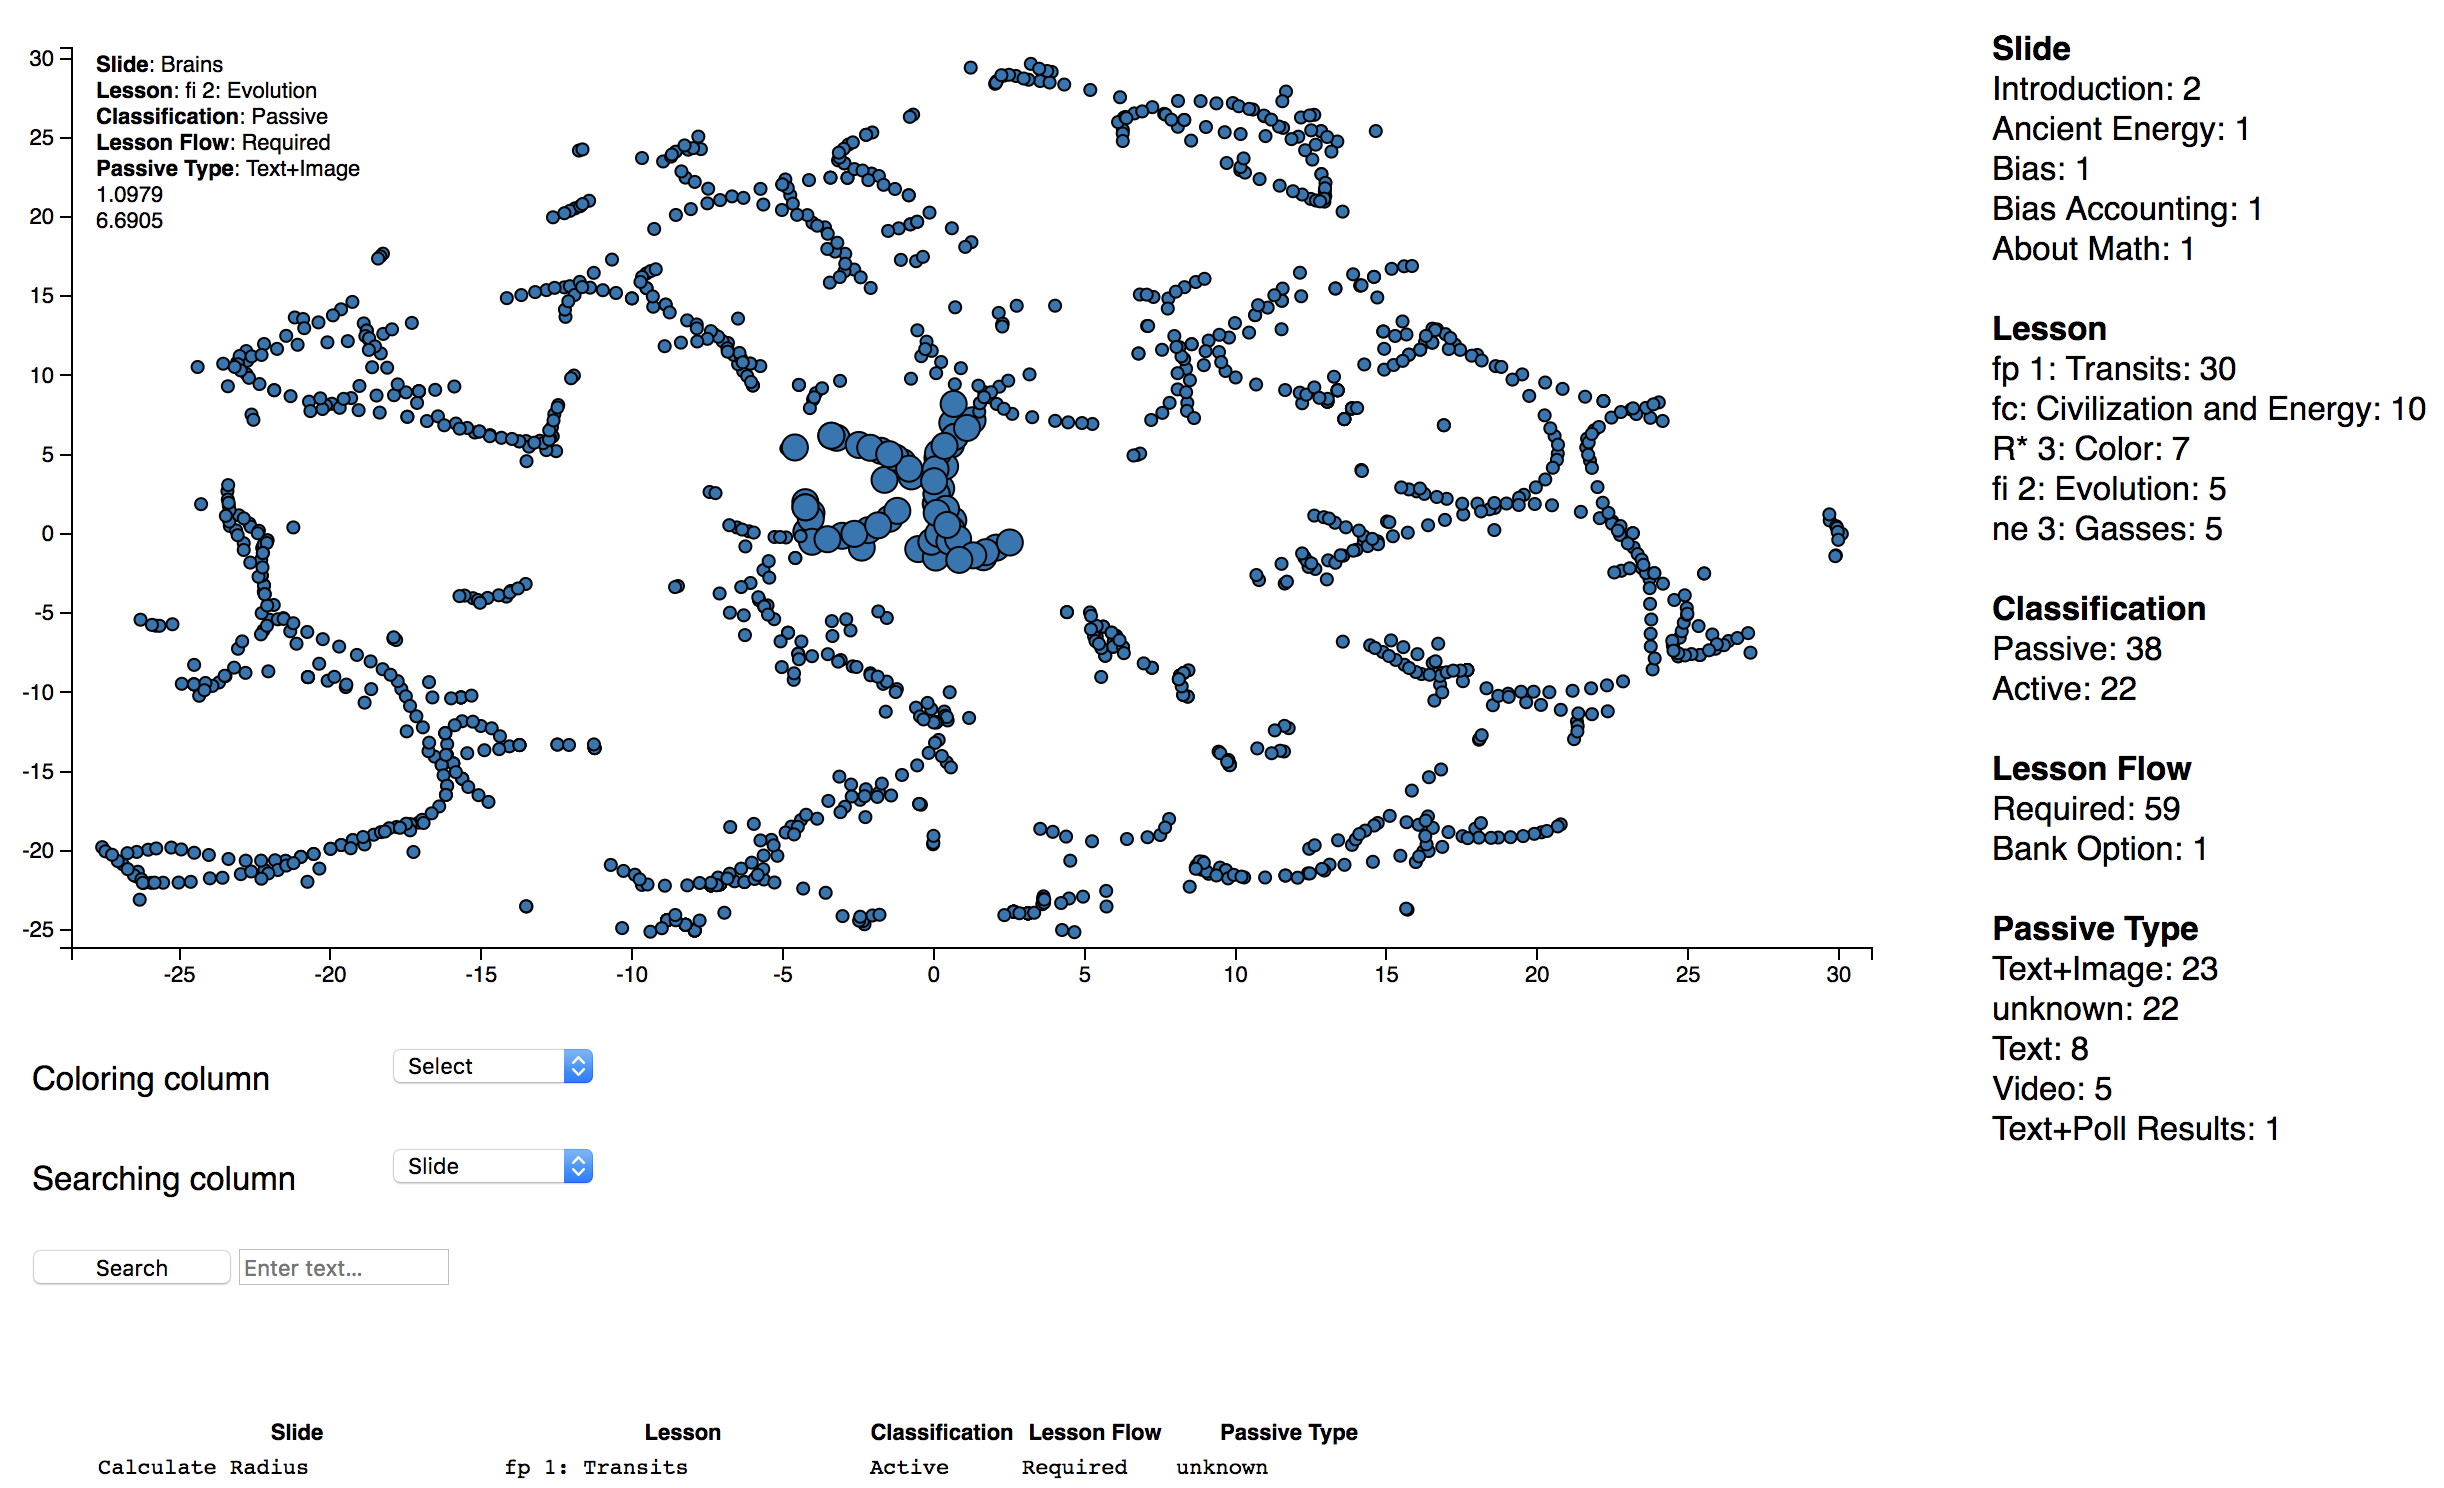
Interactive Scatterplot Visualization of TSNE data using D3.js and Crossfilter.js
- Easy and fast solution to get information about each point in a scatter plot.
- Ability to filter the data by text search and to highlight specific attributes that you are interested in by a drop-down list.
You can try it out at https://gao-xian-peh.github.io/Interactive-Scatterplot/plot.html?data=joined_data.csv
Here is how it looks like:
