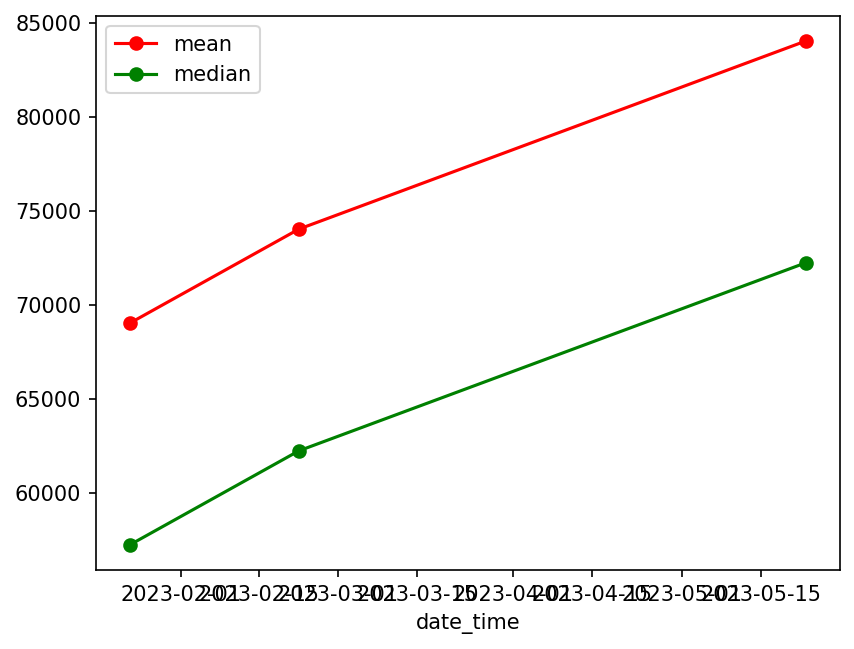
The program will print the average views of the last n videos of the channel, and also it will draw a graph with the trend of views over time.
yt-scraper is a Command Line Interface (CLI) tool that allows you to calculate the average views of the last n videos of a YouTube channel. It uses the YouTube API to extract the data from the channel and then performs the calculations using the Python library Pandas. The program also allows you to visualize the trend of views over time with a graph.
- Get the project
- just clone the project
git clone https://github.com/gioisco/yt-scraper.git
or - download the zip file
- just clone the project
- Install the dependencies
pip install -r requirements.txt
- Run
read.py - Insert the channel URL
- Insert the number of videos you want
$ python src/read.py
__   _______   ____                                      _                _
\ \ / /_   _| / ___|  ___ _ __ __ _ _ __   ___ _ __     / \   _ __   __ _| |_   _ _______ _ __
 \ V /  | |   \___ \ / __| '__/ _` | '_ \ / _ \ '__|   / _ \ | '_ \ / _` | | | | |_  / _ \ '__|
  | |   | |    ___) | (__| | | (_| | |_) |  __/ |     / ___ \| | | | (_| | | |_| |/ /  __/ |
  |_|   |_|   |____/ \___|_|  \__,_| .__/ \___|_|    /_/   \_\_| |_|\__,_|_|\__, /___\___|_|
                                   |_|                                      |___/

Insert channel URL: https://www.youtube.com/@Computerphile
How many videos do you want? 5

Searching 5 videos for https://www.youtube.com/@Computerphile
                   date_time     video_id  view_count                                              title
0 2023-01-23 11:11:16.092257  flWqmB4UaBA       32117  MDE under the Hood (Model Driven Engineering) ...
1 2023-01-23 11:11:16.092257  dMYgY5FhO3M       74227  What do Computer Scientists Read? - Computerphile
2 2023-01-23 11:11:16.092257  rjYUeh3tlpc       50077       Malware and Machine Learning - Computerphile
3 2023-01-23 11:11:16.092257  m6l3Elk7-Hg       99785                          Emulation - Computerphile
4 2023-01-23 11:11:16.092257  c32zXYAK7CI       57255  Garbage Collection (Mark & Sweep) - Computerphile
After collect data during the time, you can run calculate.py
$ python src/calculate.py
Enter the number of videos to use for mean calculation: 3


- Selection dataframe -
                    date_time     video_id  view_count                                              title
2  2023-01-23 11:11:16.092257  rjYUeh3tlpc       50077       Malware and Machine Learning - Computerphile
3  2023-01-23 11:11:16.092257  m6l3Elk7-Hg       99785                          Emulation - Computerphile
4  2023-01-23 11:11:16.092257  c32zXYAK7CI       57255  Garbage Collection (Mark & Sweep) - Computerphile
7  2023-02-22 11:13:18.517523  rjYUeh3tlpc       55078       Malware and Machine Learning - Computerphile
8  2023-02-22 11:13:18.517523  m6l3Elk7-Hg      104785                          Emulation - Computerphile
9  2023-02-22 11:13:18.517523  c32zXYAK7CI       62255  Garbage Collection (Mark & Sweep) - Computerphile
17 2023-05-23 11:13:58.582227  rjYUeh3tlpc       65078       Malware and Machine Learning - Computerphile
18 2023-05-23 11:13:58.582227  m6l3Elk7-Hg      114799                          Emulation - Computerphile
19 2023-05-23 11:13:58.582227  c32zXYAK7CI       72255  Garbage Collection (Mark & Sweep) - Computerphile

- Calculating mean -
    date_time     mean
0  2023-01-23  69039.0
1  2023-02-22  74039.0
2  2023-05-23  84044.0

- Calculating median -
    date_time   median
0  2023-01-23  57255.0
1  2023-02-22  62255.0
2  2023-05-23  72255.0

- Result -
               mean   median
date_time
2023-01-23  69039.0  57255.0
2023-02-22  74039.0  62255.0
2023-05-23  84044.0  72255.0
Warning: Ignoring XDG_SESSION_TYPE=wayland on Gnome. Use QT_QPA_PLATFORM=wayland to run on Wayland anyway.
Saved mean_median_views.png
The complete list is avalilable on (requirements.txt)
In summary, this project use:
- youtube scraper scrapetube
- datafrapa pandas
- drawer plot matplotlib
- render plot PyQt5
- ascii art font pyfiglet
