go get github.com/gree-gorey/geoip-exporter
GeoIP exporter collects metrics about TCP-connections,
locates remote IP-address and exposes metrics to Prometheus
via /metrics endpoint.
Changed https://freegeoip.net/ to https://freegeoip.live/. Please be aware that API has a limit of 10K requests per hour
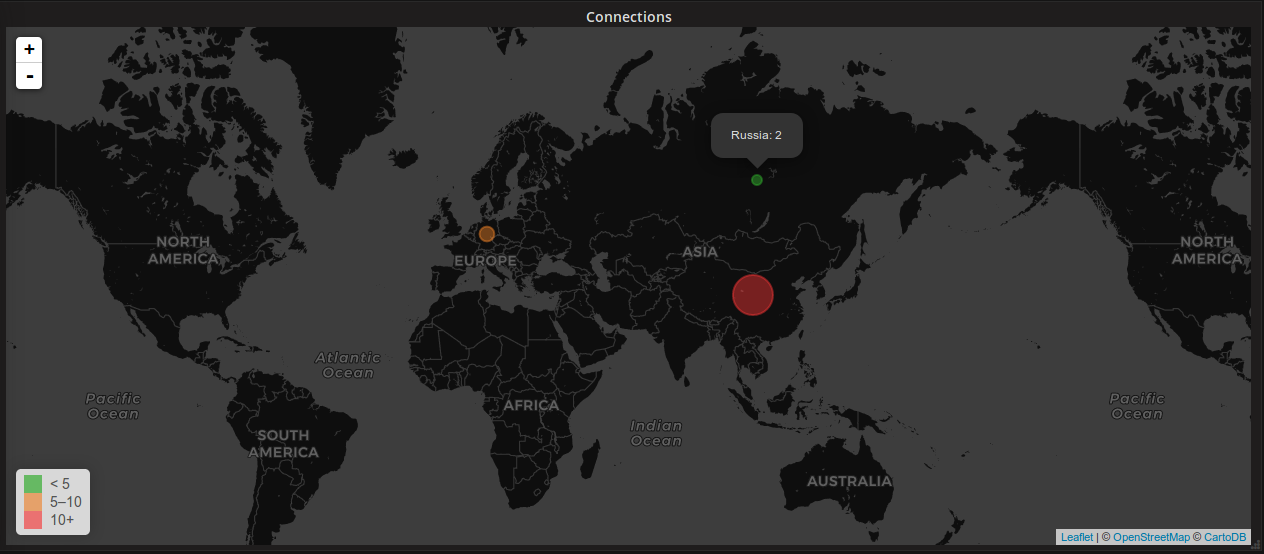
Example visualization using Grafana:
Available command-line options:
Usage of ./geoip-exporter:
  -blacklist string
    	Addresses blacklist to filter out from results
  -debug
    	Debug log level
  -interval int
    	Interval fo metrics collection in seconds (default 180)
  -web.listen-address string
    	Address on which to expose metrics (default ":9300")
Example usage:
$ ./geoip-exporter --interval=10 --web.listen-address=127.0.0.1:9400 \
--blacklist="8.8.8.8,4.4.4.4" --debugExample usage:
$ docker run -p 9300:9300 greegorey/geoip-exporter:0.2.0Download latest release:
$ cd /tmp
$ curl -s https://api.github.com/repos/gree-gorey/geoip-exporter/releases/latest \
| grep "browser_download_url" \
| cut -d : -f 2,3 \
| tr -d \" \
| wget -qi - -O geoip-exporter
$ chmod +x geoip-exporter
$ mv geoip-exporter /usr/local/bin
Create service:
# cat << GEO > /etc/systemd/system/geoip-exporter.service
[Unit]
Description=Geo IP exporter for Prometheus
Wants=network-online.target
After=network-online.target

[Service]
Type=simple
Restart=Always
ExecStart=/usr/local/bin/geoip-exporter --interval=300 --web.listen-address=127.0.0.1:9300 --blacklist="104.31.10.172,104.31.11.172"

[Install]
WantedBy=multi-user.target
GEO
# systemctl enable geoip-exporter.service
# systemctl start geoip-exporter.service
Check that the service is running and send the responce:
$ netstat -plnt | grep 9300
tcp        0      0 127.0.0.1:9300        0.0.0.0:*               LISTEN      2156/geoip-exporter
$ curl -s 127.0.0.1:9300/metrics | grep ^job_location
job_location{location="US"} 1Change Prometheus configuration file and add the following lines:
  - job_name: 'GeoIPExporter'
    scrape_interval: 10s
    static_configs:
      - targets: ['127.0.0.1:9300']
Then reload Proetheus:
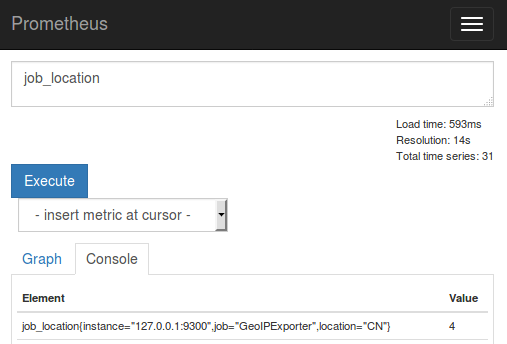
# pgrep "^prometheus$" | xargs -i kill -HUP {}Go to Prometheus UI and check that it collects metrics:
Then you need to install Worldmap Panel plugin for Grafana:
# grafana-cli plugins install grafana-worldmap-panelGo to Grafana UI and add new panel (add panel -> Worldmap Panel).
Go to the Metrics tab and add query:
sum(job_location) by (location)
Legend format:
{{location}}
Mark checkpoint Instant.
Your setting should look like this:
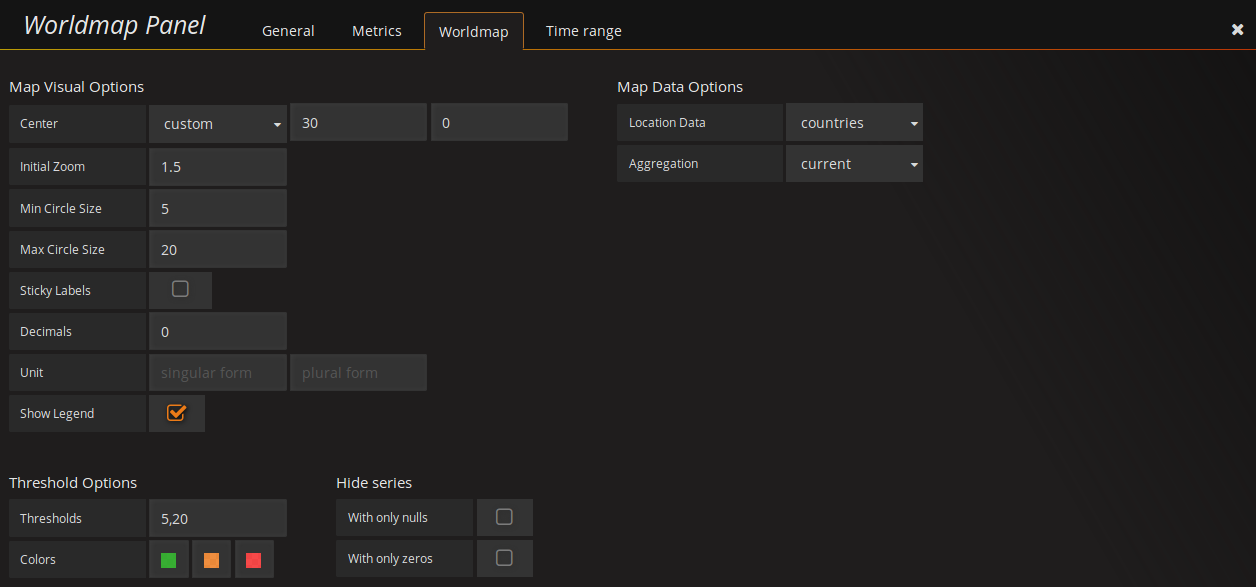
Then go to the Worldmap tab and set up it as this:
From this point on your worldmap panel is ready.
- Add command-line flags
- Add filter for IP addresses (blacklist)
- Docker image


