Due on Feb 12, 2017
The goal of this project is to get you familiar with common classifiers and how to compare and contrast different classifiers. You will learn how to implement two supervised classifiers, to use Fisher projection on your data, and evaluate their performance on real data.
You will be working on three different datasets (all datasets are included in the starter code).
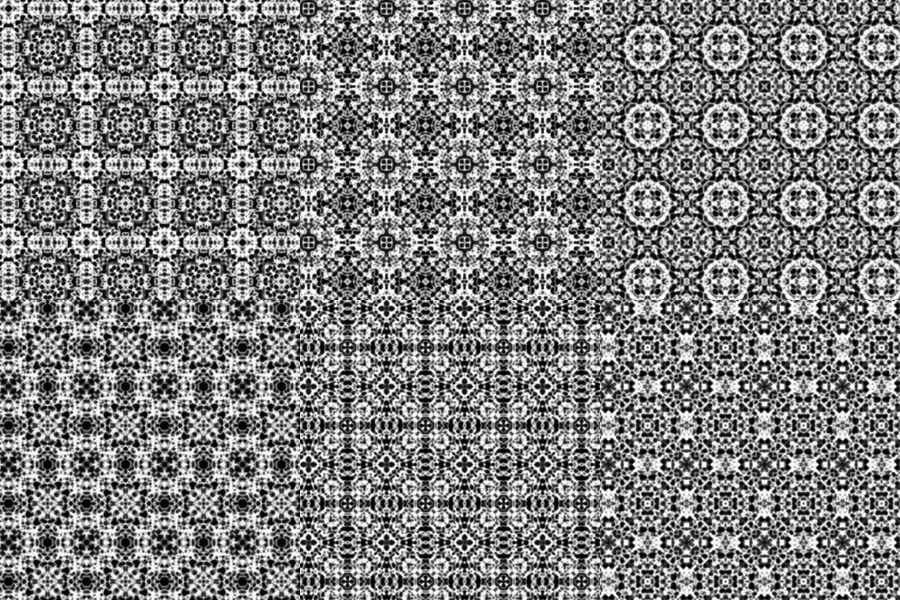
WINE (http://archive.ics.uci.edu/ml/datasets/Wine) dataset. Wallpaper Group Dataset - This dataset consists of the features extracted from images containing the 17 Wallpaper Groups. These features have already been extracted for you. Here is an example of multiple patterns from one such group (specifically P4M):
Taiji Pose Dataset - This is a dataset of the joint angles (in quaternions) of 35 sequences from 4 people performing Taiji in our motion capture lab. You will classify which MoCAP frames are transitional frames 7 different poses (non '0' labels) and the non-transitional frames (the '0' labels). Here is a sample video of one of the performances: link to the video We are only using up to 1:30 in the video
The functions you must implement are:
A function to train a linear discriminate using least squares for classification (Bishop 4.1.1 - 4.1.3). You must write a function which takes the training features and labels from the dataset and returns the linear discriminant functions for a 'one-vs-one' or a 'one-vs-all' scheme. You should be familiar with least squares after the first project. You may use the multiclass classification from Bishop 4.1.2: Eq. 4.9 and the condition below that equation. A function that takes your linear discriminant functions (from the previous function) and a set of features to test and returns class labels found with your classifier features. A function to find the Fisher projection using the training features and labels (Bishop 4.1.4 and 4.1.6) and also train a classifier to the Fisher projected training data. The classifier can be a KNN classifier (Bishop 2.5.2) or from Decision Theory (end of Bishop 4.1.4) using an optimum threshold. This function returns the Fisher projection coefficients and the corresponding fitted classifier necessary for the testing function. A function which takes the output of the previous function (the Fisher projection and the classifier) and a set of features to test and returns the class labels of the features found by your classifier. You must quantitatively evaluate BOTH of the classification methods above using the THREE datasets given. Like project 1, you must implement the two classifiers and the Fisher projection yourself. You may not use the Matlab built-in methods for least squares, classification, or the Fisher projection functions.
Your report must include:
Equations that define your linear classification and Fisher projection and your estimated model parameters. Train your model using the training data and report your classification results on BOTH the training and testing data. This must include classification and confusion matrices. Analyze your results in the report. The report should not be merely a stack of figure and tables, but also words to explain the meaningful observations behind the numbers. For example, you must compare the classification results on training and testing data, do you observe an overfitting problem? Do you observe any outliers in the data? If so, describe how do they affect the classification results and point out the outliers within your results. If not, display the data set to illustrate this point.
Choose samples from any two classes a dataset and show that, for the two-class problem, Fisher criterion is a special case of least squares (Bishop 4.1.5) -- 5pts.
