Monitoring with Prometheus and Grafana
First launch the monitoring job to start Prometheus and Grafana:
$ nomad run ./nomad_job_files/monitoring.hcl

==> Monitoring evaluation "7d9c46df"
    Evaluation triggered by job "faas-monitoring"
    Allocation "e20ace08" created: node "123e18c0", group "faas-monitoring"
    Evaluation status changed: "pending" -> "complete"
==> Evaluation "7d9c46df" finished with status "complete"
This job starts a single instance of Prometheus and Grafana on the Nomad cluster.
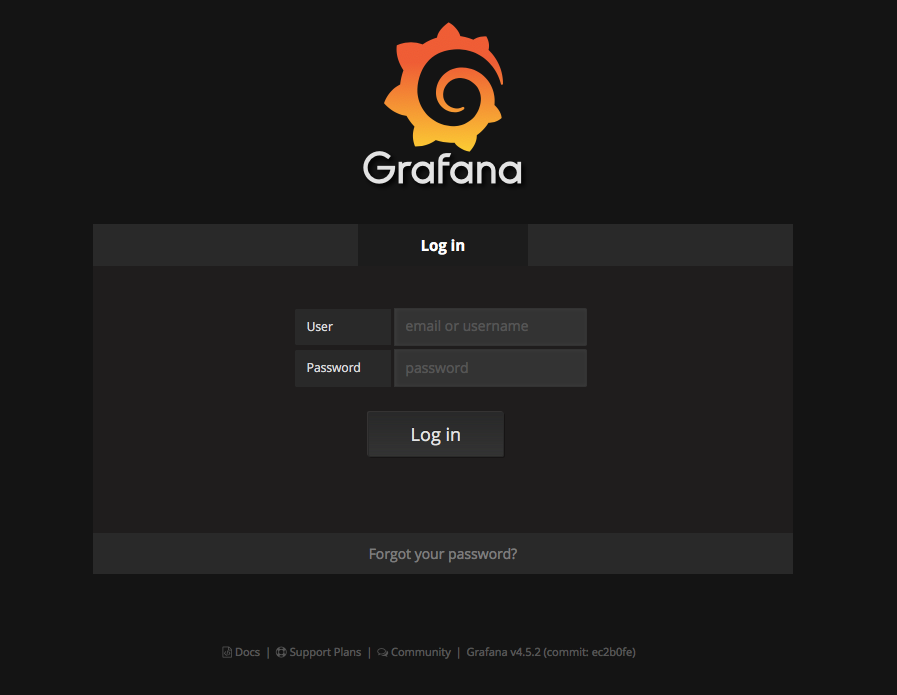
If you are not using the provided Terraform module, you will need to locate the node which Grafana is running on, assuming you have not changed the job file the port will be 3000.
To log into Grafana use the default username and password admin.
Once you have successfully logged in, the next step is to create a data source for the Prometheus server.
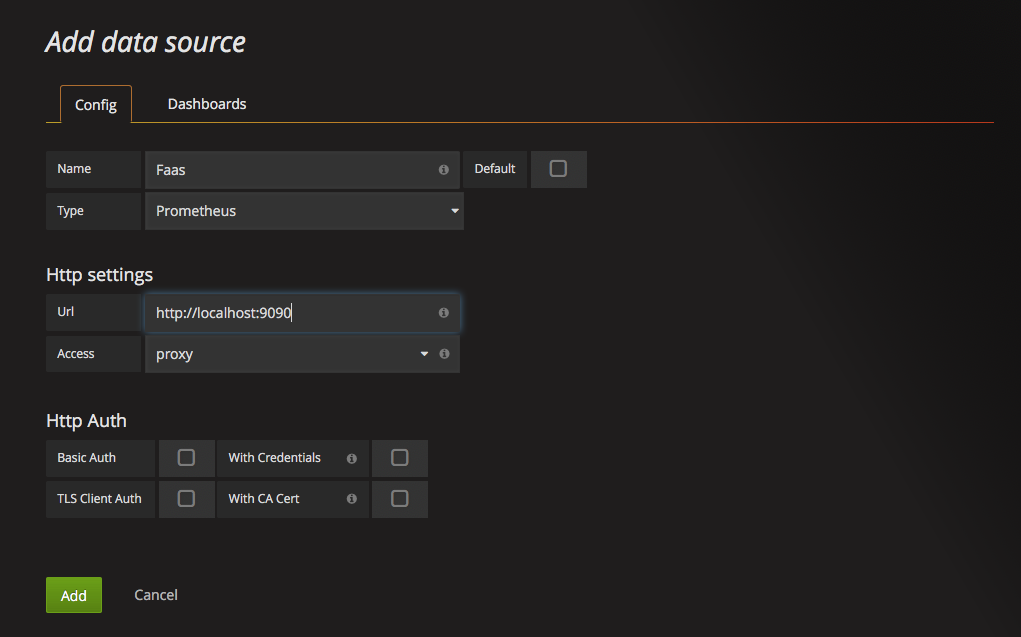
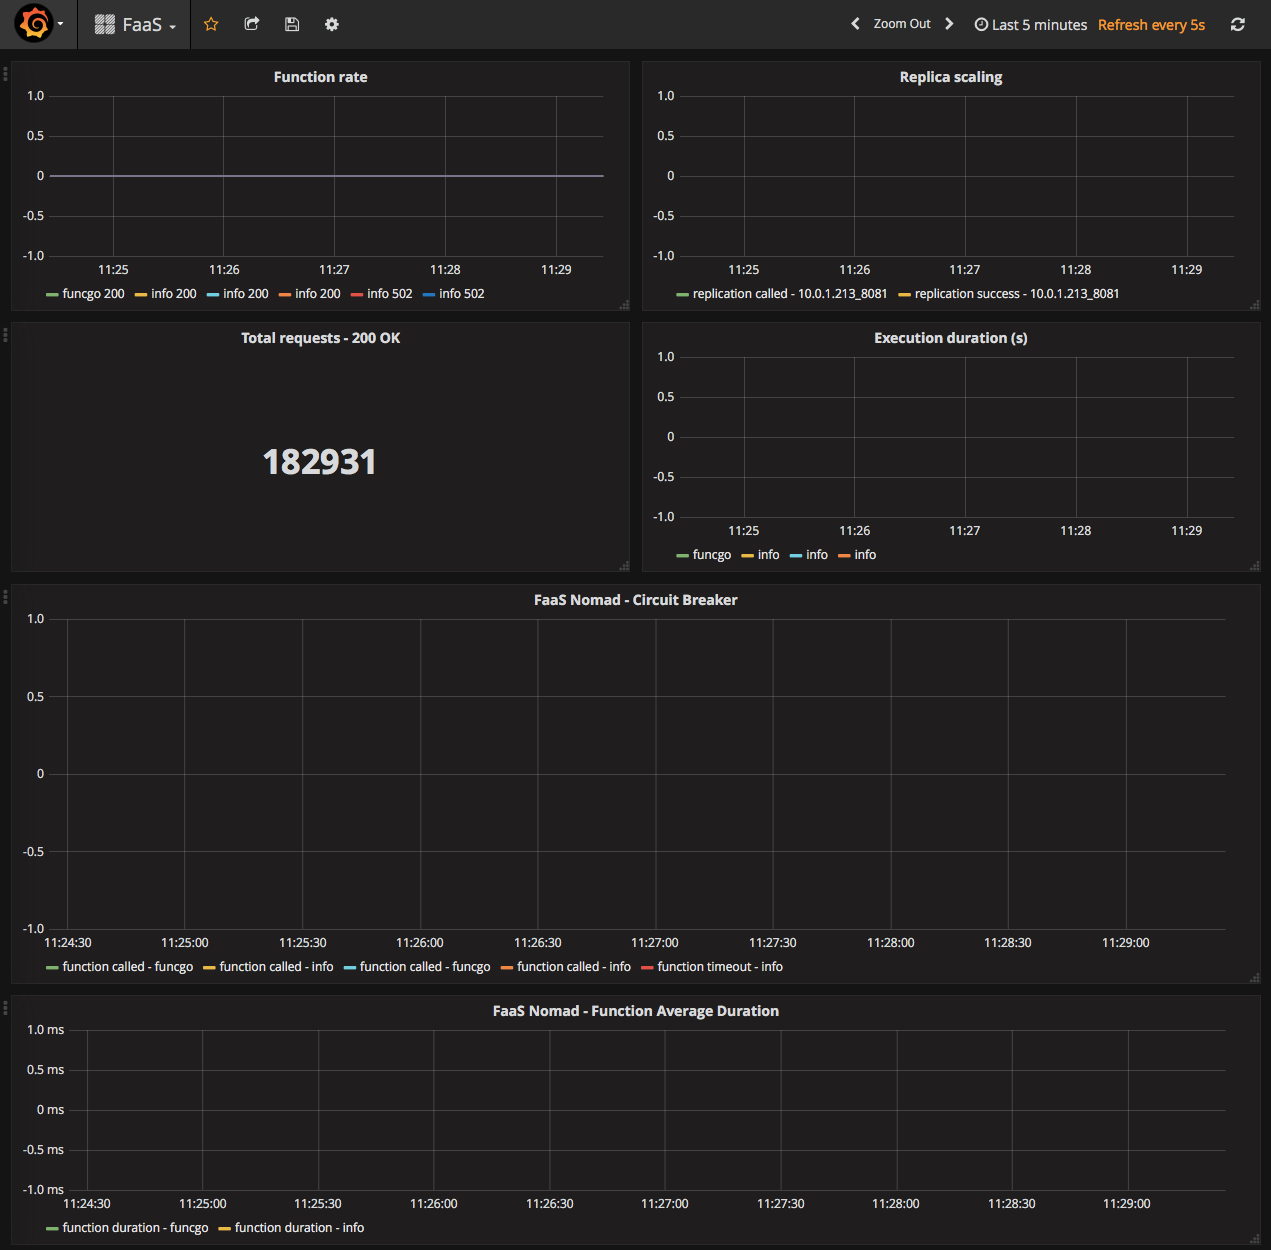
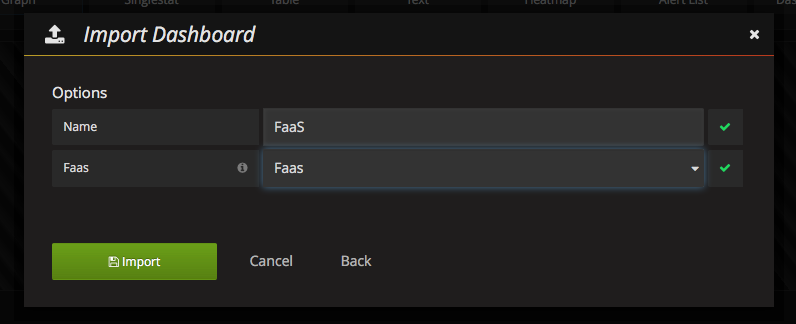
Configure the options as shown ensuring that the URL points to the location of your Prometheus server. The next step is to add a dashboard to view the data from the OpenFaaS gateway and provider. A simple dash can be found at grafana\faas-dashboard.json, let’s add this to Grafana. Clicking the Import button from the Dashboards menu will pop up a box like the one below. Choose the file for the example dashboard and press import.
Assuming all went well, you should now see the dashboard in Grafana: