-
Notifications
You must be signed in to change notification settings - Fork 2.5k
New issue
Have a question about this project? Sign up for a free GitHub account to open an issue and contact its maintainers and the community.
By clicking “Sign up for GitHub”, you agree to our terms of service and privacy statement. We’ll occasionally send you account related emails.
Already on GitHub? Sign in to your account
Toggle Spectrogram Preview for Audio #384
Comments
|
@Path-A Thank you for your issue. Are you familiar with React? |
|
@makseq Unfortunately not, although I've been wanting to learn. |
|
For future reference, I think the challenge here is more of understanding the multicanvas code of wavesurfer. |
|
@feddybear Wow! It's very impressive! Do you have an account on our slack? https://label-studio.slack.com/ |
Hi @makseq yeah I also mentioned this on one of the spectrogram inquiries there. But I'm leaving it to someone more capable, especially in reading the wavesurfer multicanvas codes. Hopefully it's also someone who knows signal processing, as the older implementation of drawing spectrogram on wavesurfer had some really weird canvas settings that didn't make sense (e.g. height of the spectrogram). |
|
@feddybear Let's move to slack. I know DSP, also we'll include our frontend team there. |
|
@feddybear please, tag me again (@makseq). I can't find my mention there. |
|
I'm also seeking for similar feature, any progress so far? |
|
@Tom-Lu I hope we will make this work to the end. |
|
Would be also very interested in this feature, as it is currently hard to select regions for audio with low SNR |
|
Has there been any progress regarding development of this feature? |
|
Only if @feddybear has any news. |
|
Sorry, I have yet to integrate the spectrogram-related edits from the previous version to the latest one. Also, kinda occupied with other stuff outside of annotation. |
|
Hello, Has there been any progress regarding the development of this feature? |
|
I know it's irritating with people asking again & again, but it would be really useful to have this, any news about this? |
|
Thank you for asking. By your activity we prioritize features, so it isn't irritating :-) |
|
@makseq @feddybear also 👍 for spectrograms! |
|
Hello, |
|
👍 Yes, spectrogram annotation would be fantastic. But it would be just the start - with the spectrogram view available, the following features would be super useful:
I'm not familiar with React at all, but that could change. We're building a pipeline to annotate bats in high-frequency audio recordings, based on batdetect2. They also have a labelling UI that checks many of the boxes UI-wise, except the handling of large amount of tasks, users, storage backends etc. - all the golden labelstud.io features. |
|
Hello, I would love to see this feature for spectrogram annotation with sound playback. There is a huge demand from all the bioacoustics and eco-acoustics community (who are still working on desktop app like audacity and raven for annotations). I understand that spectrogram calculation speed is a bottleneck here for the zooming feature inside the spectrogram. Hopping this feature will come soon. |
|
Up for specs in audio labeling |
|
/jira create
|
|
Hi guys (@sajarin @makseq @feddybear), Has there been any further progress on this feature? Thanks |
|
+1 on wanting these spectrogram tooling. The lack of it is forcing us to consider using other tools for audio labelling. |
|
@isaac-jordan Would you mind sharing the other tools you are considering please? I am in the same situation. |
Two front-runners for us are https://github.com/mbsantiago/whombat and https://www.wildlifeacoustics.com/products/kaleidoscope |
|
btw the repo even contains |
|
It's helpful but seems hard |
Is your feature request related to a problem? Please describe.
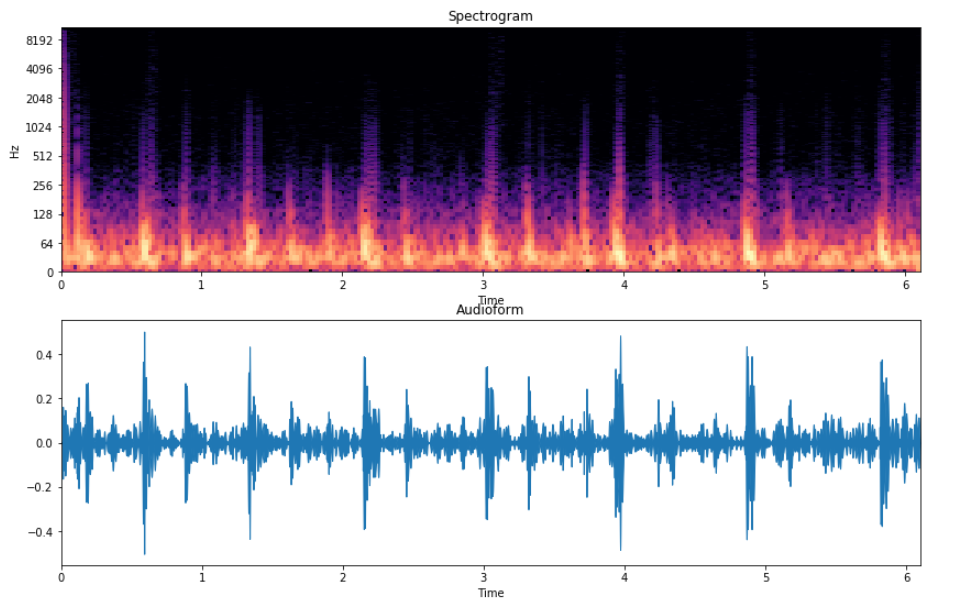
Classifying or segmenting audio with only a waveform preview can be time-consuming or difficult, especially with noisy audio data. Some data is more easily segmented by looking at frequency content over time.
Describe the solution you'd like
Include a toggle to preview a spectrogram representation of an audio clip. Some common python libraries to generate these are Librosa or Scipy.signal.
Describe alternatives you've considered
I've manually generated the spectrograms and saved them as images to be used within the image classification labeling tool. The downsides of this are threefold.
Additional context

Each user's spectrogram needs may differ, such as their sound of interest being within the low or high frequency areas of the spectrogram. To keep implementation simple, use default spectrogram parameters that generalize well and potentially allow users to zoom in on this general spectrogram. A more robust solution would allow the user to specify a few parameters to generate the spectrogram that they would want. Lastly, I include an example of a log-scaled spectrogram with its accompanying waveform.
The text was updated successfully, but these errors were encountered: