DOC: Metrics Collection
The metrics collected by CBTOOL can be divided in three broad categories:
1 Management performance metrics
- These are metrics high relevant for a Cloud provider. They indicate how fast an instance management operation can be completed, and thus how fast the user who originated the request for the operation (or is at the very least affected by it), can see its completion.
- One example of management metric is the provisioning latency, indicating how much time elapses between the arrival of a request to create a new instance (VM) and the availability of such VM for use. Another example metric is the provisioning throughput, indicating how many simultaneous provisioning requests can the cloud handle.
- For instance, having experimentally established values for provisioning latency and provisioning throughput allows the Cloud provider to create a consumption model that permits customers to deal appropriately with application horizontal elasticity. If it takes "too long" to provision/de-provision new VMs, then Cloud customers will tend to over-provision the number of VMs required to support his/her applications, and the consumption model set by the provider should take in account differentiated prices for busy/idle VMs.
- Given that a customer spends significant time tailoring instances to support their specific application requirements, the need for the preservation of these changes as new base images to be deployed further is a fact of life for a provider. Being able to understand how quickly can a running instance be "captured", or "saved" (different Clouds have different names for this operation) is of crucial importance. Examples metrics in this case would be capture latency and capture throughput.
- An additional management operation that, while not usually exposed to Cloud customers, greatly affects them is the instance migration (i.e., the ability to briefly suspend the VM execution on one host and resumes on another host). This is a particularly important operation in case of "host evacuation" for maintenance, or continuous workload consolidation on the cloud (e.g., in order to minimize the number of host powered on at any given time).
- To collect these metrics, The CBTOOL Orchestrator obtains this data directly from the cloud manager - this usually requires constant polling in order to know the instances' current "state" or "status" -, and then writes it directly to the Metric Store.
2 Application performance metrics
- These are metrics relevant for Cloud providers and customers. They indicate what is the actual service capacity of an application deployed on a given Cloud.
- The metrics in this case are always (some form of) application latency/response time and application throughput.
- One extremely important experimental use case for Cloud providers is to establish how management operations (e.g., VM provision, VM capture) can affect the application performance on running VMs, when such VMs are co-located (i.e., in the same host) with VMs undergoing one these operations.
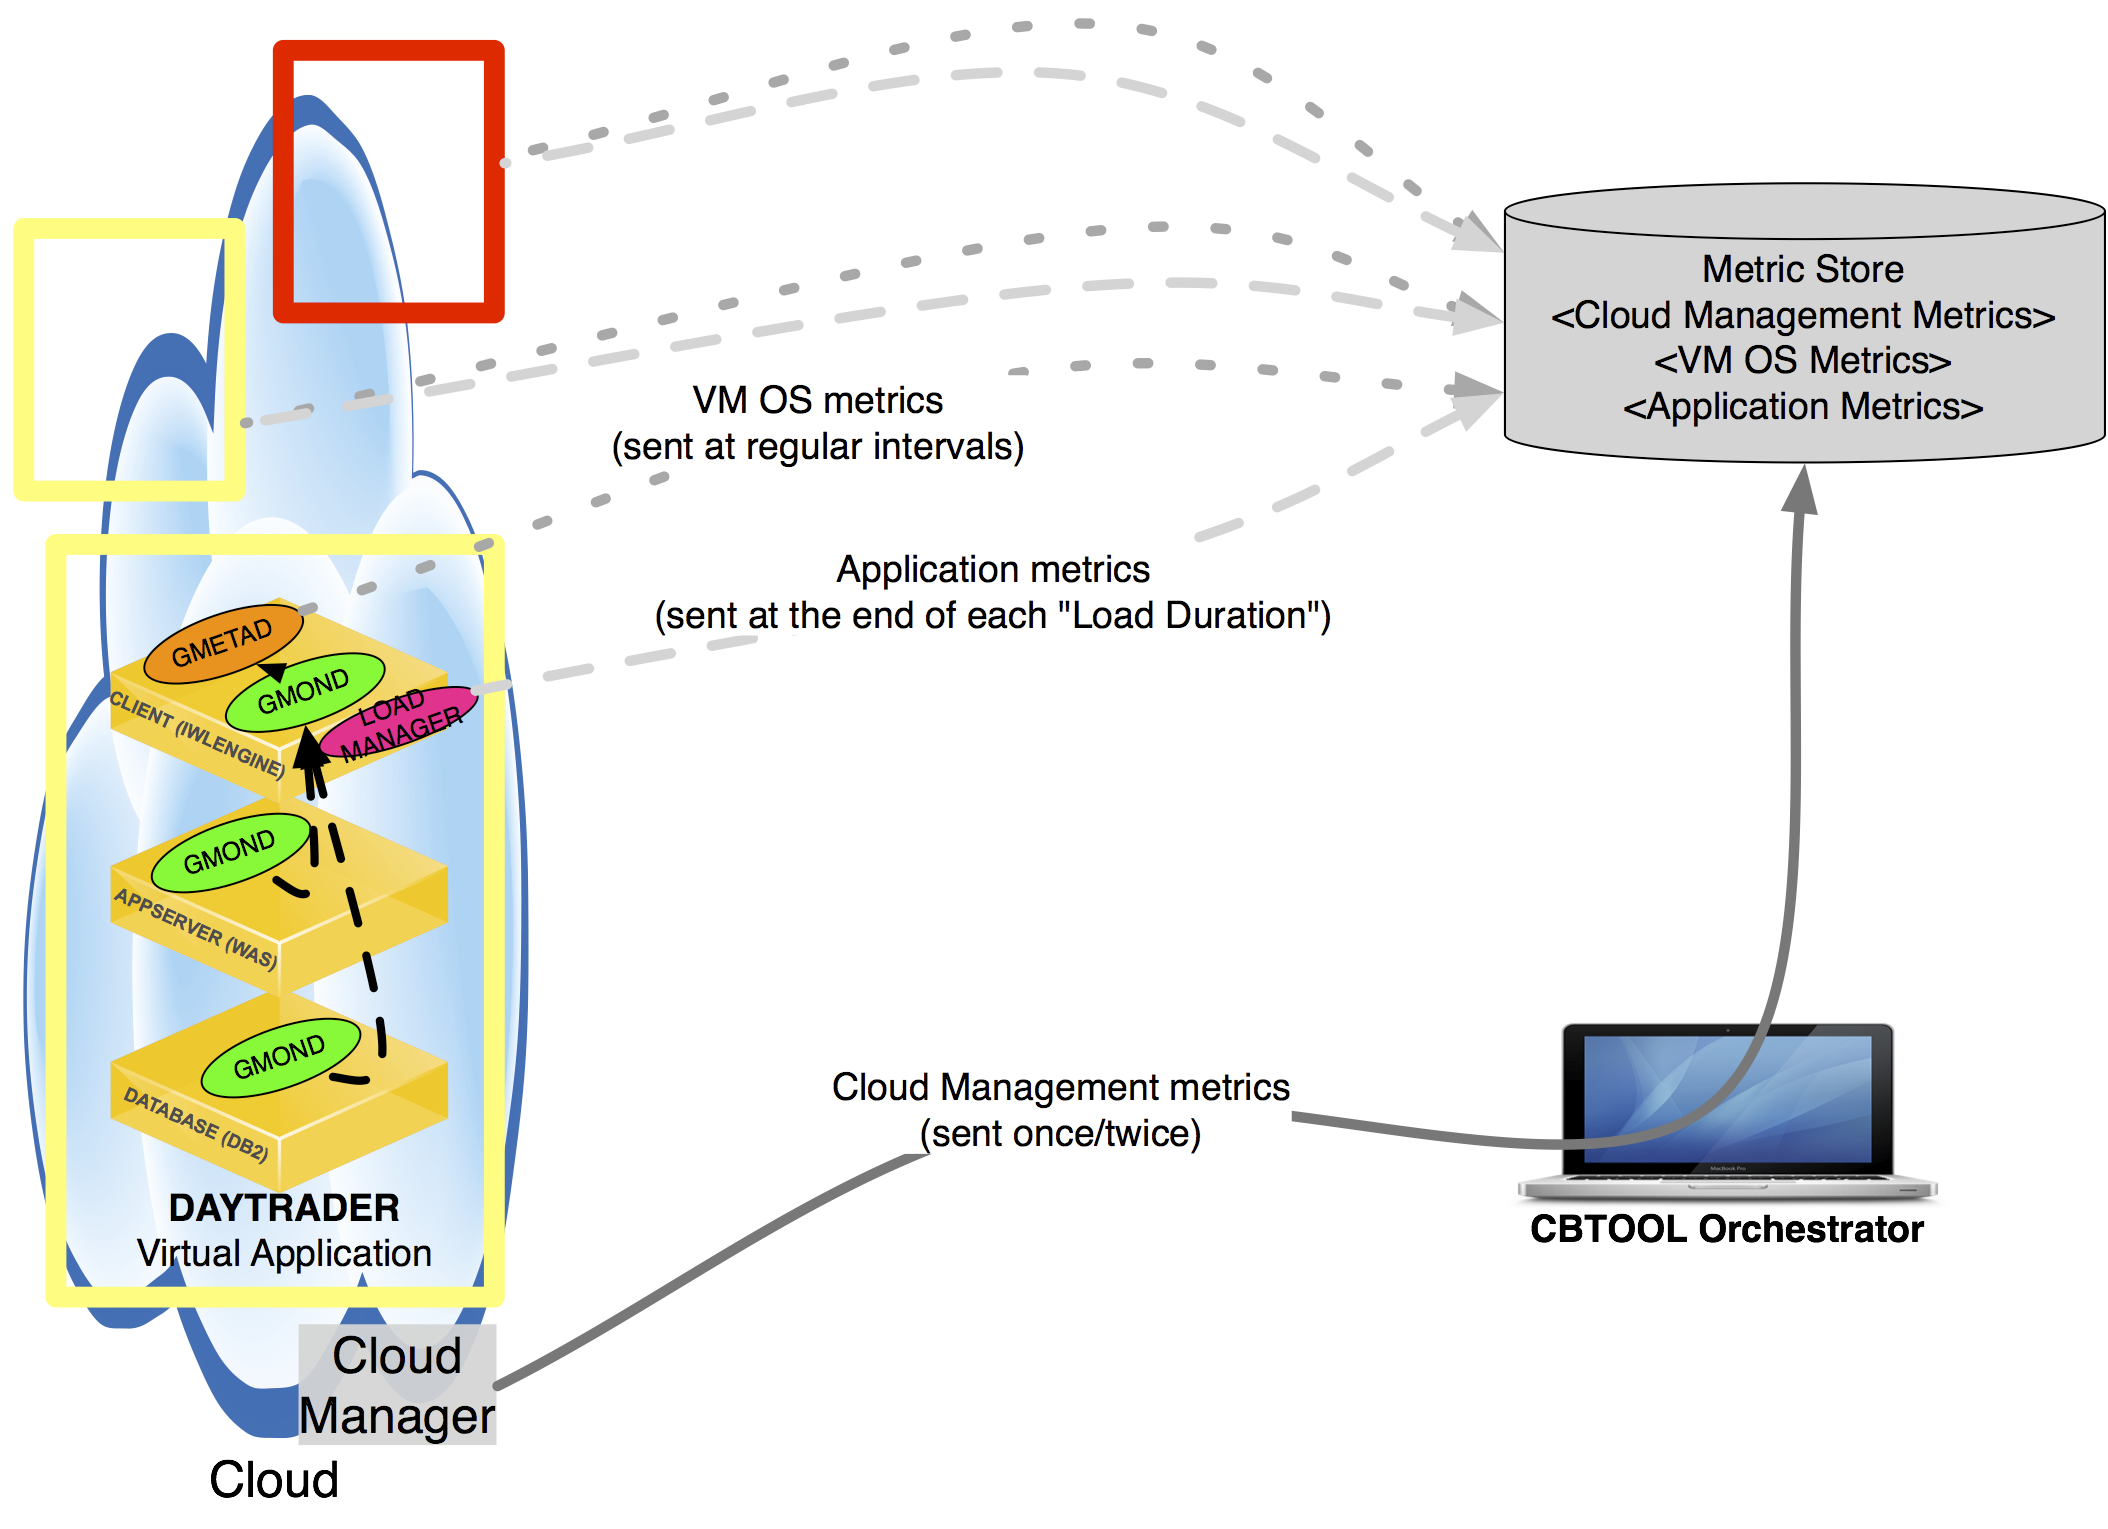
- The Load Manager process sends application performance data directly to the Metric Store, at the end of each load duration.
3 OS resource usage metrics (processor, memory, disk, network):
- Relevant to correlate certain cloud operation patterns, either certain management operations or application execution at a certain load level, to specific OS resource usage patterns.
- Each Virtual Application has a VM that is designated Metric Aggregator.
- The collection is done leveraging heavily the Ganglia Monitoring System.
- Each VM on a Virtual Application has its own set of “probes” (represented by the “gmond” process, configured with one send channel), collecting data continuously.
- One of the VMs on Virtual Application, the one with designated as Metric Aggregator in the Virtual Application template_, runs two daemons. One is Ganglia's gmond, configured with one receive channel (in addition to the send channel), working effectively as an aggregator for the OS metrics produced by all VMs on the Virtual Application). The second is a python-based Ganglia gmetad, which has a plugin for MongoDB, that periodically writes the data in the CBTOOL's Metric Store.
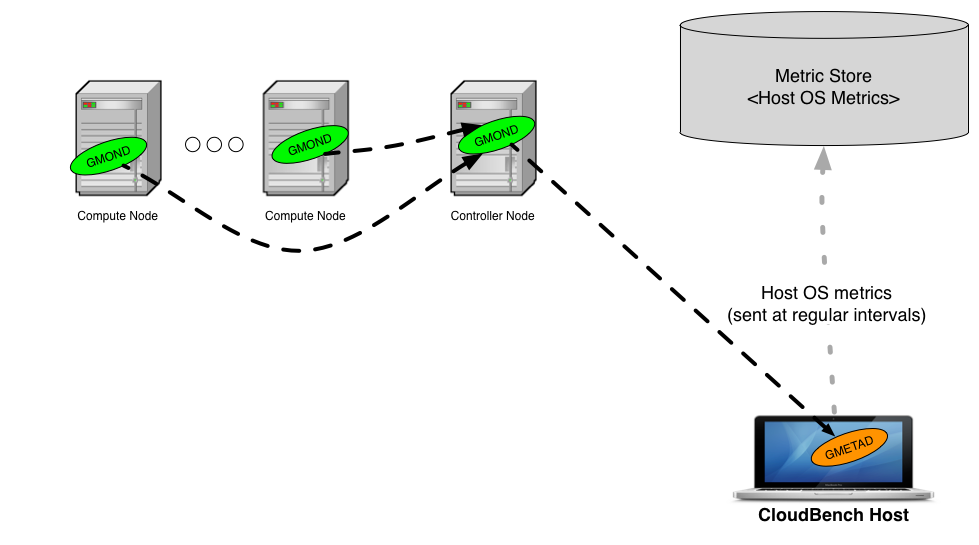
- This is evidently only possible for clouds where an external user has visibility of the compute nodes. For instance, OpenStack and CloudStack clouds would allow collection from the Host OS resource usage.
- The Ganglia configuration should be similar to the one described above for the VMs within a Virtual Application: one gmond per Compute Node with one send channel), plus one gmond on one of the node (e.g., the Controller Node), with one send and one receive channel. This node will be HOST OS usage metrics aggregator.
- The CBTOOL orchestration node needs to be able to establish a network connection to the HOST OS usage metrics aggregator.
For illustrative purposes, here follows an example using OpenStack.
-
Make sure that you have the parameters
DISCOVER_HOSTS = $Trueon the section [VMC_DEFAULTS : OSK_CLOUDCONFIG] on your private configuration file. -
Make sure that you your private configuration file has also the following parameters:
[MON_DEFAULTS : OSK_CLOUDCONFIG]
COLLECTOR_AGGREGATOR_HOST_ADDRESS = IP ADDRESS OF THE HOST OS USAGE METRICS AGGREGATOR
COLLECT_FROM_HOST = $True
-
Make sure that the IP addresses reported by the command
hostlist(run on CBTOOL CLI) andnc IP ADDRESS OF THE HOST OS USAGE METRICS AGGREGATOR 8649 | grep "HOST NAME"(run on the Host OS usage metrics aggregator) are the same. They need to be same, otherwise CBTOOL will not be able to correlate the reported metrics to the hosts that it discovered during the cloud initial attachment. -
If everything was configured correctly, then the command
monlist HOSTshould report metric samples being collected. Alternative, you can look at the metrics on the "Dashboard" tab