HOWTO: Customize Dashboard Monitoring in the Graphical Environment
NOTE: This tutorial assumes you have the toolkit already up and running and:
-
You have already tried the Graphical Environment
-
and that you have already interacted with the monitoring dashboard interface
On each of the dashboard monitoring tabs, you have a long list of metrics that are collected by the cbtool performance monitoring system.
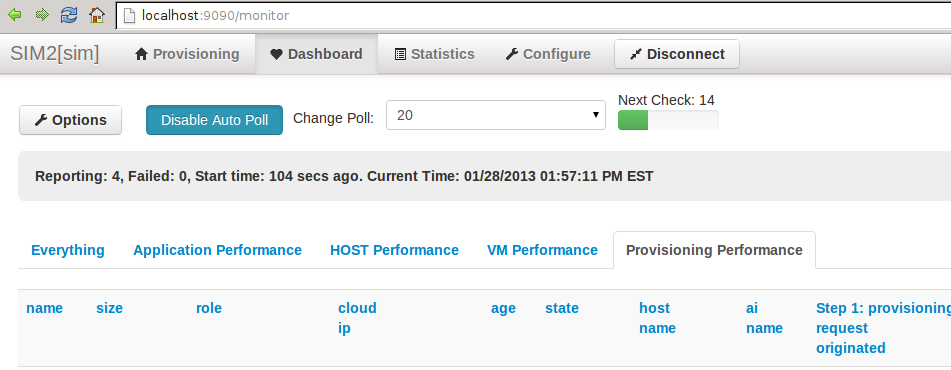
By clicking on any of the column titles in any of the categories, that column will immediately "disappear". By doing this a filter is automatically created which removes that column from the output view.
NOTE: This does not mean we have stopped collecting data, it just means that the data is hidden from view in the user interface.
Upon clicking on Dashboard at the top of the User Interface, you will see an Options button underneath the title bar on the top, left-hand side.
Clicking Options will bring up a dialog like this:
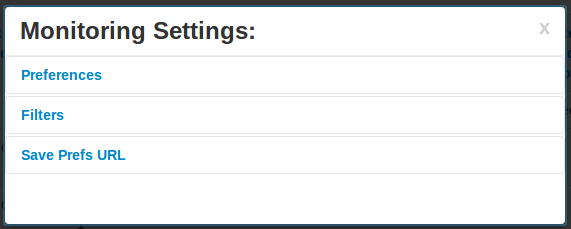
Then, click on Filters, which will expand the Filter section, like this:
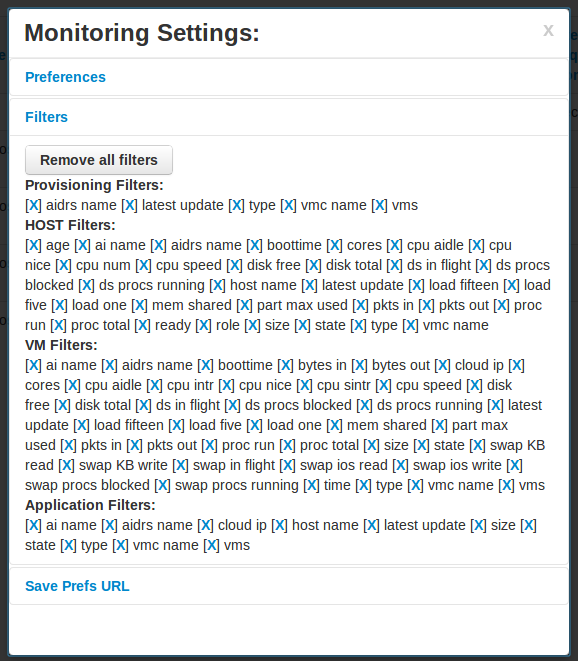
As you can see, in this example we have lots of filters setup. By click on the "X" next to any of those filters (or "remove all"), the corresponding filter will be removed and the column that was hidden will now come back into view when the interface refreshes itself.
The dashboard also provides a number of other useful preferences:
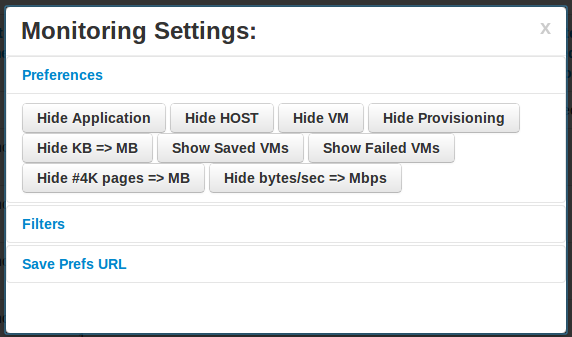
- Hide Individual Categories: You can hide individual monitoring categories by clicking on buttons such as Hide Application or Hide Provisioning.
- Hide Failed / Saved VMs: Sometimes, during the course of an experiment, you are no longer concerned with the list of failed virtual machines or suspended virtual machines because you may or may not have already remedied or remediated those virtual machines during an experiment.
- Convert Some Metrics: There is limited support for converting common metrics to more common units that we are familiar with, such as "mbps" for gigabit networks or "MB" for memory and swap space.
Any of these actions can be reversed by going back and selecting the corresponding "Show" button for that action.
Once you have finished customized your dashboard the way you like it, click the Save Prefs URL section of the Options dialog and expand it:
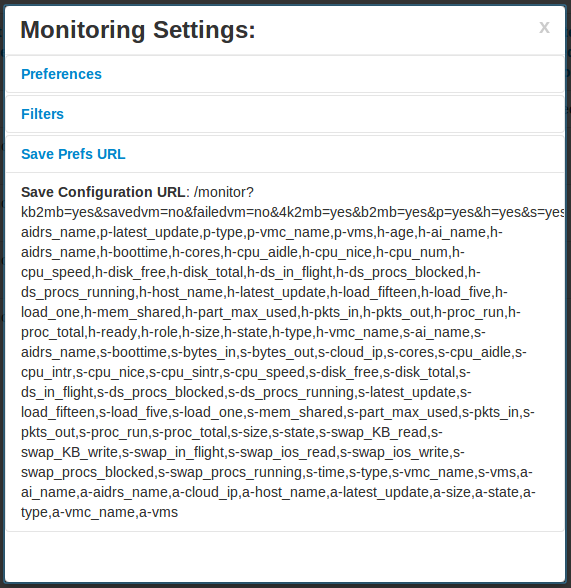
Here, you will see a long string of characters in the form of a URL. Copy and paste this entire string and open your CBTOOL configuration file.
Create a section in your configuration file that looks like this:
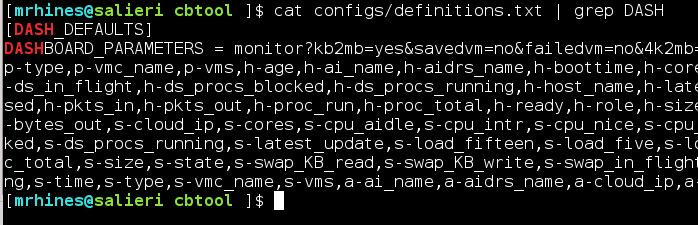
Save the configuration, and the next time you reset your CBTOOL experiment, your dashboard filter settings will be preserved across experiments so that you do not have to re-enter those settings the next time you interact with the dashboard user interface.
Happy Filtering!