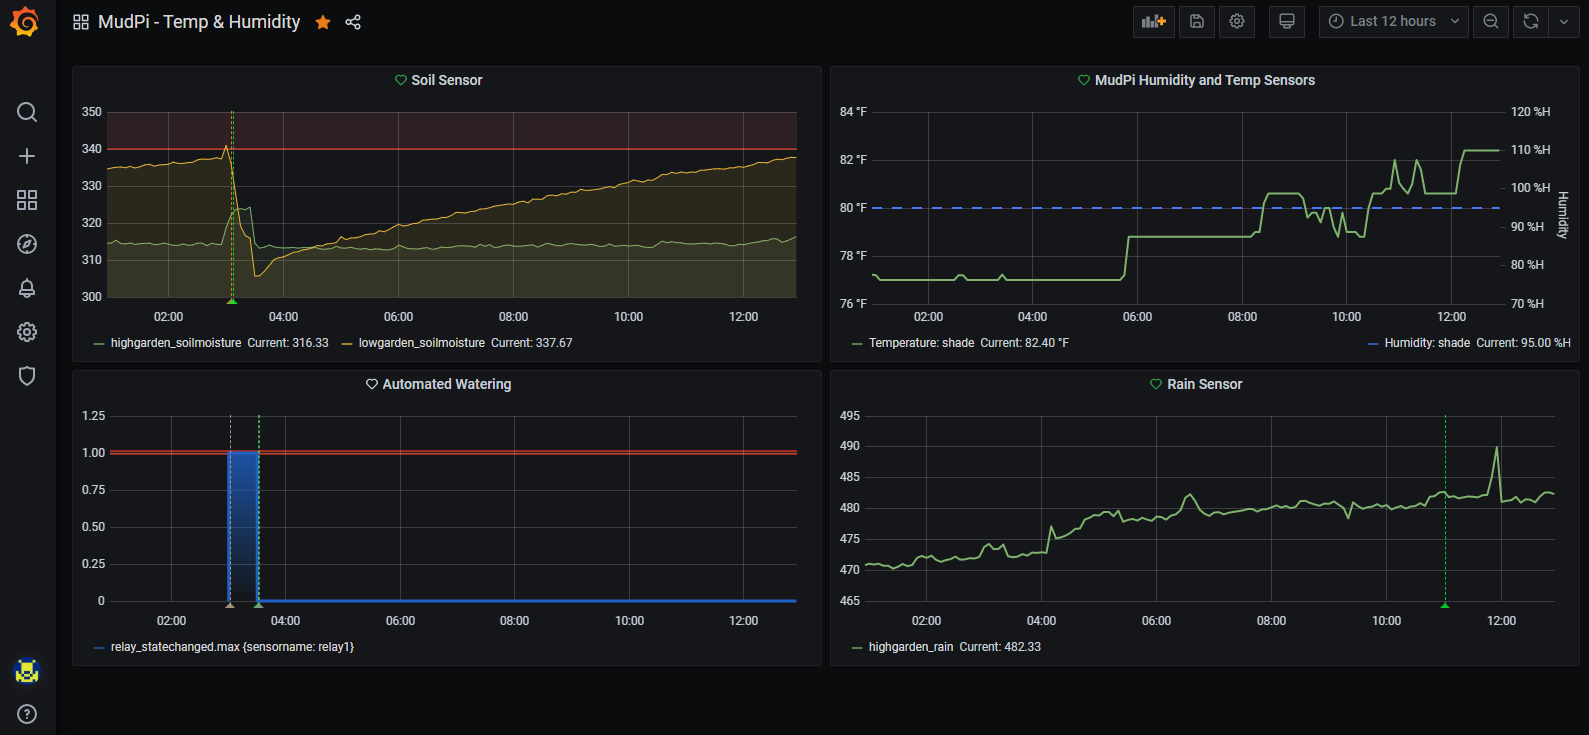
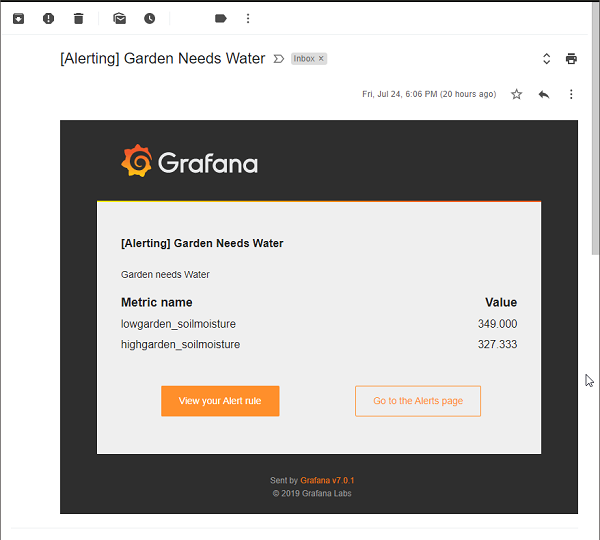
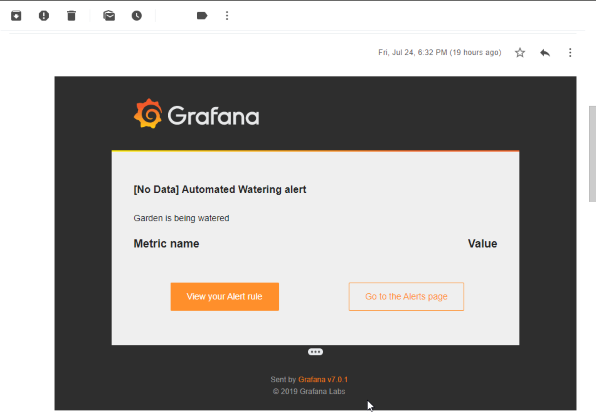
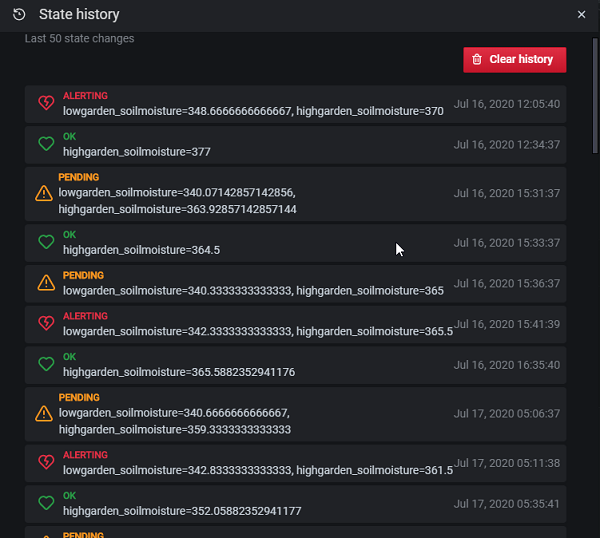
MudPiInflux is simple interface to Mudpi which subscribes to the Redis PubSub and stores data from your garden in Influx. Using Grafana you can then enable dashboards and alerting. This can all run on the mudpi master raspberry pi (or could be configured on a separate machine)
The interface from Redis to Influx is only written for the following. (Others will likely work, but this is all I have tested)
- Weather / soil sensors on Arduino
- Only 1 Relay (relay name not part of message)
- Temp / Humidity Sensor
- Raspberry SC15184 Pi 4 Model B 2019 Quad Core 64 Bit WiFi Bluetooth (2GB)
- LM393 Rain Drops Sensor Weather Moisture Monitor Sensor
- BACOENG 1" DC12V Electric Solenoid Valve (NPT, Brass, Normally Closed)
- Capacitive Soil Moisture Sensor Corrosion Resistant
- 2 Channel DC 5V Relay Module with Optocoupler Low Level Trigger Expansion Board
- 5pcs DHT11 Temperature Humidity Sensor Module Digital Temperature Humidity Sensor
- Installing MudPi from Github
- Installing InfluxDB & Grafana on Raspberry Pi
- Install Grafana on Raspberry Pi
Confirm the software installed on raspberry pi are both working
- Installing MudPi from Github
- Follow This guide to install Influx and Grafana you can skip step 0 - Guide
- (Optional) Follow through with the network speed tutorial if you want to learn more about how data flows from Influx to Grafana. - Guide
- (Optional) if installing influx on a different machine you can run this script on that machine or you can install influxdb-client on the PI instedad.
should upgrade to the new client pip3 install influxdb-client
pip3 install influxdb
- Download the mudpitoinflux3.py script to your download directory
cd ~/Downloads
wget https://raw.githubusercontent.com/icyspace/MudPiInflux/master/mudpitoinflux3.py
- Update mudpitoinflux3.py influx credentials
sudo nano mudpitoinflux3.py

Enter Keys ctl + o then Enter - to save the file
Enter Keys ctl + x – to exit - Move config file to execution directory
Move py file with your saved configurations to the directory you would like to run it from. I am just running this from my home dir.
mv mudpitoinflux3.py ~/ - Add to supervisor config
If you would like this file to run automatically on startup and restart on failures it's good to added it to supervisor. Just like Mudpi is running.
Navigate to sup supervisor directory
Create new conf file for mudpitoinflux3 scriptcd /etc/supervisor/conf.d
Paste the following code in the file. I have my script running out of my home directory. If you want it to run from a different location you can create that and update this config here.sudo nano mudpitoinflux3.conf
Enter Keys[program:mudpitoinflux3] directory=/home/pi user=pi command=python3 -u /home/pi/mudpitoinflux3.py autostart=true autorestart=true stderr_logfile=/home/pi/logs/mudpitoinflux3.err.log stdout_logfile=/home/pi/logs/mudpitoinflux3.out.logctl + othenEnter- to save the file
Enter Keysctl + x– to exit
Start SupervisorTo check the statussudo supervisorctl update sudo supervisorctl start mudpitoinflux3
or review error log in the location you specified in the supervisor config filesudo supervisorctl start mudpitoinflux3
- Connect to influx
Go to home dir
cd ~
influx
- Select the home database (or the table you configured the mudpitoinflux3.py to write to)
use home
- List and query measurements being collected
You should see your sensors by name listed here. Select one and use it in the query below.
show measurements
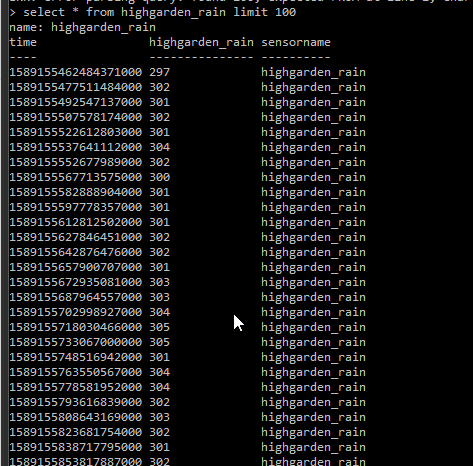
This will display the data in the measurement of the time series database. If you see your data you are good to go.Select * from <measurement> limit 100
- Log into Grafana
Open a browser and navigate to your Pi IP address
http://<your.rpi.address>:3000 - Create new data source
Navigate toConfiguration > Data SourcesSearch for "Influx"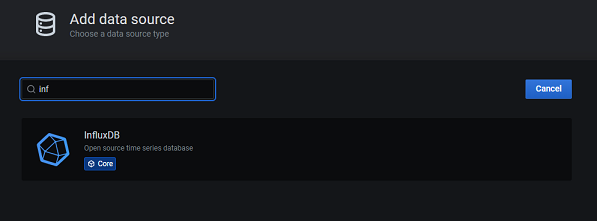
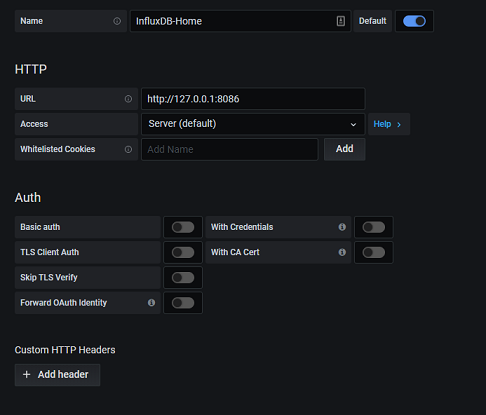
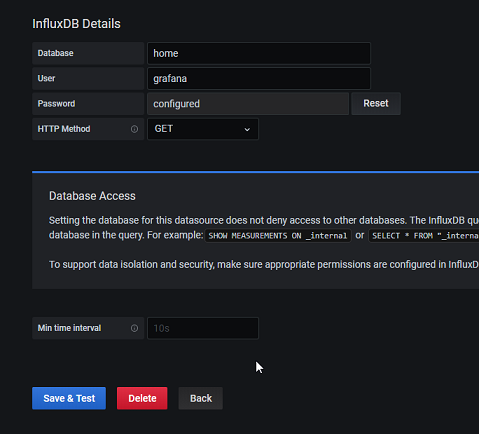
Below is my configuration and is fairly standard if you installed Grafana on the same raspberry pi as Mudpi and influx
- Create new Dashboard

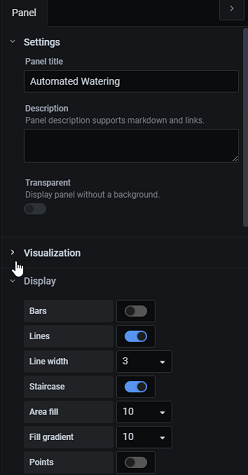
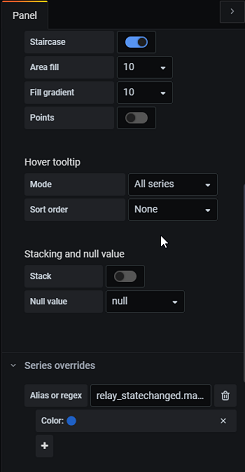

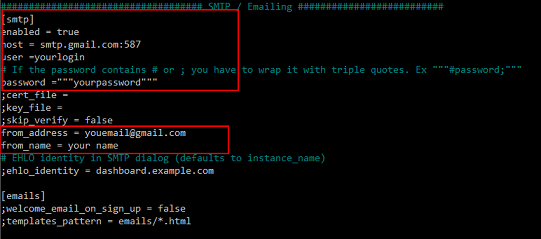
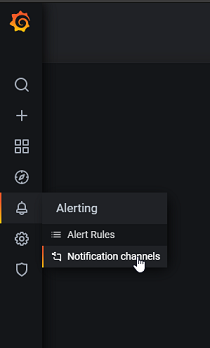
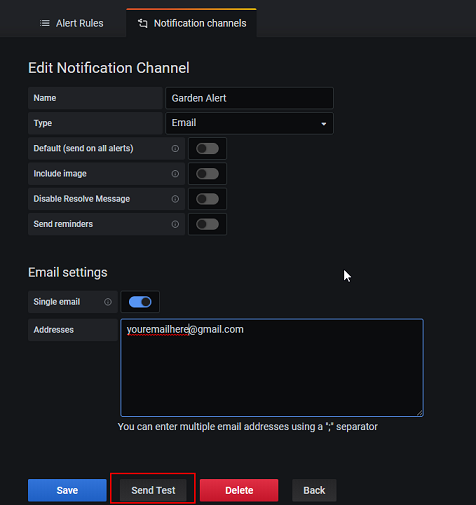
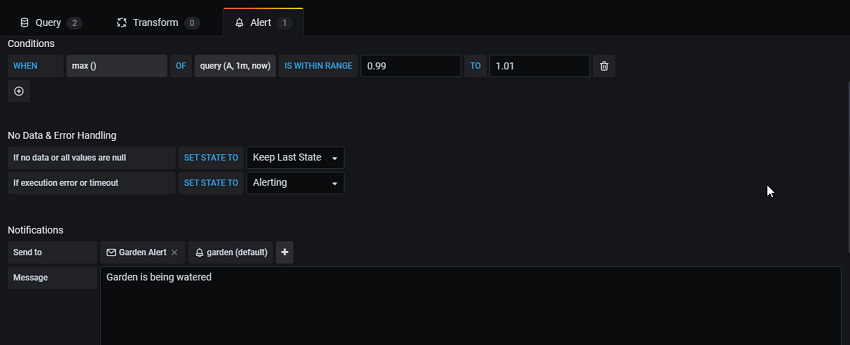
To use alerting you must set up a Notification Channel. Grafana supports a large range of options here.
At this point you should have a low maintenance solution to collect, view, and be alerted on your garden’s performance.
Happy Growing!
