Python evaluation of Altair/Vega-Lite transforms.
altair-transform requires Python 3.7 or later. Install with:
$ pip install altair_transform
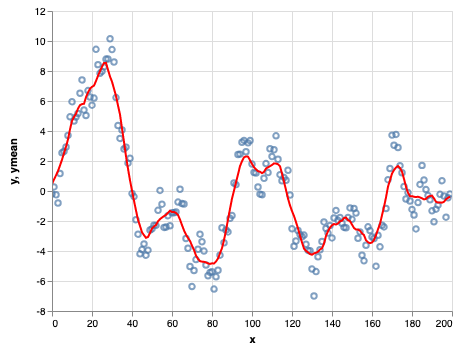
The Vega-Lite specification includes the ability to apply a wide range of transformations to input data within the chart specification. As an example, here is a sliding window average of a Gaussian random walk, implemented in Altair:
import altair as alt
import numpy as np
import pandas as pd

rand = np.random.RandomState(12345)

df = pd.DataFrame({
    'x': np.arange(200),
    'y': rand.randn(200).cumsum()
})

points = alt.Chart(df).mark_point().encode(
    x='x:Q',
    y='y:Q'
)

line = alt.Chart(df).transform_window(
    ymean='mean(y)',
    sort=[alt.SortField('x')],
    frame=[5, 5]
).mark_line(color='red').encode(
    x='x:Q',
    y='ymean:Q'
)

points + line
Because the transform is encoded within the renderer, however, the computed values are not directly accessible from the Python layer.
This is where altair_transform comes in. It includes a (nearly)
complete Python implementation of Vega-Lite's transform layer, so
that you can easily extract a pandas dataframe with the computed
values shown in the chart:
from altair_transform import extract_data
data = extract_data(line)
data.head()| x | y | ymean | |
|---|---|---|---|
| 0 | 0 | -0.204708 | 0.457749 |
| 1 | 1 | 0.274236 | 0.771093 |
| 2 | 2 | -0.245203 | 1.041320 |
| 3 | 3 | -0.800933 | 1.336943 |
| 4 | 4 | 1.164847 | 1.698085 |
From here, you can work with the transformed data directly in Python.

