RealCase1
Here is a real case of monitoring and improving the performance of a Java web site using JavaMelody.
You can also read the second JavaMelody real case.
A web site is available on the Internet and used by hundreds of people every day. Like most web site visits are very short: often 2 or 3 pages and sometimes a bit more.
The technologies of this web site are 2 Liferay server instances with some custom made components, JSF, Java 7, Tomcat 7, Mysql, Apache reverse proxy with cache depending on Liferay headers. (I am convinced that technologies are not the cause of the issue here. It all depends on developers who have forgotten to fix their code. And in this case, Liferay was chosen by the client and not by the developers.)
Each of the 2 Liferay instances has 8 cores, 24 GB for Xmx and 32 GB for physical memory.
The issue is that sometimes the response time is good and sometimes the web site slows down for no known reason in production. And slowdowns impact usage of visitors. Restart of the Liferay instances are known to solve the problem, but only for a few hours.
Some years ago, when the new web site went live the first time, it crashed a few hours after. That was bad.
To reproduce the same load, all the GET http requests from the access logs were copied and run against a test environment. And then I was called to help understand the issues, using the javamelody plugin for Liferay of course.
To see what is going on just now, the best is to look at the stack-traces of the running threads. So we open the list of the threads in a new page and refresh the page every 20 s, to see in the stack-traces if some threads are often running the same methods and which one (hint: the running threads are in state RUNNABLE or sometimes BLOCKED). And while reproducing the crash, we have seen that the used memory increased up to the Xmx value with out of memory errors. So when the memory was high and before the crash, we looked at the heap histogram page of javamelody.
In the heap histogram, we have seen a lot of instances of the DLFileEntry class which were suspects among other objects. The top of the stack-traces of the running threads shows what the threads are currently doing: there were often executions of methods reading data from the database on a socket and these executions were coming from methods of a custom component loading DLFileEntry instances from the database.
By inspecting the source code involved in the offending stack-trace in an IDE, we understood that a buggy view mode in this custom component was unfortunately loading all the images of the web site each time some pages were displayed. We fixed it before going live again.
So when reproducing the issue under load, several stack-traces of the running threads guided us to a hotspot in the code and the heap histogram confirmed the memory problem related to this code.
In the second season, the marketing unit launched an ads campaign on Internet and on TV, without warning. The number of visitors skyrocketed up to 200 times the previous maximum, and the used memory in the heap increased, and the cpu of the process increased up to 75 %. The web site became quite slow. But the servers did not crash this time (in fact, they should have crashed, but they were saved by the network bandwidth to Internet which was limited to 100 MB / s at this time and which caused network timeouts for visitors).
To improve the response time, the CPU and the long pauses of major GC, we created a cache for the static content parts generated by portlets such as header, footer and menus, using a custom development named CachedGenericFacesPortlet. (Because the Liferay portlet cache was too limited). The source of the CachedGenericFacesPortlet is given at the end of this page. Even with many contents kept in cache in memory, the used memory was in fact reduced.
And the network bandwidth to Internet was increased using new hardware at the hosting service.
Fortunately, the web site now uses javamelody continuously in production. And in this case, it is the javamelody plugin for Liferay.
So let’s open the monitoring page of one of the two Liferay instance. Here are the graphics at the top of the monitoring page, after clicking on the “Week” button:
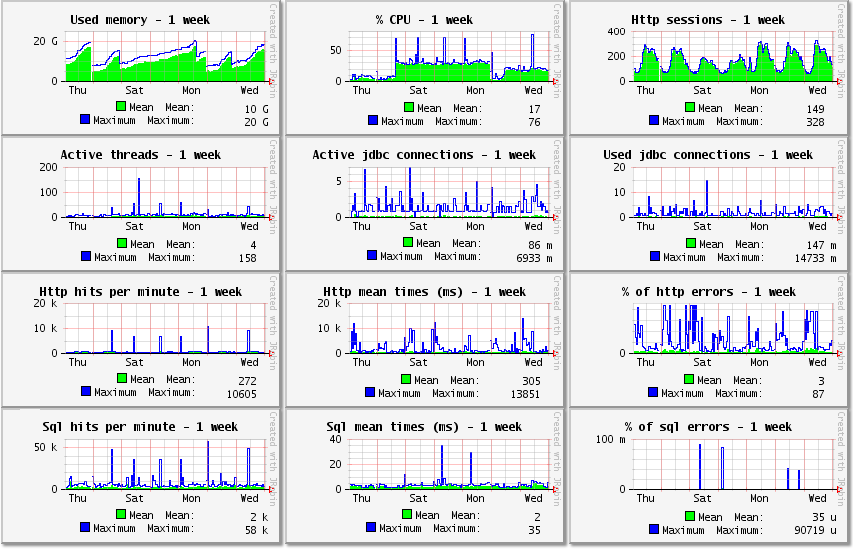
I will look at the graphics in the display order.
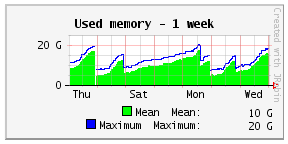
It is the memory used by the JVM in the heap. As you can see, the used memory decreases suddenly from times to times (on Friday near midnight, on Monday near midday and on Tuesday in the afternoon). This is done by a major GC in the JVM, to remove objects which are no longer used.
You can also see small holes in all the graphics and all at the same time, with sometimes a blank vertical line:
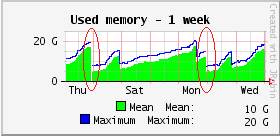
The holes in the graphics were caused by restarts of the server (when no JVM, no measures obviously).
We could also see that the used memory is quite high, for a Java app mainly rendering the pages of a web site: minimum used memory is 5 GB, mean is 10 GB, maximum is 20 GB with a Xmx of 24GB.
At this point, you could think that Liferay (with custom made components) is eating memory like a dog. But in fact, it was even worse before putting in cache the static content parts of pages, explained in the second season above.
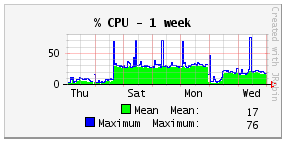
We can see short spikes in the % CPU graphic every day, in general between midnight and midday.
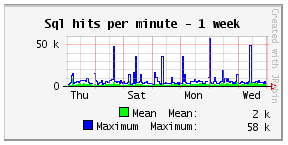
We can also see short spikes at the same time in the Http hits per minute and in the Sql hits per minute:
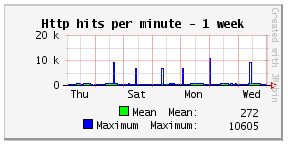
We could ask what the cause of those regular spikes is. And we have found outside of javamelody (in the access logs on the Apache reverse proxy) that those spikes are caused by thousands of http hits in a short time, exactly like a DOS attack!!! But the URLs called and the single IP of the client has guided us to a robot of the hosting service scanning mainly PHP vulnerabilities every day. (The question why vulnerability scans behave like DOS attacks and why they are consuming so much CPU and Sql hits in Liferay is a problem for another day, as long as it does not slow the web site for too long.)
We can also see that % CPU remains high for days, but not every day. We will come back to that later and let’s see what else we can look at.
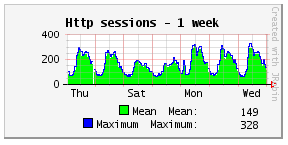
That’s the http sessions of only one of the 2 server instances. The total number of http sessions would be about doubled. So we have:
- a maximum of about 650 http sessions at the same time (for 2 instances), but this is a web site so visits are in fact only 1 minute long, while sessions inactivity timeout before destruction may be 30 minutes. So the maximum number of users really looking at the web site at the same time is far less than that.
- http sessions and visitors are 2/3 of the maximum on week-ends: this is a web site and not a business app which would be used only on working days.
- http sessions are still 1/3 of the maximum during the night: this is a web site visited from many time zones.
To be sure, we could check in the other server instance if the numbers are about the same (for example, by changing the ROUTEID cookie set by the reverse proxy). But the 2 server instances are supposed to be evenly loaded.
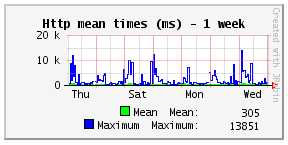
If we ignore the short spikes in the graphics which we have already seen, we see that there is a mean of 272 http hits per minute for one server instance (about 540 for two server instances), night and day included, http hits cached in the reverse proxy like icons excluded. And the mean time of the http hits is 305 ms. With the http statistics below the graphics in the monitoring page, we may try to improve the long http requests which are often called, depending on which sql requests they call, but that’s a problem for another day.
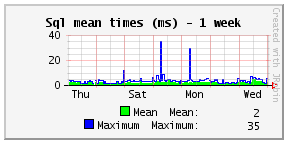
And we see that there is a mean of 2000 sql hits per minute for one server instance, with a mean time of 2 ms.
We see that % CPU is high for days but not every day. There is probably a relation between that and the intermittent slowdowns. If the server is using CPU what is it doing? We could zoom on the active threads graphic:
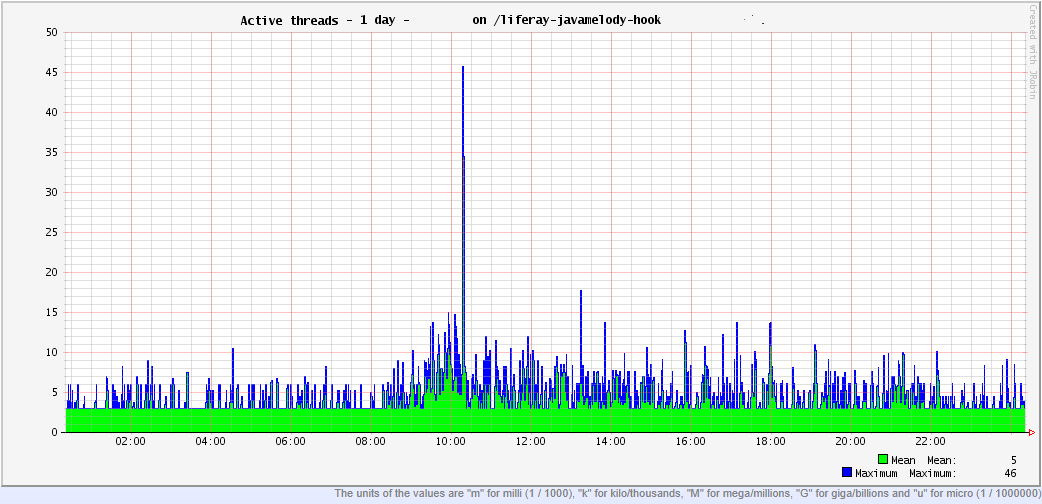
Indeed, for this graphic for the last day, we can see that there are 3 active threads which are continuously running and consuming CPU.
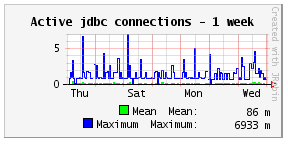
In the active jdbc connections graphic, the green is near 0 most of the time: so there are no long sql requests running for days which could cause those long http requests. (And if the server was really waiting for long sql requests, it would not consume CPU in the java server anyway.)
In summary, there are several very long http requests using each an active thread running continuously in java code without ending for days. It’s time to look at the Current requests in the monitoring page when CPU is high or at the Threads in the monitoring page, in particular at the stack-trace of the threads in running state.
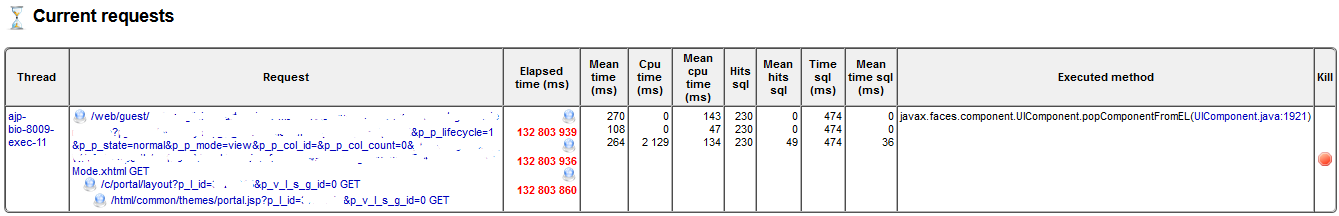
We see indeed a long http request and it is currently running a UIComponent.popComponentFromEL method. And in this case, it includes calls to other URLs: /c/portal/layout?... and /html/common/themes/portal.jsp?...
And when hovering over the thread name, we see the current stack-trace of the thread (cut at the bottom for brevity):
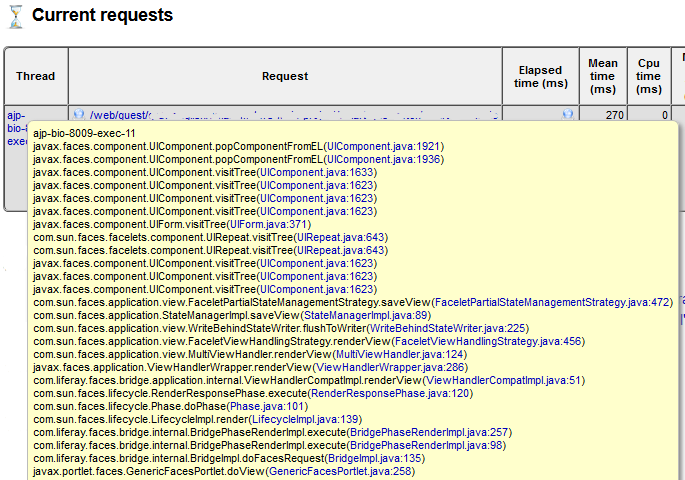
We can refresh the page to have many stack-traces of this thread, but it does not change much in this case.
Now, what can we do?
First, we should probably try to reproduce the issue in development and to debug the concerned portlet step by step to see the states of objects and the conditions for infinite loop. Otherwise we have Internet and by chance, there were similar known issues and solutions for the same infinite loop. As is often the case, stackoverflow may help to find the possible solutions for this problem.
That’s all and I do not know at the moment how the story ends and if someone is in charge of the problem, but I have heard that the web site may be rewritten anyway, with the hope that starting from scratch again is easier than maintaining the web site. Of course, starting from scratch again will mean a new and big budget to consume for everyone.
As said above, the following portlet code has reduced response time, CPU and used memory of a Liferay web site by keeping in cache, the static content parts such as the header, footer and menu portlets. (Some specific conditions, depending on portlet attributes, for when using the cache or not were removed here.)
/*
 * Copyright Emeric Vernat
 *
 * Licensed under the Apache License, Version 2.0 (the "License");
 * you may not use this file except in compliance with the License.
 * You may obtain a copy of the License at
 *
 *     http://www.apache.org/licenses/LICENSE-2.0
 *
 * Unless required by applicable law or agreed to in writing, software
 * distributed under the License is distributed on an "AS IS" BASIS,
 * WITHOUT WARRANTIES OR CONDITIONS OF ANY KIND, either express or implied.
 * See the License for the specific language governing permissions and
 * limitations under the License.
 */
package liferayportletcache;

import java.io.IOException;
import java.io.OutputStream;
import java.io.PrintWriter;
import java.io.StringWriter;
import java.util.ArrayList;
import java.util.List;

import javax.cache.Caching;
import javax.cache.Cache;
import javax.portlet.PortletConfig;
import javax.portlet.PortletException;
import javax.portlet.RenderRequest;
import javax.portlet.RenderResponse;
import javax.portlet.filter.RenderResponseWrapper;
import javax.servlet.http.HttpServletRequest;

import org.apache.commons.io.output.ByteArrayOutputStream;
import org.apache.logging.log4j.Logger;
import org.apache.logging.log4j.LogManager;

import com.liferay.portal.kernel.util.WebKeys;
import com.liferay.portal.model.Layout;
import com.liferay.portal.theme.ThemeDisplay;
import com.liferay.portal.util.PortalUtil;

/**
 * GenericFacesPortlet which keeps in cache the rendered content (html bloc in fact).
 * @author Emeric Vernat
 */
public class CachedGenericFacesPortlet extends com.liferay.faces.bridge.GenericLiferayFacesPortlet {

    private static class CachedRenderResponseWrapper extends RenderResponseWrapper {
        private ByteArrayOutputStream outputStream;
        private StringWriter stringWriter;
        private PrintWriter writer;

        CachedRenderResponseWrapper(final RenderResponse renderResponse) {
            super(renderResponse);
        }

        @Override
        public OutputStream getPortletOutputStream() throws IOException {
            if (outputStream == null) {
                outputStream = new ByteArrayOutputStream();
            }
            return outputStream;
        }

        @Override
        public PrintWriter getWriter() throws IOException {
            if (writer == null) {
                stringWriter = new StringWriter(1024);
                writer = new PrintWriter(stringWriter);
            }
            return writer;
        }

        byte[] getOutputStreamData() {
            if (outputStream != null) {
                return outputStream.toByteArray();
            }
            return null;
        }

        String getWriterData() {
            if (stringWriter != null) {
                return stringWriter.toString();
            }
            return null;
        }

        @Override
        public void reset() {
            super.reset();
            resetStreams();
        }

        @Override
        public void resetBuffer() {
            super.resetBuffer();
            resetStreams();
        }

        private void resetStreams() {
            if (outputStream != null) {
                outputStream.reset();
            }
            if (stringWriter != null) {
                stringWriter.getBuffer().setLength(0);
            }
        }
    };

    private static final Logger LOG = LogManager.getLogger(CachedGenericFacesPortlet.class);
    private static final boolean CACHE_ENABLED = true;

    /**
     * Cache of portlets contents.
     * Key : portletId_groupId_layoutPlid or portletId_groupId_layoutPlid_param1_paramN
     * Value : content as either String or byte[]
     */
    private static final Cache<String, Object> CONTENTS_CACHE = Caching.getCachingProvider().getCacheManager().getCache("CachedGenericFacesPortlet");

    /**
     * Optional names of parameters in http request which values are parts of the cache key.
     * For example, "...?tab=VIDEO" and "...?tab=PHOTO" may have different contents in cache.
     */
    private List<String> cacheKeyParameters;

    @Override
    protected void doView(final RenderRequest renderRequest, final RenderResponse renderResponse)
                    throws PortletException, IOException {
        if (!CACHE_ENABLED || isUserSignedIn(renderRequest)) {
            super.doView(renderRequest, renderResponse);
            return;
        }

        final String cacheKey = getCacheKey(renderRequest);
        Object cachedContent = CONTENTS_CACHE.get(cacheKey);
        if (cachedContent == null) {
            if (LOG.isDebugEnabled()) {
                LOG.debug("Content " + cacheKey + " not found in cache and will be generated by the portlet");
            }

            final CachedRenderResponseWrapper responseWrapper = new CachedRenderResponseWrapper(renderResponse);

            super.doView(renderRequest, responseWrapper);

            final Object data;
            final int dataSize;
            final byte[] outputStreamData = responseWrapper.getOutputStreamData();
            if (outputStreamData != null) {
                data = outputStreamData;
                dataSize = outputStreamData.length;
            } else {
                final String writerData = responseWrapper.getWriterData();
                data = writerData;
                dataSize = writerData.length();
            }
            CONTENTS_CACHE.put(cacheKey, data);
            cachedContent = data;
            if (LOG.isDebugEnabled()) {
                LOG.debug("Content " + cacheKey + " (" + dataSize + " bytes) generated with the portlet and put in cache");
            }
        } else {
            if (LOG.isTraceEnabled()) {
                LOG.trace("Content " + cacheKey + " found in cache");
            }
        }

        if (cachedContent instanceof String) {
            final String data = (String) cachedContent;
            renderResponse.getWriter().write(data);
        } else if (cachedContent instanceof byte[]) {
            final byte[] data = (byte[]) cachedContent;
            renderResponse.getPortletOutputStream().write(data);
        }
    }

    /**
     * Is the user connected? (For example, as contributor)
     * @param renderRequest RenderRequest
     * @return boolean
     */
    private boolean isUserSignedIn(final RenderRequest renderRequest) {
        final ThemeDisplay themeDisplay = (ThemeDisplay) renderRequest.getAttribute(WebKeys.THEME_DISPLAY);
        return themeDisplay.isSignedIn();
    }

    /**
     * Unique key of the content in cache.
     * @param renderRequest RenderRequest
     * @return String
     */
    protected String getCacheKey(final RenderRequest renderRequest) {
        final ThemeDisplay themeDisplay = (ThemeDisplay) renderRequest.getAttribute(WebKeys.THEME_DISPLAY);
        final String portletId = (String) renderRequest.getAttribute("PORTLET_ID");
        final Long groupId = themeDisplay.getLayout().getGroupId();
        final Long layoutPlid = themeDisplay.getLayout().getPlid();
        final String cacheKey = portletId + '_' + groupId + '_' + layoutPlid;

        if (cacheKeyParameters == null) {
            return cacheKey;
        } else {
            final HttpServletRequest httpRequest = getHttpRequest(renderRequest);
            final StringBuilder sb = new StringBuilder(cacheKey);
            for (final String cacheKeyParameterName : cacheKeyParameters) {
                final String cacheKeyParameterValue = httpRequest.getParameter(cacheKeyParameterName);
                if (cacheKeyParameterValue != null) {
                    sb.append('_').append(cacheKeyParameterValue);
                }
            }
            return sb.toString();
        }
    }

    @Override
    public void init(final PortletConfig portletConfig) throws PortletException {
        super.init(portletConfig);
        final String param = portletConfig.getInitParameter("cache.key.parameters");
        if (param != null && !param.trim().isEmpty()) {
            final List<String> parameters = new ArrayList<>();
            for (final String parameter : param.split("[\n,]")) {
                final String parameterTrim = parameter.trim();
                if (!parameterTrim.isEmpty()) {
                    parameters.add(parameterTrim);
                }
            }
            this.cacheKeyParameters = parameters;
        } else {
            this.cacheKeyParameters = null;
        }
    }

    private static HttpServletRequest getHttpRequest(final PortletRequest portletRequest) {
        HttpServletRequest httpRequest = PortalUtil.getHttpServletRequest(portletRequest);
        httpRequest = PortalUtil.getOriginalServletRequest(httpRequest);
        return httpRequest;
    }
}
Then, portlets are declared like this in WEB-INF/portlet.xml:
<portlet>
	<portlet-name>header</portlet-name>
	<display-name>Header</display-name>
	<portlet-class>liferayportletcache.CachedGenericFacesPortlet</portlet-class>
	<expiration-cache>0</expiration-cache>
	…
</portlet>
<portlet>
	<portlet-name>media</portlet-name>
	<display-name>Media</display-name>
	<portlet-class>liferayportletcache.CachedGenericFacesPortlet</portlet-class>
	<!-- tab and page parameters are part of the cache key: for example, "...?tab=VIDEO" and "...?tab=PHOTO" have different contents in cache -->
	<init-param>
		<name>cache.key.parameters</name>
		<value>tab,page </value>
	</init-param>
	<expiration-cache>0</expiration-cache>
	…
</portlet>